Эта статья опубликована под лицензией Creative Commons и не автором статьи. Поэтому если вы найдете какие-либо неточности, вы можете исправить их, обновив статью.

Associations of Middle School Student Science Achievement and Attitudes about Science with Student-Reported Frequency of Teacher Lecture Demonstrations and Student-Centered Learning


Arthur Louis Odom
Clare Valerie Bell
Опубликована Янв. 10, 2015
Последнее обновление статьи Янв. 12, 2023
Эта статья опубликована под лицензией
")


Abstract
The purpose of this study was to examine the association of middle school student science achievement and attitudes about science with student-reported frequency of teacher lecture demonstrations and student-centered learning. The student sample was composed of 602 seventh- and eighth-grade students enrolled in middle school science. Multiple regression was used to investigate the association of attitudes toward science, student-centered learning, and teacher demonstrations with science achievement. Both attitudes toward science and student-centered learning were positively associated with science achievement, and student-centered learning was positively associated with attitude toward science. Teacher demonstrations were found to have a negative association with student achievement, and no significant association with attitudes toward science. Findings of this study suggest that demonstrations provide insufficient opportunity for students to develop an understanding of the processes of science. Furthermore, observing teacher demonstrations may be valuable, but they are not a substitute for laboratory investigations by students.
Ключевые слова
Attitudes, Science achievement, teacher lecture demonstrations
INTRODUCTION
Teaching practices have long been theorized to be key variables affecting student science achievement. Nearly 100 years ago John Dewey (1916) argued the importance of a child’s experiences in learning science: “Give the pupils something to do, not something to learn; and the doing is of such a nature as to demand thinking; learning naturally results (p. 154).” Yet until the latter half of the nineteenth century, science, more specifically physics, was taught exclusively by lecture, demonstration, and the textbook (Turner, 2012). Teachers presented scientific findings to essentially passive students. Teachers would use scientific instruments to illustrate or confirm content during lectures. Many schools could not afford expensive scientific instruments and would instead spend money on demonstrations. These demonstrations were more amusing than educational. In the late 19th century, many science teachers viewed scientific instruments for demonstrations as “expensive playthings.” Harvard Professor John Trowbridge wrote (Gage, 1882, as cited in Turner, 2012) about his recollection of learning after completing a physics class:
“We remembered a tuning-fork, an electrical machine, and a big electro-magnet which lifted the smallest boy in school, and that was all we remembered of natural philosophy.” (p. 249)
Although laboratory science became more common into the twentieth century, lecture demonstrations have continued to be a mainstay in science classrooms. Currently, many colleges and universities employ staff to prepare lecture demonstrations to advertise course offerings and increase enrollment. Some science material suppliers offer prepackaged kits and accredited courses to encourage science demonstrations in science classrooms (Price & Brooks, 2012). Harvard University maintains a website of lecture demonstrations (Harvard Lecture Demo Team, 2013) with more than 100 computer simulations, videos, and science demonstrations cataloged, and boasts in a mission statement,
We provide visual demonstrations for a wide variety of topics to supplement lectures in physics, chemistry, astronomy, and biology. Our lecture demonstrations have two important purposes: to increase student understanding of die concepts demonstrated, and to increase student enjoyment of class. Working with members of faculty and testing our skills in machining, electronics, and dazzling imagery, we [die Natural Sciences Lecture Demonstrations team] aim to clarify and enhance die scientific concepts presented in lecture with visible, memorable, and sometimes mind-blowing effects. (http://sciencedemonstrations.fas.harvard.edu/icb/icb.do)
Clearly lecture demonstrations did not die at the advent of teaching science in laboratories, and die question remains: do lecture demonstrations improve student achievement and attitudes toward science? The plethora of science demonstrations found in science education literature would suggest die answer to die questions is yes. But according to the National Research Council (2006, as cited in National Science Teachers Association, 2007), “[w]hile reading about science, using computer simulations, and observing teacher demonstrations may be valuable, they are not a substitute for laboratory investigations by students (NRC 2006, p.3).”
Lecture demonstration refers to watching the teacher do experiments. Lecture demonstrations are teacher-led with students passively observing the results. The teacher may pose questions or ask for predictions but students are not physically engaged with science materials or socially engaged with peers. The source of knowledge is die teacher via lecture demonstration in contrast to student-centered learning which positions die student’s experience as the source of knowledge, not die teacher.
Odom, Stoddard, and LaNasa (2007) described student-centered learning as die process of constructing declarative and procedural knowledge, which can be initiated and guided by a question or problem, requiring students to negotiate how to answer the question or solve the problem through discussion. The resulting discussions about problem solving may cause students to conclude that many questions and problems have more than one viable answer or solution and motivate students to seek evidence to derive answers or solutions. In other words, student-centered learning provides a context for social interaction to derive scientific knowledge and understand the nature of science.
There is limited evidence that supports die use of lecture demonstrations to improve achievement and attitudes of middle school science students. Price and Brooks (2012) found that chemistry teachers perceive substantial positive effects on students’ performance on classroom assignments following lecture demonstrations. They also reported a positive effect on learners’ motivation. McKee, Williamson, and Ruebush (2007) examined college chemistry students’ knowledge and understanding of the mole relationship in chemical reactions. They reported that both inquiry laboratories and instructor-led demonstrations increased conceptual understanding, but found no significant difference between die two groups. In contrast, Minner, Levy, and Century (2010) conducted a research synthesis study on the impact of inquiry science instruction on K—12 student outcomes and reported that students who received discovery instruction (a student-centered approach) retained physical science content better than students who received instruction via teacher demonstrations and worksheets.
Lecture demonstration, like lecture, involves passive processes of watching die teacher present content. Ausubel (1968) asserted that rote learning and memorization, which is associated with die common practice of using lecture notes to learn (including lecture demonstrations), is an arbitrary, verbatim, non-substantive incorporation of new ideas into cognitive structure. He explained that such information may enter cognitive structure, but with no specific relevance to existing conceptual frameworks. More importantly, rote learning and memorization may cause interference with previous similar learning, and may result in difficulties with patterns of recall, including misassociations.
Lecture demonstrations provide opportunities for passively gaining declarative knowledge with little opportunity to develop procedural knowledge. According to Lawson, Abraham, and Renner (1989), there are two fundamental types of knowledge: declarative and procedural. Declarative knowledge is ‘knowing that’, and procedural knowledge is ‘knowing how’. The acquisition of declarative knowledge is a constructive process that makes use of procedural knowledge. Students can learn by memorization, but such learning will not improve procedural knowledge. The motivation to improve procedural knowledge is provided when students participate in the constructive process. Then die learning of declarative knowledge becomes more meaningful and retention more complete. This gives students a means to better understand and explain nature—by generating and testing their own ideas.
In addition to teaching practices, students’ attitude toward science is a variable that has been positively associated with science achievement. This positive association has been seen specifically during the middle school years (Odom et al., 2007), which is especially noteworthy because negative feeling about science increases between elementary and high school (George, 2000). In die present study, attitude toward science refers to feelings about school science (Simpson, Koballa, Oliver, & Crawley, 1994), or more specifically, whether a student “likes or dislikes science” (p. 213). Similarly, Koballa and Glynn (2007) referred to attitude toward science as a positive or negative feeling and distinguished attitude from related terms such as value, belief, and opinion. Both Simpson et al. (1994) and Koballa and Glynn (2007) found significant relationships between student science achievement and attitudes toward science. One explanation for dais relationship may be the well-established importance of task value to learning achievement (Ricco, Pierce, & Medinilla, 2010). Task value is a motivational factor that refers to how much a student considers something to be important or relevant (Pintrich & DeGroot, 1990). For example, task value can be indicated by the professed attitudes of students toward science, and one would expect students who place a higher value on a science task to achieve more in learning about the subject. It has also been shown that teacher practices and student attitudes are directly correlated. For example, Odom et al. (2007) found that seventh-grade students’ attitudes toward science were positively associated with student-centered teaching practices and negatively associated with traditional (teacher-centered) teaching practices. In another study, collaborative project-based Geographic Information System (GIS) science units featuring group work and data analysis were positively associated with eighth-grade students’ attitudes and achievement (Baker & White, 2003).
RATIONAL
The evidence that is available on the use of lecture demonstrations to improve achievement and attitudes is limited to high school and college level science students. Synthesis studies have been used to compare studentcentered instruction with science teacher demonstrations but are limited in their generalizability to middle school science students. Although we did not address the frequency of teachers’ use of lecture demonstrations beyond our sample, the abundance of science demonstrations found in science education literature would suggest that demonstrations are common. Even more concerning was the lack of evidence that these science demonstrations improve science achievement. In an exploratory factor analysis on a survey of student-reported frequency of student- and teacher-centered instructional practices, Odom et al. (2007) and Odom, Marszalek, Stoddard, and Wrobel (2011) found that near-daily implementation of group experiments and reduction of extensive note-copying during class yielded the greatest positive impact on student achievement. A single teacher demonstration item was included in the survey [which loaded with the factor labeled teacher-centered instructional practices (Odom et al., 2007)]. When the demonstration item was examined alone there was a noticeable negative association with science achievement which justified further examination.
RESEARCH QUESTIONS
The research questions guiding this study were:
- What are the associations among middle school student science achievement with student-reported frequency of teacher lecture demonstrations, student-centered learning, and attitudes about science when baseline science achievement is held constant?
- What are the associations among student-reported frequencies of student-centered learning and science teacher demonstrations with student attitudes toward science?
METHOD
Participants
The student sample was composed of 602 seventh- and eighth-grade students enrolled in middle school science classes taught by eight different teachers from seven different school districts in a Midwestern US state. One hundred ninety-five of the students were from suburban school districts (32 percent) and 407 of the students were from rural school districts (68 percent). A total of 29 percent of students were eligible to receive free or reduced- price lunch. Eight percent of students were African American, two percent Asian American, one percent Native American, eighty four percent White, and five percent were reported as Other. Participating teachers voluntarily took part in an action research project for the current study. The teachers were self-selected in response to recruitment materials that were sent via email to school buildings. An incentive package for teacher recruitment included a cash stipend, science materials, and optional graduate credit.
INSTRUMENTS
Science Achievement Influences Survey Version 3 (SAISv.3). The SAIS was originally designed to assess the combined effects of student attitudes toward science, peer interaction and home support, and the frequency of student- and teacher-centered instructional practices on student achievement. SAI Sv. 2 was revised to include computer usage items. As previously reported in Odom et al. (2007, 2011), SAIS and SAI Sv. 2 scores indicated that student-centered teaching practices had a positive association with middle school student achievement and a negative association with teacher-centered teaching practices and computer usage to learn science. In addition, middle school student attitudes toward science were positively associated with student-centered teaching practices, and negatively associated with teacher-centered teaching practices (Odom et al., 2007), and computer usage and teacher-centered teaching practices were not significant predictors of attitudes (Odom et al., 2011).
Because a composite measure usually has greater reliability and validity than a single-item measure (McDonald, 1999), two items were added to SAISv.2 for the current study on frequency of teacher lecture demonstrations to learn science. Each item was examined by a physicist, a science educator, and science teacher to assess content validity. The final revised instrument consisted of 14 items, and is subsequently referred to as the Science Achievement Influences Survey version 3 (SAISv.3). Items relied on graded response scales to capture student selfreported attitudes toward science (five options: Strongly Disagree, Disagree, Undecided, Agree, Strongly Agree) and frequency of classroom practices (five options: Tess than Once a Month, About Once a Month, About Twice a Month, About Once a Week, More than Once a Week).
Principal components analysis (PCA) was used with each scale to obtain evidence of construct validity. The first two scales were taken from the original SAIS: Attitudes Toward Science (ATT) and Student-Centered Teaching Practices (SC). The third scale, Teacher Demonstrations (DEMOS), consisted of the two additional items of the SAISv.3. Because multi-factor models are less constrained than single factor models, two measured variables per factor are allowed as long as they are permitted to correlate. With single factor models at least four measured variables are required (Kaplan, 2000).
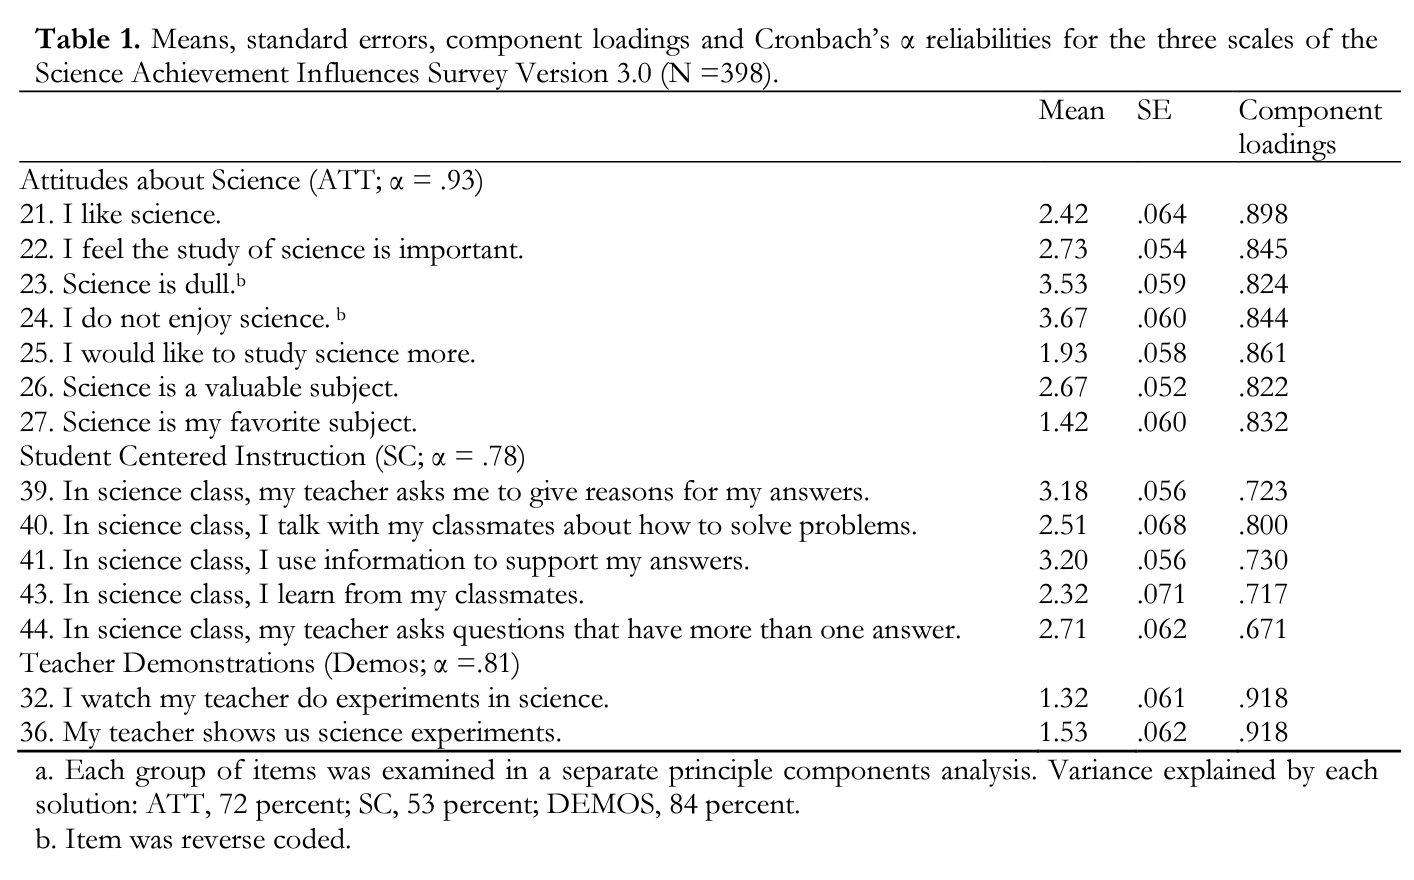
Each PCA resulted in a single component solution using the Kaiser criterion. Seventy-one percent of the variance for the seven items of the ATT scale was explained by a single component structure, and standardized component loadings of the items ranged from 0.82 to 0.89 (results are summarized in Table I). The SC scale initially included seven items (Odom et al., 2007) that were included in the PCA but explained only 42% of the variance. The two items with the smallest component loadings were dropped. Fifty-three percent of the variance from the five items of the SC scale was explained, and component loadings ranged from 0.67 to 0.80. Cronbach’s alpha for these two scales were 0.93 and 0.78, respectively, which is considered acceptable (Carmines & Zeller, 1979). Eighty- four percent of the variance of the two DEMOS items was explained, and loadings were .92 for each item, indicating that the component accounted for a large amount of variance in each item. The inter-item correlation was .69 indicating that the items measured similar but distinct attributes of DEMOS. Cronbach’s alpha was 0.81, which is considered acceptable. Scales on the SAISv.3 were scored by summing the individual item scores, and the scale scores were then used in subsequent analyses.
Science content knowledge test. Content knowledge was assessed with a teacher-constructed test that consisted of twenty-one multiple-choice items. The content test addressed the following topics: states of matter, energy, solar energy, condensation, precipitation, evaporation, radiation, conduction, convection, temperature, and air pressure. The multiple-choice items started with a question followed by three or four response options following Missouri Assessment Program (CTB/McGraw-Hill EEC, 2008) guidelines. Selected-response items that started with a stimulus stem followed by multiple options for completing the sentence were included. The multiple options included two to three distractors and one desired answer. A physicist, a science educator, and a science teacher- examined each item to assess content validity. The difficulty indices (means by item) ranged from 0.33 to 0.93 for the post-test, and 0.17 to 0.85 for the pre-test, evidence of a wide range of difficulty and a lack of floor and ceiling effects. The discrimination indices are a measure of the degree to which each item correlates with success on the whole test and an indication of how well the individual items measure the construct (in this case, science learning achievement). Given that the goal of the construction of the content test was to generate pre-test and post-test scores, any item with negative or zero discrimination indices would weaken the validity of the test scores. The discrimination indices ranged from 0.31 to 0.57 for the post-test, and 0.20 to 0.53 for the pre-test, which was within the recommended lower limit of 0.20 (Ebel, 1954). The estimated KR.-20 reliability was 0.76 for the post-test which is acceptable, and 0.67 for the pre-test which is questionable and caution is recommended. Evidence of the content validity of this test, as well as the psychometric indicators of its scores, suggested that the test scores would allow accurate assessment of the students' science understanding.
PROCEDURE
Teachers of the science students participated in three weeks of summer professional development (PD) at a Midwestern university that was taught by university professors and a high school science teacher. The PD focused on student-centered instruction and inquiry (Lawson, 1995). The student-centered pedagogy modeled by investigators to improve participants’ pedagogical knowledge included active laboratory investigations. Teachers explored content areas of physical science, life science, earth science, and environmental science through approximately 30 inquiry-based lessons that addressed Missouri Grade Level Expectations and Course-Level Expectations (Missouri Department of Elementary and Secondary Education, 2008) to improve participants’ content knowledge. To encourage teachers to implement student-centered instruction beyond the summer PD, each teacher received a classroom materials kit with the corresponding lesson plans. Participant teams developed instructional units for action research to measure the impact of professional development. During the fall of the next school year, they were asked to implement the unit of instruction over a period of three weeks.
As part of the unit plan, teachers created a science content test. The teacher-constructed test was administered as a pre-test at the start of instructional activities as a control for prior knowledge and again as a post-test at the end of instructional activities. The survey (SAISv.3) and content knowledge tests were administered via a secure website designed for this study. Students logged onto the site and entered an identification number provided by the teacher before answering the survey or test items. Survey and test data corresponded to instruction of the unit of material that occurred within the three-week window during the fall semester. This study represents a subset of data collected from a team of seventh and eighth grade teachers who developed a common unit of lessons and assessment items.
DATA ANALYSIS AND RESULTS
Data analysis procedures included multiple steps to address the research questions, and were initiated after Items 3 and 4 on the ATT Scale had been reverse-coded (see Table 1) so that response scales were unidirectional and positive, where higher numbers indicated agreement or increased frequency for all items. Prior to analysis, items were inspected for missing data, accuracy of data input, which met the assumptions of multivariate analysis. Evidence for the reliability and validity of the scores obtained with the SAI Sv. 3 and the science content test was assessed. Next, multiple regression using the SAI Sv. 3 scale scores and the pre-test scores to explain post-test scores was evaluated (Research Question 1), and dien multiple regression using SAISv.3 scale scores to explain attitude toward science was evaluated (Research Question 2).
Multiple regression analysis of post-test science scores. Multiple regression analysis was conducted following die guidelines suggested by Nathans, Oswald, and Nimons (2012) and Britner and Pajares (2006) in SPSS. Means, standard deviations, and correlations of die variables used in multiple regression are shown in Table 1. Multiple regression was used to investigate die association of attitudes toward science (ATT), student-centered teaching practices (SC), and teacher science demonstrations with science achievement, defined as post-test content scores when pre-test content scores were held constant (Table 3). Variables were entered into die multiple regression in blocks. Because we wanted to assess the explanatory power of die other variables beyond that of prior content knowledge, the pre-test was entered by itself in Block 1. Pre-test score explained 18 percent of the variance in post-test score [Adj. R2 = 0.18, F(l, 360) = 80.33, p < 0.001], a medium effect size (Cohen, 1988). The scale variables ATT, SC, and DEMOS, were entered into Block 2, which explained an additional 3 percent of the variance [AR2 = 0.03, F(3, 357) = 4.89, p < 0.05], a small effect size. Interactions among die variables ATT, SC, and DEMOS were examined for each possible two-way combination, but none was significant.
The standardized versions of die В coefficients are die [3 values, which provide a measure of the unique explanatory power of die independent variables relative to one another; thus, die higher the [3, the greater the unique impact of die predictor variable on die criterion variable. Pre-test had die largest unique explanatory effect with other variables controlled ([3 = 0.435, p < 0.001) followed by DEMOS ([3 = -.106, p < 0.05), ATT ([3 = 0.105, p < 0.05), and SC ([3 = 0.101, p < 0.05). Ml showed significant relationships with post-test scores. The zero order correlation of pre-test with post-test (r=.437) was largest. Zero order correlations of ATT, SC, and DEMOS were 0.132, .042, and -.103, with die magnitude and direction with consistent with die [3 values (Table 2). The squared structure coefficient (r2s=.85) demonstrated that pre-tests explained the largest amount of variance in post-test, followed by ATT (r2s=.O8), DEMOS (r2s=.O5), and SC (r2s=.01). Both die unique and common commonality effects were used to determine the variance shared and variance not shared by other independent variables. Pre-test percentage contributed the greatest variance to a regression equation (0.18) that was not shared with other independent variables, followed by 0.01 for ATT, SC, and DEMOS. The common commonality effects were less than 0.01 for each independent variable indicating that there was no shared variance among independent variables.
Multiple regression analysis of attitude toward science. Next, multiple regression was used to investigate the association of SC, and DEMOS, with ATT. Summarized in Table 4, R2 for the regression was significantly different from zero with F(2, 395) = 13.97 (p < 0.001), and accounted for approximately 6 percent of the variance (Adj. R2 = 0.06), a small effect size (Cohen, 1988). SC was a significantly associated with ATT with other variables controlled: (B = 0.388, p < 0.001, [3 = 0.258). DEMOS was not a significant predictor of ATT. Interactions among the variables SC and DEMOS were examined for a possible two-way combination, but were not significant. Zero order correlations of SC (0.203, p<.001) and DEMOS (.074, p>.05) with ATT were consistent with magnitude and direction of the [3 values. The squared structure coefficient (r2s=.66) demonstrated that SC explained the largest amount of variance in ATT, followed by DEMOS (rV—.09).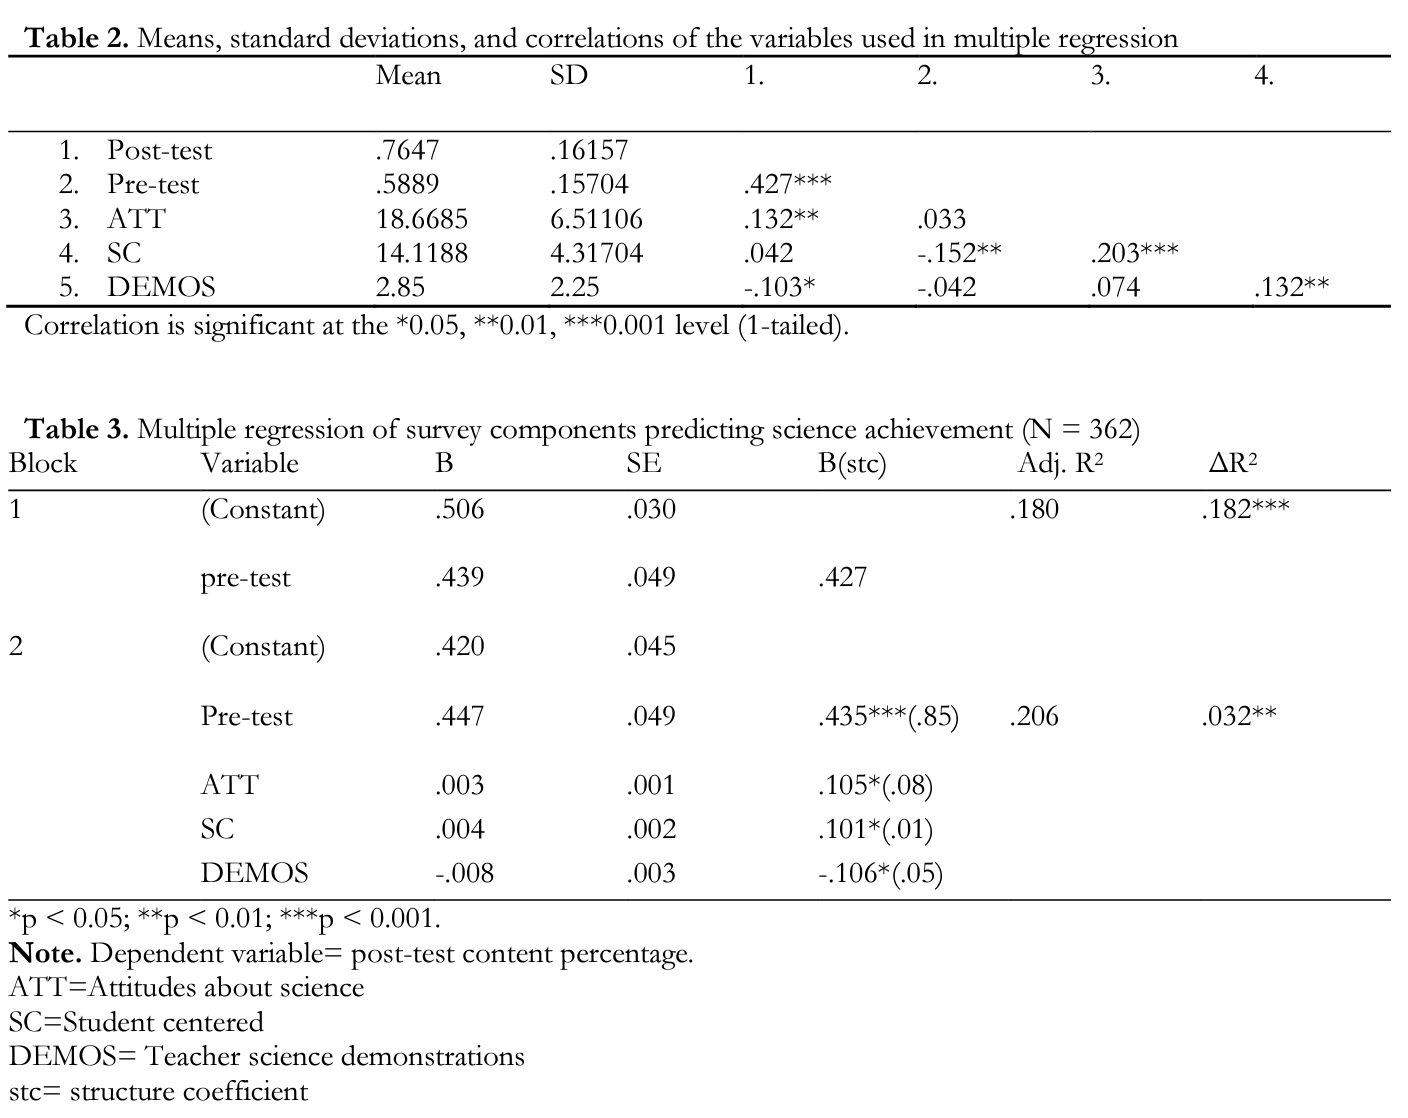
DISCUSSION/IMPLICATIONS
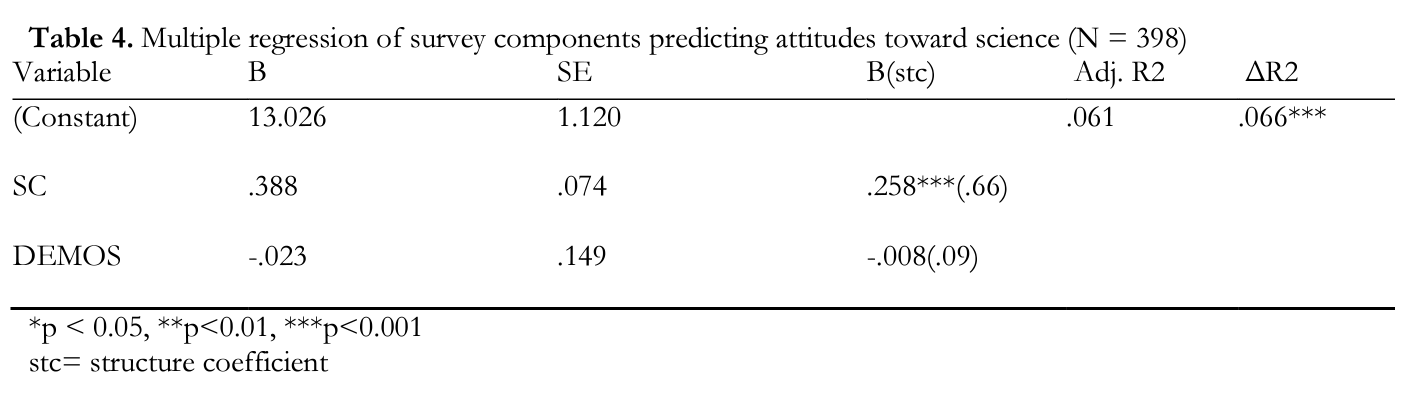
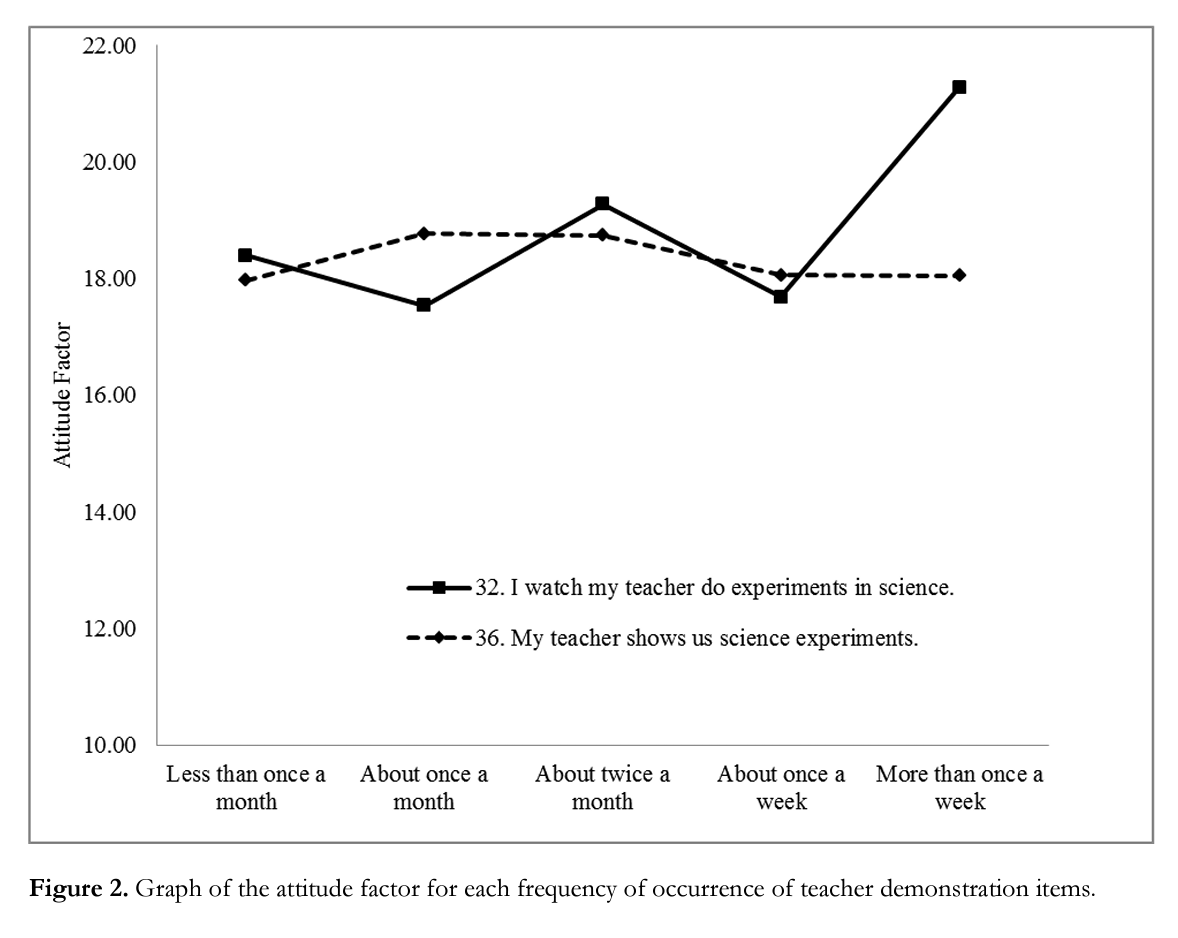
Without over emphasizing the results of this study, they were consistent with previous findings about the importance of student-centered instruction in learning (Odom et al., 2007, 2011). The effect sizes were medium for the previous studies and low for the current study, but the overall trend was the same. The size and diversity of the current student sample population and the detail of SAI Sv. 3 items lend support for the generalizability of our results on the impact of different science-learning activities on science achievement. As reported in Table 3, there was a strong positive association of attitudes toward science and frequency of student-centered teaching practices with science achievement. Table 5 is graphically represented in Figure 1, providing the adjusted post-test mean for each frequency of occurrence of teacher demonstration items. When the frequency of watching teachers do experiments or show experiments increases, there is a drop in adjusted post-test mean, seven points and five points, respectively. Figure 2 graphically represents attitudes about science for each frequency of occurrence of teacher demonstration items. There is no significant relationship between student attitudes and teacher science demonstrations.
These results allow a deeper consideration of the mechanisms by which teacher science demonstrations influence student achievement in science. For instance, demonstrations can be tedious for students, just as individual work lacking physical and social interaction can be. Because demonstrations do not actively engage students, demonstrations are little more than three-dimensional lectures. The present study suggests that demonstrations provide insufficient opportunity for students to develop an understanding of the processes of science or to make use of procedural knowledge in developing conceptual understanding.
Similar to science demonstrations, traditional teaching practices are associated with individual work, reduced social interaction, and limited concrete experiences through which to learn science concepts. Traditional teaching practices lend themselves to rote memorization of scientific knowledge (Odom et al., 2007, 2011). Students may disengage from learning because of the traditional use of demonstrations. For example, students may passively take notes based on observations of the teacher demonstration or lecture. Once a learner becomes disengaged due to one aspect of learning, other aspects of learning may either re-engage the learner or further disengage the learner. Even more concerning was the lack of evidence that these science demonstrations improve science achievement.
Additional research on the association of teacher demonstration lectures with attitudes and achievement is needed. The abundance of science demonstrations found in science education literature and lack of evidence that these science demonstrations improve science achievement is alarming. We concede that this study has not definitively found that teacher demonstrations are always negatively associated with student achievement. However, if science teacher demonstrations continue to be a large part of science education, then additional research is needed. Furthermore, without a solid research base on teacher demonstrations, it will be impossible to make informed decisions on how and when to use demonstrations for science instruction.
Guidelines for using Teacher Demonstrations
Teacher demonstrations may occasionally be necessary when materials are in short supply or if there is a safety hazard associated with the lesson. With that premise, we recommend die following:
- Engage small groups of students during the demonstration. Encourage social interaction among students.
- Allow students to gather as close to die laboratory set-up as safety permits during die demonstration and avoid lecturing.
- Guide information and data collection during die demonstration with carefully worded research questions.
- Emphasize knowledge construction based on evidence from the demonstration.
- Avoid interpreting results for students. Guide diem to do the interpretation.
LIMITATIONS
The participating subjects were sevendi-and eighth-grade, Midwest, rural and suburban students enrolled in middle school science classes. This sample may not generalize to other grade levels, geographical regions, or content areas. A second limitation is that this study is correlational; therefore, causal inferences cannot be made. Although the possibility of a testing effect exists, we think it is remote, because the time between testing sessions was at least three weeks in duration, and the reliability of the post-test was not extremely high (0.76, in fact) and close to that of the pre-test (0.67). A testing effect would not represent a threat to internal validity in any case, because no inference has been made about the pre-test/post-test comparison. The focus of die current study was on controlling for die prior science achievement of the participants. A possible third limitation to the current study is that the SAISv.3 is a relatively new instrument, and consequently has a limited amount of evidence for the validity of its measures.
REFERENCES
- Ausubel, D. (1968). Educational psychology: A cognitive view. New York: Holt, Rinehart, and Winston.
- Baker, T. R, & White, S. H. (2003). The effects of GIS on students' attitudes, self-efficacy, and achievement in middle school science classrooms, journal of Geography, 102(6), 243-254.
- Britner, S. L., & Pajares, F. (2006). Sources of science self-efficacy beliefs of middle school students. Journal of Research in Science Peaching, -13(5), 485-499.
- Carmines, E. G., & Zeller, R. A. (1979). Reliability and validity assessment. Newbury Park, CA: Sage.
- Cohen, J. (1988). Statistical power analysis for the behavioral sciences (2nd Ed.). Hillsdale, NJ: Lawrence Erlbaum.
- CTB/McGraw-Hill LLC. (2008). Missouri assessment program, technical report 2008. Monterey, CA: Author.
- Retrieved April 4, 2014, from http://dese.mo.gov/divimprove/assess/tech/documents/2008MAPTechnicalReport.pdf
- Dewey, J. (1916). Democracy and education: An introduction to the philosophy of education. New York: Macmillan.
- Ebel, R. L. (1954). Procedures for the analysis of classroom tests. Educational and Psychological Measurement, 14, 352— 364.
- George, R. (2000). Measuring change in students’ attitudes toward science over time: An application of latent variable growth modeling. Journal of Science Education and Technology, 9, 213-225.
- Harvard Lecture Demo Team. (2013). Natural sciences lecture demonstrations. Retrieved April 4, 2014, from http://isites.harvard.edu/icb/icb.do?keyword=kl6940&pageid=icb.page80641
- Kaplan, D. (2000). Secondary statistical modeling with the National Assessment of Adult Literacy implications for the design of the background questionnaire. Darby, PA: DIANE Publishing.
- Koballa, T. R., & Glynn, S. M. (2007). Attitudinal and motivational constructs in science learning. In S. Abell & N.
- Lederman (Eds.), Handbook of research on science education (pp. 75-102). Mahwah, NJ: Lawrence Erlbaum.
- Lawson, A. E. (1995). Science teaching and the development of thinking. Belmont, CA: Wadsworth.
- Lawson, A. E., Abraham, M. R., & Renner, J. W. (1989). A theory of instruction. NARSTMonograph, No. 1.
- McDonald, R. P. (1999). Test theory: A unified treatment. Mahwah, NJ: Lawrence Erlbaum.
- McKee, E., Williamson, V. M., & Ruebush, L. E. (2007). Effects of a demonstration laboratory on student learning.
- Journal of Science Education and Technology, 16(5), 395-400. doi:10.1007/s 10956-007-9064-4
- Minner, D. D., Levy, A. J., & Century, J. (2010). Inquiry-based science instruction—what is it and does it matter? Results from a research synthesis years 1984 to 2002. Journal of Research in Science Teaching, 77(4), 474-496.
- Missouri Department of Elementary & Secondary Education. (2008). Missouri grade-level expectations: Science. Retrieved April 4, 2014, from http://dese.mo.gov/divimprove/curriculum/GLE/SCgle.html
- Nathans, L. L., Oswald, F. L., & Nimon, K. (2012). Interpreting multiple linear regression: A guidebook of variable importance. Practical Assessment, Research Evaluation., 17(9), 2.
- National Science Teachers Association (NSTA). (2007). NSTA position statement: The integral role of laboratory investigations in science instruction. Retrieved April 4, 2014, from http://www.nsta.org/about/positions/laboratory.aspx
- Odom, A. L., Marszalek, J. M, Stoddard, E. R., & Wrobel J. M. (2011). Computers and traditional teaching practices: Factors influencing middle level students’ science achievement and attitudes about science. International Journal of Science Education, 33(17), 2351-2374.
- Odom, A. L., Stoddard, E. R., & LaNasa, S. M. (2007). Teacher practices and middle-school science achievements. International Journal of Science Education, 29(11), 1329-1346.
- Pintrich, P. R., & De Groot, E. V. (1990). Motivational and self-regulated learning components of classroom academic performance. Journal of Educational Psychology, 82, 33-40.
- Price, D. S., & Brooks, D. W. (2012). Extensiveness and perceptions of lecture demonstrations in the high school chemistry classroom. Chemistry Education Research and Practice, 13(f), 420-427.
- Ricco, R., Pierce, S. S., & Medin ilia, C. (2010). Epistemic beliefs and achievement motivation in early adolescence. The Journal of Early Adolescence, 30(2), 305-340.
- Simpson, R. D., Koballa, T. R., Oliver, J. S., & Crawley, F. E. (1994). Research on the affective dimension of science learning. In D. Gabel (Ed.), Handbook of research on science teaching and learning (pp. 211-234). New York: Macmillan.
- Turner, S. C. (2012). Changing images of the inclined plane: A case study of a revolution in American science education. Science Education, 21, 245-270.
Похожие статьи
Dr. Vasilia Christidou
Oduola O Abiola
Harkirat S Dhindsa
Dr. Bulunuz
Elvan Sahin
Hamide Ertepinar
Gaye Tuncer Teksoz