Эта статья опубликована под лицензией Creative Commons и не автором статьи. Поэтому если вы найдете какие-либо неточности, вы можете исправить их, обновив статью.

Human capital scenario analysis as an organizational intelligence tool for performance management


Marko Kesti
Antti Syväjärvi
Jari Stenvall
Jari Stenvall
Mario Rivera
Опубликована Март 22, 2011
Последнее обновление статьи Дек. 6, 2022
Эта статья опубликована под лицензией
")


Abstract
This article describes a method for human capital scenario analysis, one that may be used as an organizational intelligence (OI) tool capable of supporting management decision-making. Here, scenario analysis supports a knowledge management based (KM-based) decisional method for integrating human resource (HR) and fiscal data in performance measurement. This OI scenario analysis tool may be used in strategic management, organizational development, performance measurement, and HR-related risk mitigation. The aim is to strengthen decisional capacity with regard to the management of human capital and in general with regard to the advancement of organizational performance and productivity goals. The approach taken is that of human capital scenario analysis using system dynamics methods. Scenario analysis equations are developed on the basis of empirically-grounded research that has been conducted for several years at private companies and municipal organizations in Finland. The scenario analysis (SA) tool successfully integrates organization-level human resource knowledge management with business scorecards, thereby assisting management decision-making. Through their use of the SA tool, managers can advance organizational learning and improve strategic decision-making. Human resource and organizational competencies are considered together, so that managers may consider key factors affecting future performance comprehensively, in their long-range decision-making. The SA model was developed during a period of steady economic growth in Finland. While the model was created using the most germane literature and empirically grounded research, contextual factors such as relative economic prosperity may limit generalizability to other contexts. The article describes how human resource metrics and competencies may inform performance measures, in particular business scorecards. The development of key competencies improves organizational performance and performance outcomes. As suggested by game theory, and by models of tacit communications, organizational competencies can be developed and performance outcomes enhanced by using “tacit signals” that are conducive to the realization of desired scenarios
Ключевые слова
Human capital, scenario analysis, KM, organizational intelligence
Introduction
Human capital productivity has been calculated using metrics such as total revenue, sales margins, staff expenditures, staff absenteeism and turnover, and revenue/person (Kesti, 2007). One of the best human productivity indicators is acknowledged to be human capital return on investment (HCROI), which is sales margin divided by staff costs. Following these metrics is essential, but there should also be an understanding of the way such scorecards integrally affect and are affected by the given organization. Jack Welch (2005) argues out that human capital metrics should be as important for management decisionmaking as financial data. If these metrics were closely integrated with (or into) multi-criteria business scorecards, they could be given greater and more effective consideration in human resource decision-making. Investments in human capital have also been shown to be important in preventing or mitigating business risks, and they are, therefore, essential to risk management (Kesti et al., 2009; Kesti and Syväjärvi, 2010; TYKES, 2009).
Tacit signaling, long a mainstay of game theory and of organizational communications and motivation studies, is gaining recognition in strategic human resource management studies, in large part because of the work of one of the authors (Kesti et al., 2009). Kesti’s research into tacit signaling has raised the possibility of estimation models that would allow for a priori calculation of human capital risks and business possibilities (Kesti et al., 2009).
Human resource management defines how organizational human capital may be aligned with strategy. Organization intelligence defines how organizational competencies and capabilities may be utilized systemically. Human resource management and organizational intelligence together produce the systemic capacity needed to achieve strategic goals (Ulrich and Brockbank, 2005).
This research study will present a human capital scenario analysis model cast as an OI tool, one whereby mathematically-defined linkages are created among the operational elements of human resources, organization intelligence, and fiscally- oriented business scorecards. Scenario analysis (SA) here includes exact HR metrics such as staff absenteeism, labor mobility (such as transfers and resignations), and personnel turnover, but also intangible assets related to knowledge management and other organizational competencies. Such SA can inform the strategic planning of human capital development investments, as well as corresponding risk management. Crisis management often relies on a kind of scenario analysis, i.e., planning for worst-case scenarios as way to either prevent or recover from catastrophes (see Welsh, 2005). Whether in crisis or ordinary circumstances, it is essential to gain an appreciation of the complexity of the organization’s overall work system (Kleiner, 2006). It is also necessary to engage in generative, creative ideation (Senge, 2006).
1. Human capital scenario analysis: theoretical background
Intelligence can be seen as the ability to learn, reason, and understand (Longman, 1987). Organizational intelligence (OI) refers to the management of both business and public policy intelligence. Nonaka and Takeuchi (1995) elucidate the mutually-reinforcing ways in which tacit and explicit knowledge interact to create the totality of organizational intelligence. Human capital can be tied to OI in connection to three defining elements: employee competencies, germane internal structures, and external domains such as customer relations and relationship management (Sveiby, 1997). HR-related business intelligence may be broadly applied in managerial decision systems (Hameed, 2004).
System dynamics - in one sense of the term - is a method for modeling complex systems by using computer-aided simulation. In the mid-1950s, Jay Forrester was able to show with his systems simulation that instability in general electric employment was principally due to the internal structure of the firm and not to external forces such as the business cycle (Forrester, 1961). Personnel performance has since been modeled using system dynamics considering factors such as staff workload stressors and employee fatigue (Rodrigues et al., 2006; Lyneis et al., 2001; Sterman, 2000).
The human capital scenario analysis (HCSA) approach taken here uses systems dynamics methodology describe the interplay of complex organization factors - performance drivers - that contribute to performance outcomes. Our approach links organization human resource (HR) metrics, HR competencies, and organization development to given organizational performance measurement systems or business scorecards. These competencies consist of management capabilities, leadership qualities, organizational culture, organizational processes, and individual and group skill sets (Kesti and Syväjärvi, 2010). HCSA is an essential, competency-based organizational development and assessment tool, which we build around the concept of tacit signaling, a form of implicit communication of productivity norms in organizations (see Kesti at al., 2008, 2009; Kesti and Syväjärvi, 2010). Our SA tool was applied, tested, and developed at a large Finnish company with nineteen business units, during a period of steady economic growth in Finland (years 2005-2008). This tool or method and its defining equations were tested and further refined during our current global recession, when downsizing and cutback management have become commonplace. We subjected this method to several forms of structural and behavioral validation (Barias et al., 2000), empirically-grounded field tests, and boundary tests, sensitivity tests, and other control measures (Sterman, 2000).
Our study of Finnish public sector organizations revealed a lack of coherence between management and strategy (Oiva-Kess and Kess, 2010). Human resource practices were certainly in compliance with the requirements of law, but the agencies involved failed to fit human resource investments to organizational strategy. Across the board, moreover, these agencies lacked adequate performance-assessment practices suited to the evaluation of strategic performance and productivity (Oiva-Kess and Kess, 2010; see also Wilenius, 2008).
The development and measurement of essential competencies is essential to strategic knowledge management in organizations, since such competencies include organizational learning attributes that are critical for sustained productivity and growth (Kesti and Syväjärvi, 2010; Kesti, 2005, 2007; Bakker and Demerouti, 2007; Hackman and Oldham, 1980). Competencies can be measured for each distinct group in the organization with use of the aforementioned tacit-signal method (Kesti et al., 2008). Competency measures are in turn linked to scorecards like quality costs, absenteeism and turnover, and net profits.
Tacit signal measures fit well with Balanced Scorecard methods, in particular with regard to the dimensions of organizational learning and growth (Kaplan and Norton, 1996).
Defining elements of organizational learning and development include employee participation in managerial decision-making, planning, implementation, and the engagement of self-directed groups and teams. It is by virtue of such employee investment in management processes that the quality of work life is improved, and with it staff and organizational performance (Ramstad, 2009; Kesti and Syväjärvi, 2010; Welch and Welch, 2005).
The Finnish Ministry of Trade and Industry has sponsored research indicting that quality-related cost drivers associated with human resource management (HRM) account for approximately six percent of lost revenue, and that the main cause for these quality costs are human error and wasted labor (Andersson et al., 2004). These findings suggest directions for human resource competency development for the sake of improved quality control, higher productivity, and greater profitability (Kesti et al., 2009).
2. Human capital scenario analysis principles
The basis of the human capital scenario analysis approach, here presented, is that there has to be a causal relationship between human resources and business or organizational results. Organizational process and applied analytics should conform to certain cause-effect rules, which are (Cascio and Boudreau, 2008):
- an effect does not happen until after the cause;
- cause and effect are actually shown to be related;
- the posited cause-effect linkage has no plausible rival hypothesis.
Our HCSA approach follows three meta-principles that conform to these requirements in most organizational contexts:
- revenue comes from staff activities (effective working time and productivity);
- staff direct costs (pay and benefits) bear directly on productivity outcomes;
- staff activities are also accountable as indirect costs (in particular, quality costs).
In addition to these meta-principles, our analysis utilizes a number of simultaneously active subhypotheses, as follows:
- turnover increases demand for resources and time devoted to the orientation of new (replacement) employees;
- absenteeism directly diminishes effective working time;
- competence development will improve work time effectiveness, or effective work time;
- competencies are improved by systematic internal training efforts;
- reducing the number of employees will increase employee capacity/competency development needs;
- increasing the number of employees will also increase capacity/competency development needs;
- increasing work time effectiveness - effective work time - will increase revenues and/or other indicators of organizational effectiveness;
- increased capacity along divisional or branch lines will improve capacity utilization.
Continuous improvement of organization performance will: (1) reduce employee absenteeism and turnover; (2) improve human resource capacity with respect to essential competencies; (3) bring quality cost savings to (reduce quality costs from) HRM.
As previously indicated, we define our OI model by way of five interrelated competencies: management capabilities, leadership qualities, organizational culture, organizational process; and individual and group skill sets (Kesti and Syväjärvi, 2010). These are key performance drivers in any organization, private or public.
The following graphic outlines the key factors or variables in the human capital OI system:
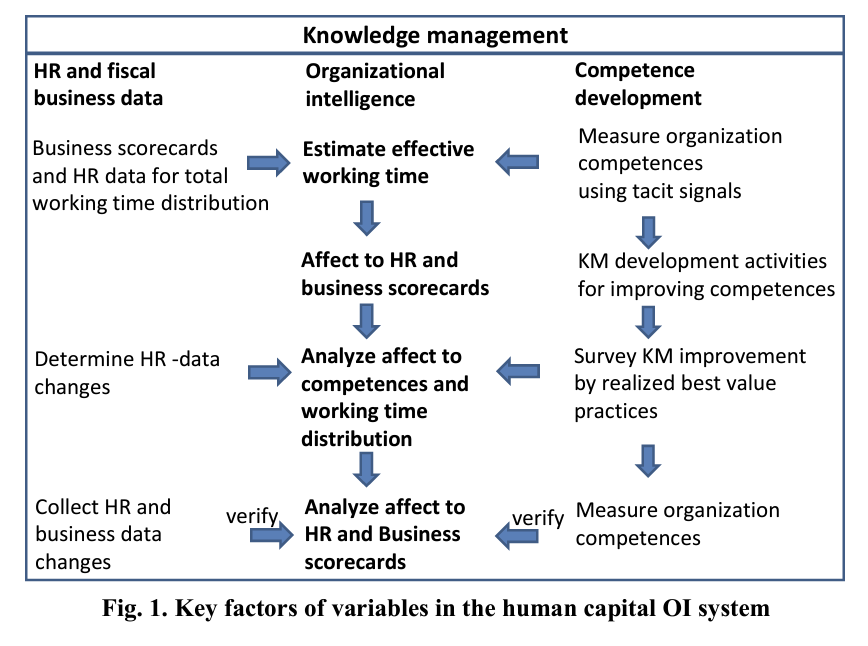
2.1. Competencies and effective development. Competency development as indicated here is done systematically, at each working unit of the organization (division, department, etc.), aiming at process and outcomes improvements in each unit (Kesti and Syväjärvi, 2010). Empirically-grounded studies at several private and municipal organizations indicate that these improvements may be accomplished through a process of unit-level communications, whereby each work group comes to both explicit agreement and tacit consensus on a new results- based orientation. When bundle of four optimal workplace innovations are implemented using systematic Tacit Signal development process, just one fourth of one percent (0.25 percent) of each group member’s work time is required to accomplish optimal improvement action (Kesti and Syväjärvi, 2010; Kesti, Syväjärvi and Stenvall, 2009). This means, for example, that for an eight-person team just one week’s working hours - about 5 hours per person - are needed to determine, agree upon, and implement the chosen improvement initiative. In scenario analysis, effective developmental actions are projected as optima in the form of cumulative averages (Figure 2).
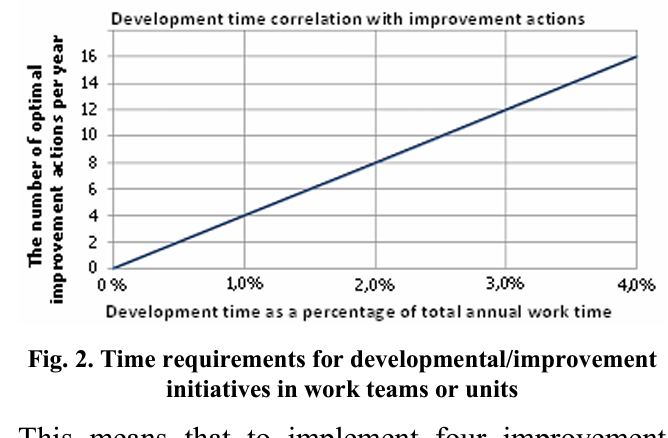
This means that to implement four improvement actions throughout the organization would require- approximately two and a half days, or eighteen to twenty hours of systematic time investment for each group or team and its members. It should be noted that reaching consensus on process and outcomes improvements appears, in and of itself, to improve group performance (Kesti and Syväjärvi, 2010), and there may in fact be other synergies attained across improvement initiatives.
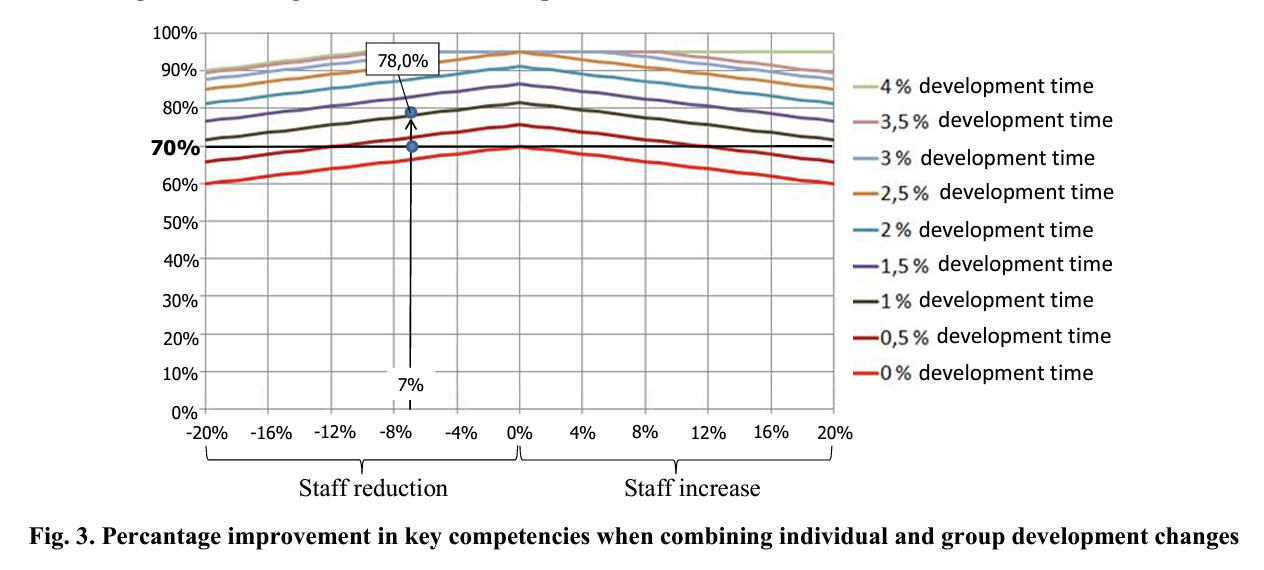
In the previously noted empirical study in Finnish private and public sector organizations, four organization-wide initiatives based on the one percent time criterion appears to approach optimality. Contingency theory would indicate that there is no absolute best (optimal or maximal) solution or design, but rather myriad possibilities from which to select one well suited to (contingent upon) the situation being analyzed (Hunt, 1992) according to the efficacy criterion being used - following the propositions just reviewed, an efficacy or effectiveness criterion of one percent annual work time investment per individual or group per improvement initiative. These initiatives may address a wide variety of work practices, skill sets, tools, and dimensions of work such as cooperation and communication. Structural changes such as increases in the size of work groups may be expected to correspondingly increase the need for the development of human resource capacity in the form of group or team competencies (Kesti and Syväjärvi, 2010). Both structural and developmental changes require a revision or rearrangement of work practices, which modifications in turn will translate into developmental needs with regard to extant group competencies.
The next figure indicates the interplay of competency development and group size. As an example, a group downsized by seven percent can still realize seventy-eight percent improvements in levels of competency attained, according to simulations and observations on which we have relied.
In HCSA, as presented here, performance increases or decreases can be analyzed proactively, so that causal connections to human capital development (defined in relation to increased competency or competencies) can be seen. Managerial competence is important for organization strategy and sustainable development. Leadership and culture competencies include attributes that are essential for group emotional intelligence, i.e., for the maturation of groups into self-directed groups (see Goleman, 2002). Process competence attributes correspond to group or collective task structures and procedures such as production or sales. Skill sets are personally-grounded and therefore related to factors such as training time and investment. In our approach to scenario analysis, each sort of competency assessment and corresponding cost measurement and investment estimation is conducted separately.
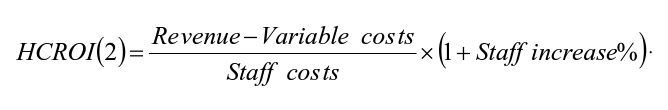
2.2. Introduction of performance indicators HCROI, HCROR(2) and OSVA. In our model, a human capital productivity ratio HCROI (human capital return on investment) indicates how human resource investment makes for increased sales and profit margins (Fitz-Enz, 2000). HCROI is calculated by dividing sales margin (€) by staff costs (pay and benefits, €).
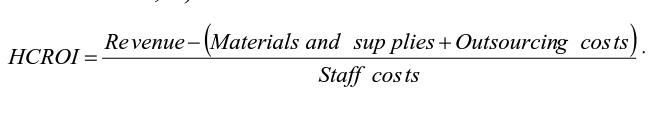
Sales margin is revenue minus by variable costs (materials, supplies, outsourcing costs, and the like). Therefore sales margins necessarily incorporate a part of the totality of quality costs (such as material waste and organizational slack). The HCROI ratio is good employee profitability index. The sales margin level is determined at the outset of data analysis, which analysis is then used as the baseline for calculating performance projections and for performance assessment upon rollout.
In the HCROI equation, staff costs are the denominator, so that staff increases will drop the ratio until the very investment in new staff begins to bring dividends to the organization, which should occur soon after new staff is fully trained and oriented. We have created an additional HCROI algorithm which incorporates the impact of investment in new staff, as follows:
We have also created an algorithm to determine the value of outsourcing, for evaluating outsourcing return on investment. This particular ratio is called OSVA (outsourcing value added), and it is calculated with the following equation:
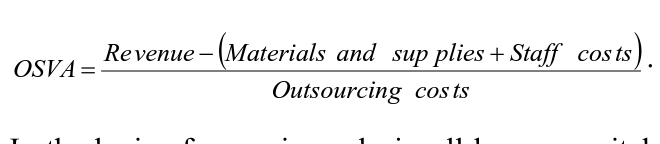
In the logic of scenario analysis, all human capital, outsourcing return on investment, and other HCROI ratios should be considered together, in summative projections of benefits and costs.
2.3. Initial data for our human capital scenario analysis. Initial data for the scenario came from the most recently available annual fiscal accounting data, together with business prospect projections and certain human-resource-related estimations previously noted, such as training and orientation time for new staff. For example, if orientation time had been decreased from 12 months to 10 months that change should be justified on organizational performance grounds. Initial data specify the baseline for any prospects for improved performance and correlative cost reductions. For example, if baseline managerial competencies are low, it is obvious the possibilities for performance improvement are proportionately higher, as competencies are developed and organizational learning and productive capacity are thereby improved.
In populating the data sets required by the scenario analysis tool, both reported data and projected scenario values are input manually and then calculated automatically. Scenario values include the following data sets:
- Organization size is gauged by the proxy value of average full-time equivalent (FTE) personnel per year. That includes all full-time wage personnel, while part-time staff is calculated by the individual’s working time divided by a full-time employee’s total yearly working hours (i.e., 1850 hours). For example if a part-time employee has contributed 140 hours of work time, her full-time equivalent or FTE is 140/1850 or .076 FTE.
- Revenue is total revenue per reported fiscal year.
- Sales margin is total annual earnings minus fixed and variable costs. As previously indicated, the latter include quality costs, encompassing material waste, slack time, and the like.
- Employee costs include pay and benefits together with measures for additional labor costs relating to absenteeism, turnover, and the like, as previously indicated.
- Quality costs are a means of showing the return on investments from quality improvement. Tracking and properly categorizing quality costs helps determine whether cost allocations are consistent with quality objectives as these relate to productivity and profitability. As suggested previously research sponsored by the Finnish Ministry of Trade and Industry has indicated that demonstrable quality costs reduce revenues by an average of six percent on an annualized basis (Andersson et al., 2004). However, there are major differences and large variances in quality costs among business areas and companies studied, so that we use the six percent mean loss value as a default value in our model. Scenarios are precisely about choosing value projections for an organization, and thereby the organization’s cost savings potential; consequently baseline and projected values for quality cost savings will vary widely across organizations.
In quality management, quality costs are typically divided into the following operational areas (BS 6143-2):
- prevention costs (the cost of preventive actions): training, orientation, guidance, instruction, quality controls, auditing, maintaining equipment in working order, cleaning and preventive maintenance protocols, alarm and security systems, and the like;
- appraisal costs: quality checks, testing, measuring, piloting, sample-taking, analysis, evaluation, and the like;
- internal failure costs: waste, scrap, redoing, fixing, rechecking, defect detection, correction, repairing, and the like;
- external failure costs: cost of responding to customer claims and complaints, cost of honoring warranties and guarantees, returned products, and the like.
- Orientation time means the average time required for new employee orientation, in essence the time required for a new employee to become sufficiently knowledgeable and experienced to be effective in her job. This means that after orientation, the new employee should achieve the same workplace effectiveness as experienced staff. Orientation time requirements depend entirely on business area and corresponding competency requirements. In our scenario analysis, maximum orientation time is two years (twenty-four months).
- Marginal labor costs normally vary in accordance with consumer price changes and with costs associated with customer relations (such as the external failure ones just noted). Either implicitly or explicitly, firms will generally set the marginal product of labor equal to the marginal cost(s) associated with labor. Marginal labor costs are a major type of variable cost across business firms and labor markets.
- A business area market change - for instance, in a product or service mix or in the scaling of products and services - can be estimated with the use of industry statistics. When a business area market change is positive, the organization can fully benefit from effective working time and/or capacity enhancements. Conversely, when a business market is depressed, the organization’s effective capacity to convert products or services to revenue is correspondingly reduced.
- Additional labor costs are distinct from marginal labor costs, referring specifically to increased costs associated with new products or services, or changes in production. These costs are taken from human resource accounts. Additional labor cost values are needed for employee wage determinations. We take a default value 21.5 % from general industry statistics (StatFin, 2007). In planning, the benefits of a change in production process or service mix - or of a new public sector program initiative - must more than offset additional labor costs. This is another way in which detailed, quantified scenario projections are useful.
- Increased personnel size has a great affect on business scorecards, since it obviously increases training requirements and orientation time, while decreasing the level of extant competencies in the organization. Increasing personnel size - equivalent to increasing the size of the organization, as already indicated, is a strategic value, and one which should be set in multi-year strategic planning. Increasing personnel is an investment for which payback time is usually several years away, and therefore one which needs to be carefully thought out.
- Average employee absenteeism is calculated as a percentage of total annual staff work time. Both short and long absences are included in the calculation.
- Employee turnover means that for every person leaving or transferring elsewhere, there a one new employee is brought in to replace her when circumstances warrant no change in FTE staffing.
- Continuous improvement and training means that the organization has the capacity for human resource development in the areas of quality management and training. In scenario planning, this sort of human resource development must be done effectively, so that, for instance, a one percentage of work time devoted to development yields a four optimal improvements in quality and productivity at the level of the work unit or team.
- The development of competencies (management, leadership, culture, skills and process) is a major, if relatively intangible, performance driver. For the purposes of accurate scenario-buildings, these skill and capacity competencies should be assessed once a year, which presupposes the establishment of competency definitions and measures.
- Outsourcing costs need to be weighed against in-house production costs, internal capacities and resources, and the relative economies of contracted work. In other words, there needs to be a business case for outsourcing or (in the case of public-sector organizations) privatization or contracting out. Outsourcing costs are part of variable costs.
- Revenue change per year is essential feedback data, calculated in our scenario tool as a correlative relationship between effective worktime capacity and revenue.
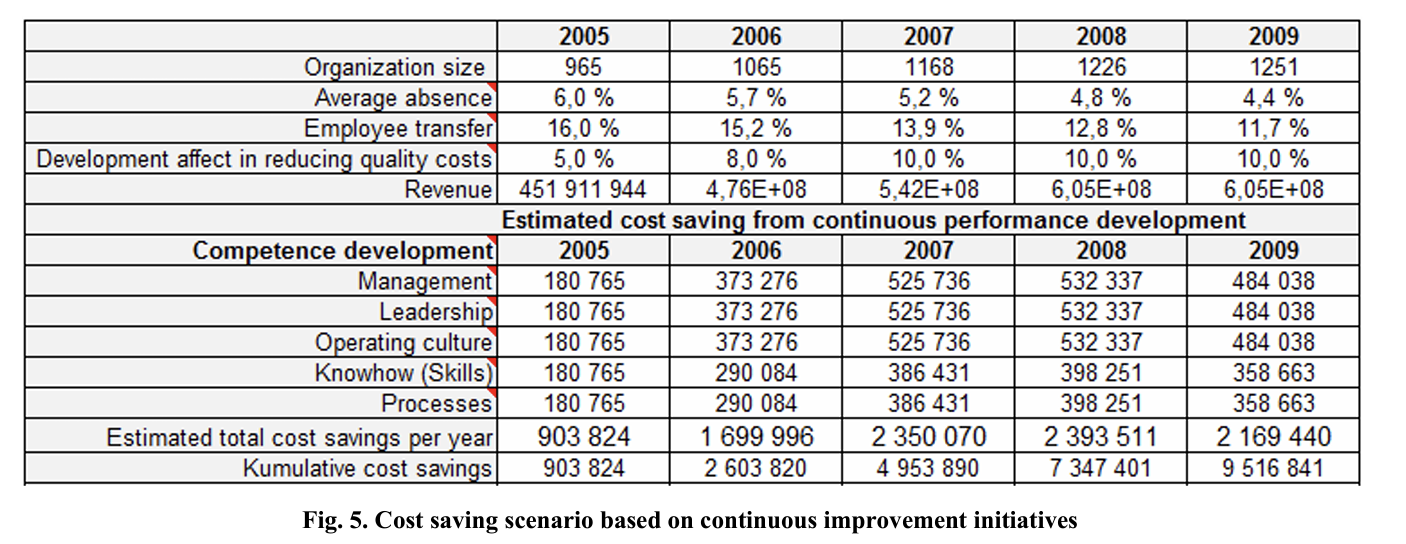
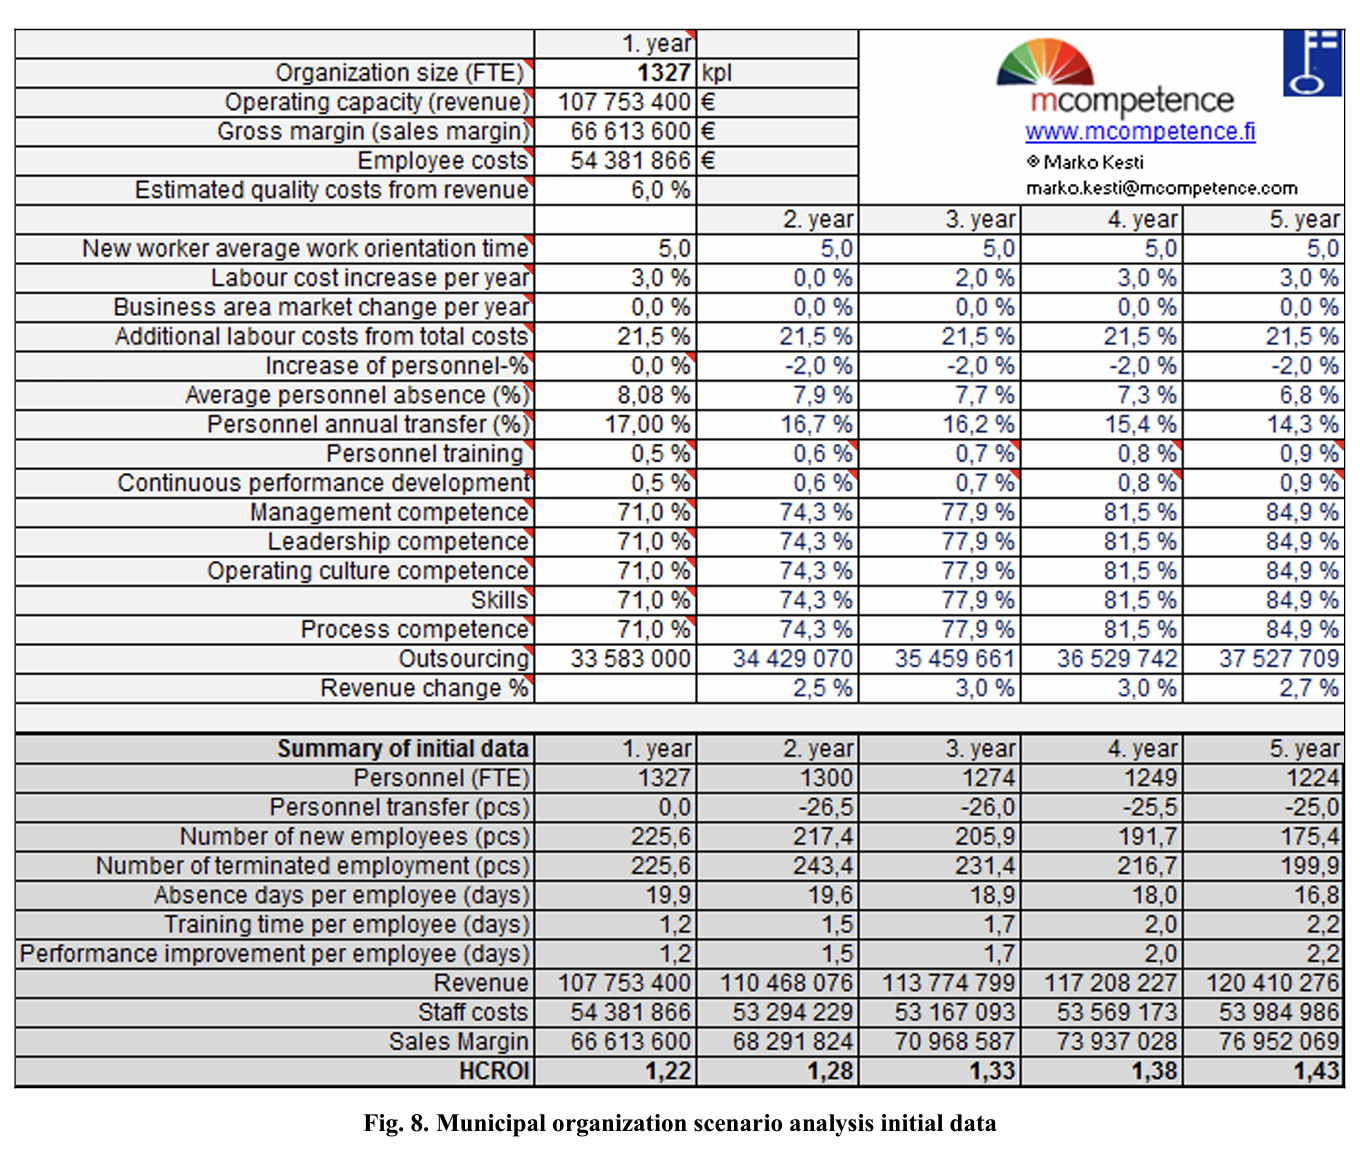
The following figures are, respectively, screen shots of our SA tool baseline data and of a matrix of cost savings achieved by the kind of continuous improvement initiatives just described.
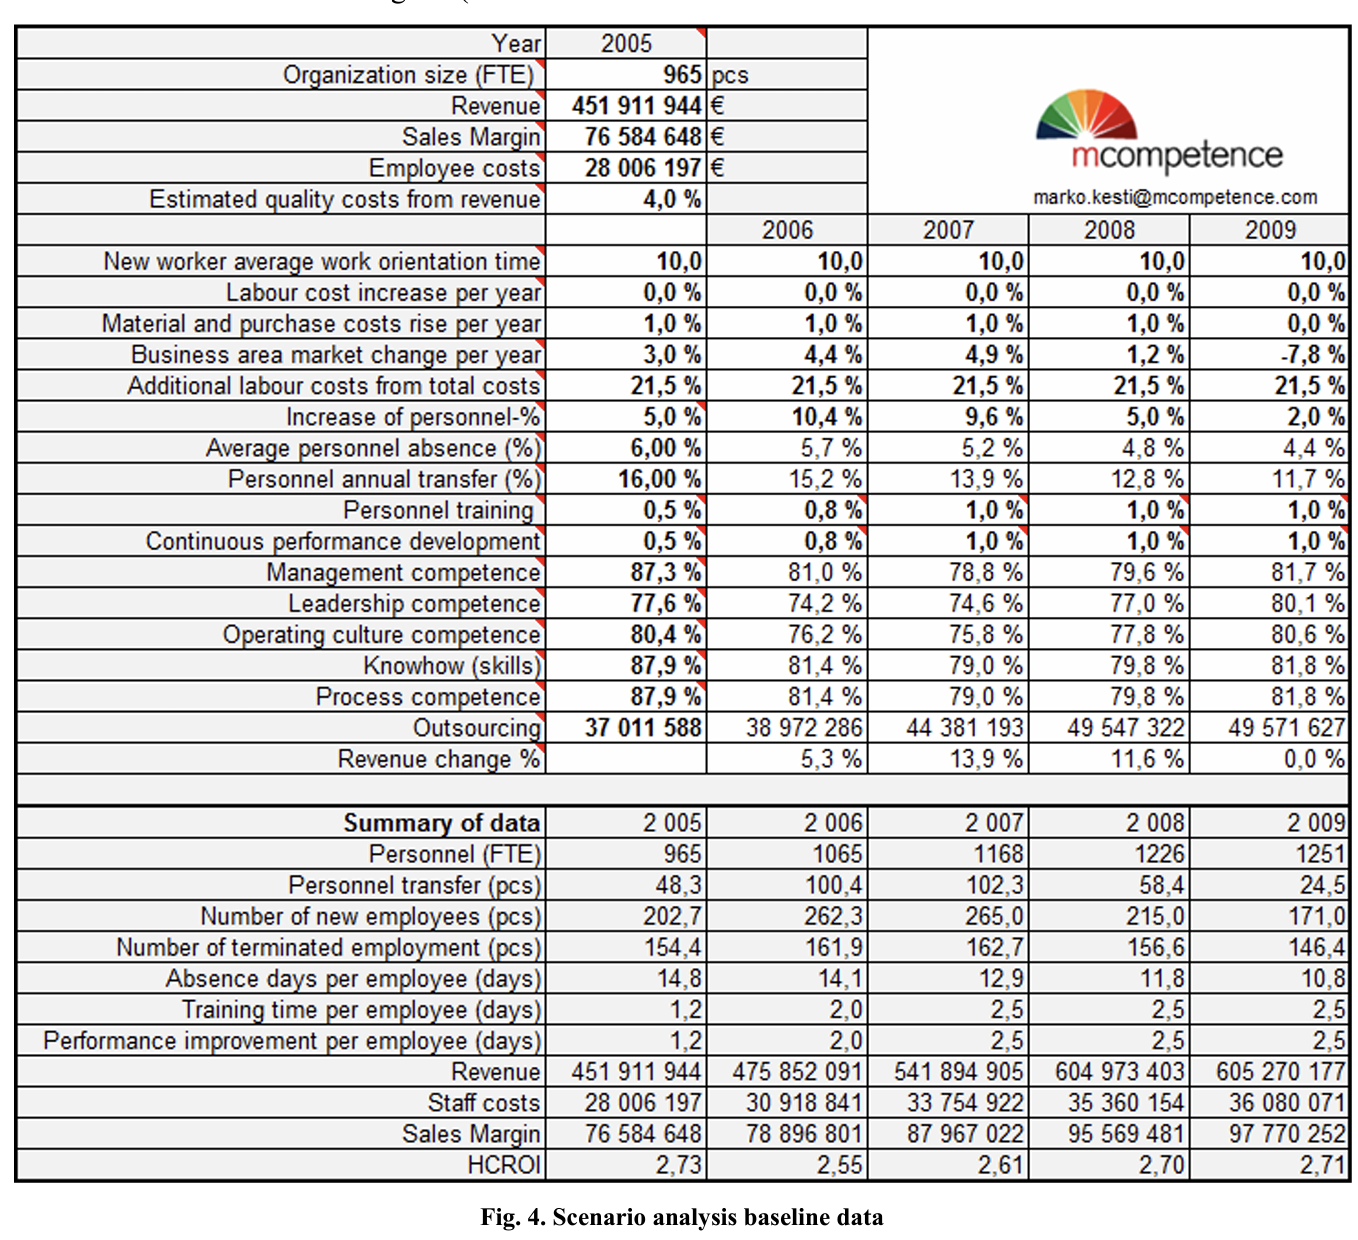
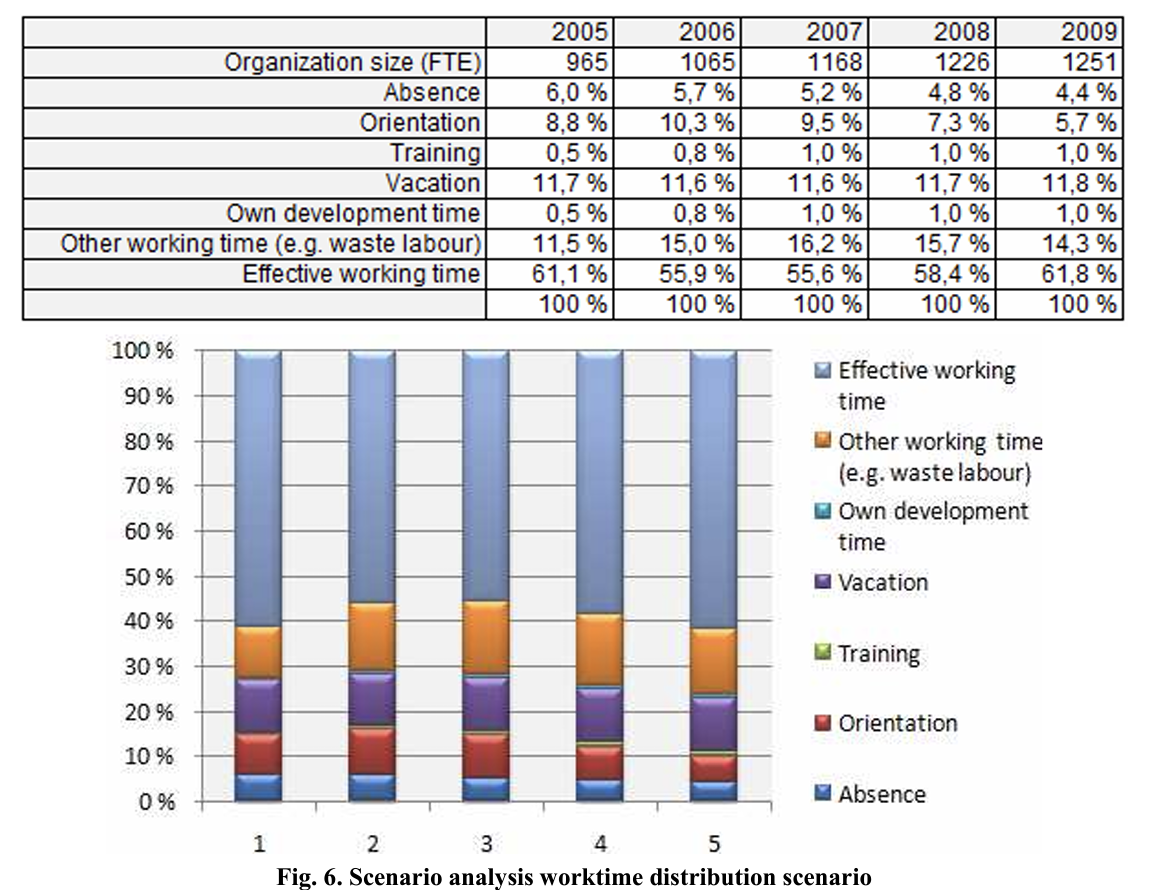
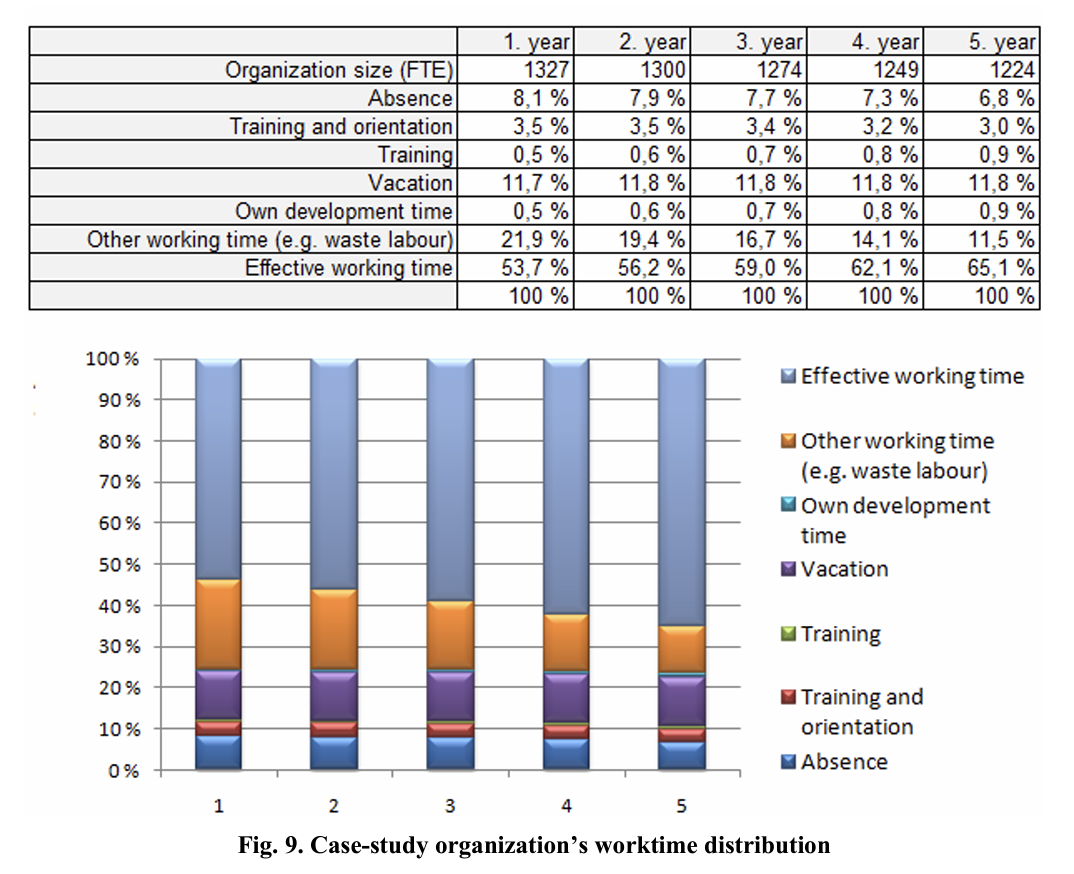
2.4. Working time distribution. Our scenarioanalysis approach lays stress on effective worktime distribution, defined as time efficaciously devoted to organizational goals, objectives, and projects that accord with organizational mission - the classic goal-alignment criterion for human resource effectiveness. The following screenshots display calculations of related values (BS 6143-2). Revenuegeneration is a crucial determinant of worktime effectiveness. Revenue generation is influenced by all of the aforementioned human resource factors that impact efficacy (such as FTE, turnover, absenteeism, and individual and unit/organizational competencies).
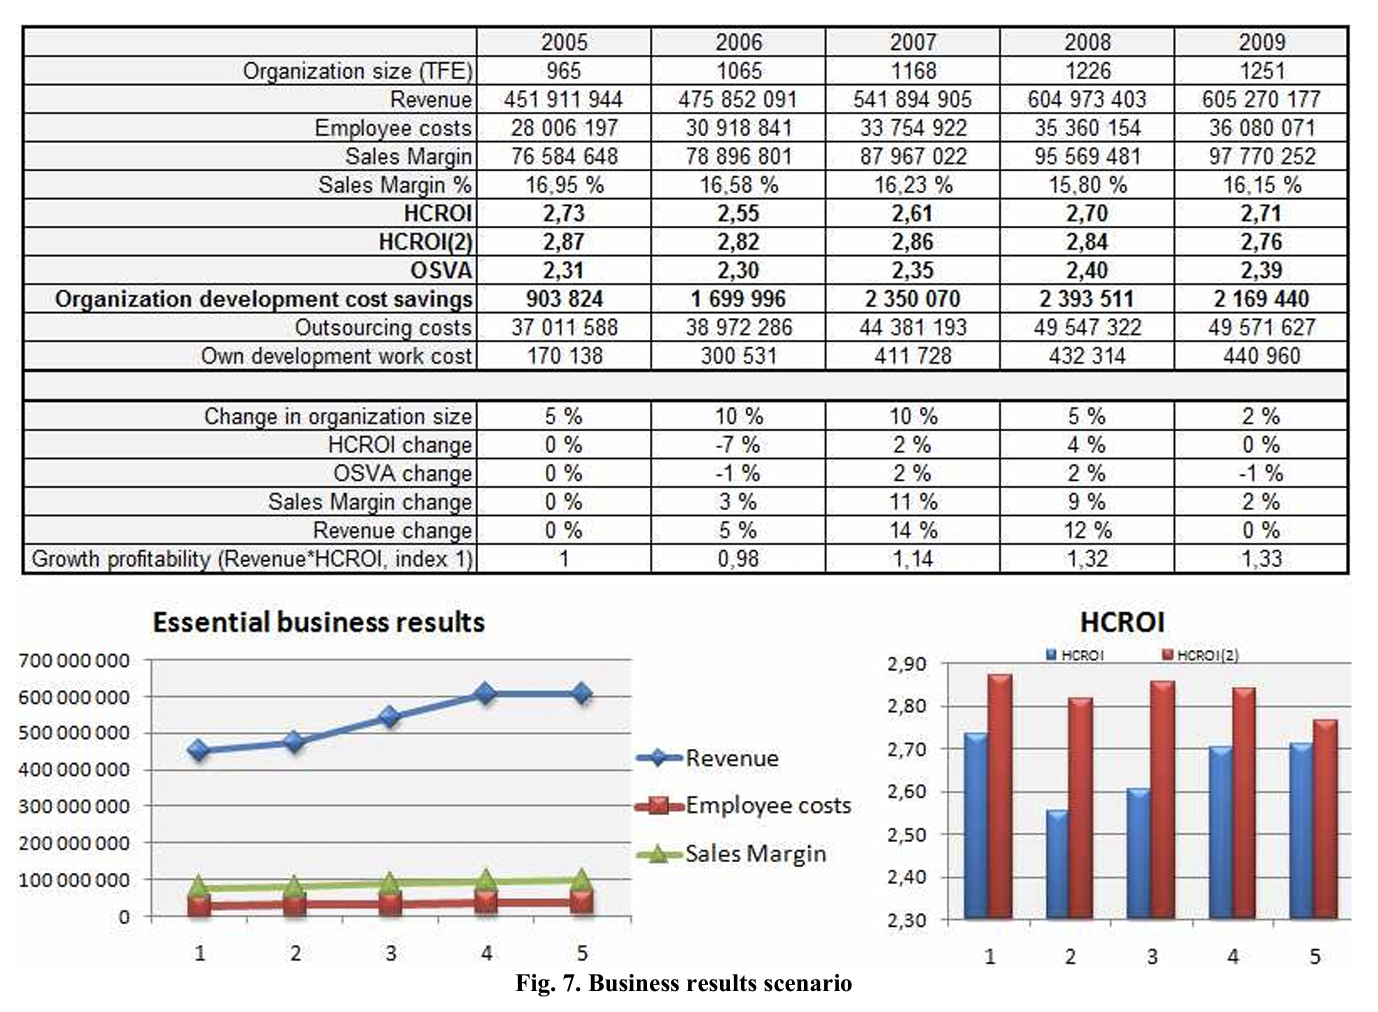
2.5. Business results. For business results, the necessary scorecards are collected for five year scenarios. The baseline data is for an organization that is in a steadily growing market and is improving performance through continuous development and training. This case organization is also investing in hiring, which is indicated in the HCROI(2) index.
2.6. Case study: municipal organization scenario analysis. The public sector case analysis here considered concerns a Finnish municipal organization of around 1300 employees. The organization faced the challenges of improving productivity, while state funding was decreasing and the community’s need for services increasing (a not unusual combination of demands on public agencies globally today). The local workforce is getting older, correlative with annual staff retirement rates of two percent. At the same time, staff costs including compensation were getting higher due to a rising consumer price index and other factors. Employee absenteeism was high, averaging eight percent, making for costly overtime work and staff replacement arrangements. In this instance, our scenario analysis indicated that productivity could be improved with the right investments in human capital.
Analysis indicates that three factor sets are simultaneously impacting productivity:
- rising absenteeism increase staff costs and quality costs;
- too high staff turnover rate is hindering the organization’s human resource capacity;
- high retirement levels are diminishing organizational capacity and competencies.
Because these factors are related to each other, they should be analyzed together. The organization needs systematic organizational development with a strategic focus on these critical factor sets. The ensuing positive scenario is based on the assumption that each working unit succeeds in the competence-development and capacity-building process. This means that each working unit implements 3 to 4 optimizing improvement actions yearly, with the support of strategic corollary actions. One recommended strategic action is a bonus system aimed at workgroup productivity improvement. The bonus can be, for example, a 0.7 percent salary tied to corresponding successful implementation of at least three complementary productivity initiatives at the level of work unit or team. This bonus system has in fact been tested at this organization with promising results. Increased competency and capacity levels have offset the previously mentioned two percent per year attrition in staff.
Our scenario analysis projections indicate that the cost savings per year average 800 000€ per year, or about 640€ savings per employee annually. These savings come from reduced quality, absenteeism, and staff turnover costs. For example, in one organizational unit overtime and staff replacement were almost half of total regular staff costs. The absenteeism cost calculation was that one day’s absence cost 278€, so that if each employee has one day less absence the organization will save 344 000€. However, various forms of slippage will inevitably undercut these gains, cumulatively by years four and five, so that at year five the organization has ten percent lower operational capacity compared to the projections of the positive scenario.
Nonetheless, scenario analysis encourages the organization to invest in human capital. When this investment is done effectively, it is possible to achieve these returns on investment of around 100€ per employee per year.
2.7. Case study 2: an industrial company with a staff ageing challenge. The industrial company in question has approximately 500 employees whose average age is 43. According to its age distribution, it is probable that almost 100 of the firm’s employees will retire during the following decade. Therefore, the company is facing a margin of two percent additional staff reduction per year due to ageing. This means that more new workers than otherwise would be needed to compensate the retirement-related loss in human resource capacity. Other productivity factors include marginal individual productivity losses with ageing and approaching retirement; these may translate into workload reductions for those workers as they near retirement, so as to maintain productivity/worktime levels. The alternative is likely to be rising absenteeism rates among these employees.
HCROI scenario - analysis was conducted for two contingencies - a negative scenario and a positive scenario. The negative scenario is premised on the company taking no action to specifically address the looming ageing problem. In the positive scenario, strategic and operational interventions consistent with the recommendations made throughout this paper are planned and implemented, including improvements in staff training.
The positive scenario indicates that after five years the revenue is 22.7 percent better and sales margin 28.0 percent better than in the negative scenario. In both scenarios the average salary costs are the same, but in the positive scenario the staff costs are 7.7 percent lower. This is due to the sustainable growth of revenue per employee, so that these gains are made possible with reduced staff levels (due to ageing). By five year, staff costs per employee are five percent lower in the positive scenario.
Conclusion
The successful use of scenario analysis just described for an industrial organization and a municipal organization - spanning, therefore, the private and public sectors - may be replicated in virtually any organization irrespective of business focus or sector. Much the same results, for instance, have been attained in a design company business unit, and in other settings.
These case studies confirm anticipated gains from scenario analysis, as postulated at the outset in this paper. In a wide variety of organizational contexts, employees have been found to identify much the same essential factors as entailed in the best interventions: (1) facing problems squarely, and correcting them; (2) learning and training at work; and (3) improved cooperation among units and departments.
Our findings suggest that for improved organizational performance management needs scenariobased OI, with applied analytics aimed at really see the firm or agency’s overall profitability and/or productivity situation from a strategic point of view. Then there has to be action that is in line with this strategic visioning. Syväjärvi and Stenvall (2010) have showed that both private and public sector organizations may build functional scenarios for productivity improvement. Our paper has focused specifically on human capital scenario analysis as an OI tool. Well-executed applications in the field of organizational intelligence may help establish a new organizational philosophy, set new objectives, provide better personnel policy, and establish outstanding management procedures (Hamlin, 2007).
If well implemented, scenario analysis is also a superior method for the evaluation of stand-alone risk. Our research suggests that it is in many ways more practical and serviceable than sensitivity analysis, break-even analysis, Monte Carlo simulations, and other projective methods. In contrast to these variab- le-by-variable approaches to strategic management, scenario analysis assumes that uncertain factors do not operate independently from one another. As such, scenario analysis allows analysts to cluster various factors in commonsense, realistic, and consistent combinations. The analyst may reduce contingent organizational paths to the most likely positive and negative scenarios, without loss of realism or projective power.
References
- Alasoini T., Kasvio A. and Kyllönen M. (1997). Workplace innovations, Ministry of Labour, National Workplace Development program, Reports 3, Helsinki.
- Andersson P.H., Hiltunen K. and Villannen H. (2004). Promoting quality in Finnish companies, Ministry of Trade and Industry, Edita Publishing.
- Bakker A. and Demerouti E. (2007). The job demands-resources model: state of the art, Journal of Managerial Psychology, 22 (3), pp. 309-328.
- Barias Y., Cirak K. and Duman E. (2000). “Dynamic simulation for strategic insurance management”, System dynamics Review, 16, No. 1, p. 43.
- BS 6143-2 (1990). Guide to the Economics of Quality Part 2: Prevention, Appraisal and Failure Model, London: British Standards Institution.
- Cascio W. and Boudreau J. (2008). Investing in people, Pearson Education, Inc. New Jersey.
- Collins J. and Porras J.I. (1994). Built to Last, Harper-Collins, New York.
- Fiz-Enz J. (2000). The ROI of human capital: measuring the economic value of employee performance, Amacom, New York.
- Forrester, J.W. (1961). Industrial Dynamics, Pegasus Communications.
- Goleman D., Boyatziz R. and McKee A. (2002). The New Leaders, Little, Brown Book Group.
- Hackman J.R. and Oldham G.R. (1980). Work redesign, Reading, MA: Addison-Wesley.
- Hameed I. (2004). “Knowledge management and business intelligence: what is the difference?”, available at: http:/onlinebusiness.about.com/
- Hamlin R.G. (2007). An evidence based perspective on HRD, Advances in Developing Human Resources, 9 (1), pp. 42-57.
- Huovila L. (2003). Terveystili - laaja-alainen toiminnan seuranta, Työsuojelurahaston tutkimus No. 102041.
- Kaplan R.S. and Norton D P. (1996). The Balanced Scorecard, Harvard Business School Press, Boston, United States of America.
- Kess P. and Oiva-Kess A. (2010). Management system development for public sector organizations, TIIM 2010 conference proceedings, Pattaya.
- Kesti M. (2005). Tacit signals - key to organization development, Edita publishing, Tallinna (in Finnish).
- Kesti M. (2007). High performance organization, Edita publishing, Helsinki (in Finnish).
- Kesti M. and Syväjärvi A. (2010). Human tacit signals at organization performance development, Industrial Management and Data Systems, 110, No. 2, pp. 211-229, Emerald Group Publishing Limited.
- Kesti M., Syväjärvi A. and Stenvall J. (2008). E-HRM in Competence Recognition and Management - the Tacit Signal HRIS, In Torres-Coronas, T. and Arias-Oliva, M. (eds.) Encyclopedia of Human Resource Information Systems: Challenges in E-HRM, Idea Group Publishing Inc, USA.
- Kesti M., Syväjärvi A. and Stenvall J. (2009). Hiljaiset signaalit HRIS: yksi ratkaisu organisation inhimillisen pääoman ja henkilöstötuottavuuden kehittämisessä, Hallinnon tutkimus, 1,2009.
- Kleiner B.M. (2006). “Macroergonomics: analysis and design of work systems”, Applied Ergonomics, 37, No. l,pp. 81-89.
- Longman (1987). Dictionary of Contemporary English. Longman House.
- Lyneis J.M., Cooper K.G. and Els S.A. (2001). “Strategic management of complex projects: a case study using system dynamics”, System Dynamics Review, 17, No. 3, pp. 237-260.
- Naylor J. (2004). Management, Second edition, Financial times Pitman Publishing.
- New Forms of Work organization: the Obstacles to Wider Diffusion, Final Report (2002). European Commission, DO Employment and Social Affairs, Business Decision Limited.
- Nonaka I. and Noboru K. (1998). ‘The consept of “Ba”: Building a Foundation for Knowledge Creation”, California Management Review, 40/3,1998, pp. 40-54.
- Ramstad E. (2009). “Promoting performance and quality of working life simultaneously”, International Journal of Productivity and Performance Management, 58, No. 5, Emerald Group Publishing Limited.
- Rodrigues L.L.R., Dharmaraj N. and Rao В R S. (2006). “System dynamics approach for change management in new product development”, Management Research News, Vol. 29, No. 8, pp. 512-523.
- Senge P.M. (2006). The Fifth Discipline, Doubleday.
- StatFin (2007). Statistics service at: http://statfin.stat.fi/.
- Sterman, J.D. (2000). Business dynamics: systems thinking and modeling for a complex world, McGraw Hill.
- Sveiby K.E. (1997). The New Organizational Wealth, Berrett-Koehler, Williston, VT.
- Syväjärvi A. and Stenvall J. eds. (2010). Data Mining in Public and Private Sectors: Organizational and Governmental Applications, Information Science Publishing, USA.
- TYKES (2009). Työhyvinvoinnilla lisäpotkua tuottavuuteen, esimerkki palvelualalta, Kuukauden TYKES hanke 02/2009, TEKES, Helsinki
- Ulrich D. and Brockbank W. (2005). The HR Value Proposition, Boston, MA: Harvard Business School Press.
- Welch J. and Welch S. (2005). Winning, Harper Collins Publishers, New York.
- Wilenius M. (2008). Taming the dragon: how to tackle the challenge of future foresight, Business Strategy Series, Vol. 9, No 2, Emerald Group Publishing Limited.
- Ylöstalo P. (2005). Työn uudet organisointitavat, Käyttö ja esteet yksityisellä ja julkisella sektorilla, TYKES Raportteja 39. Työministeriö, Helsinki.