Эта статья опубликована под лицензией Creative Commons и не автором статьи. Поэтому если вы найдете какие-либо неточности, вы можете исправить их, обновив статью.

Material ratio curve of 3D surface topography of additively manufactured parts: an attempt to characterise open surface pores


S Lou
Z Zhu
W Zeng
C Majewski
P J Scott
X Jiang
Опубликована Сен. 1, 2021
Последнее обновление статьи Ноя. 17, 2022
Эта статья опубликована под лицензией
")


Abstract
Surface topography of additively manufactured components often contains 3D features, e.g. particles, open surface pores. X-ray computed topography can capture these features, allowing measurement data to be used for 3D surface texture characterisation. On the basis of the newly developed 3D surface texture parameters, this paper investigates material ratio curves of the surfaces produced by additive manufacturing processes, i.e. selective laser melting and high speed sintering. The material ratio curves of these surfaces vary in their shapes, depending on the specific process and associated process parameters, as well as surface orientations. Re-entrant topography features can result in recess shapes on the material ratio curve at the surface heights where these features locate. This unique characteristic makes the material ratio curve an effective analysis tool to differentiate various AM surface topographies, allowing surface texture to be linked with process control and functional assessment. Furthermore, Vw (valley void volume) is identified as a useful volume parameter to characterise the open surface pores of AM surfaces. The material ratio Mr 2 for the determination of Vw is discussed with the consideration of three options to address the open surface pores. The secant scanning approach proposed by ISO 13565-2 and the manual set ratio at the first sharp drop of the material ratio curve were found to be able to achieve reasonable results for the AM open surface pore characterisation.
Ключевые слова
Topography, 3D surface, open surface pores
1. Introduction
Additive manufacturing (AM) is paving its way of shaping the paradigm of manufacturing technology. By selectively adding materials layer by layer, AM brings a variety of benefits against conventional manufacturing, such as easy construction of complex geometries, design freedom, reduced manufacturing leading time, and saving of raw materials (Attaran 2017). However, the full commercialisation of AM technology is hindered by a couple of technical barriers, one of which is AM's rough surface texture, not comparable to that of the conventional manufacturing processes, e.g. machining and injection moulding.
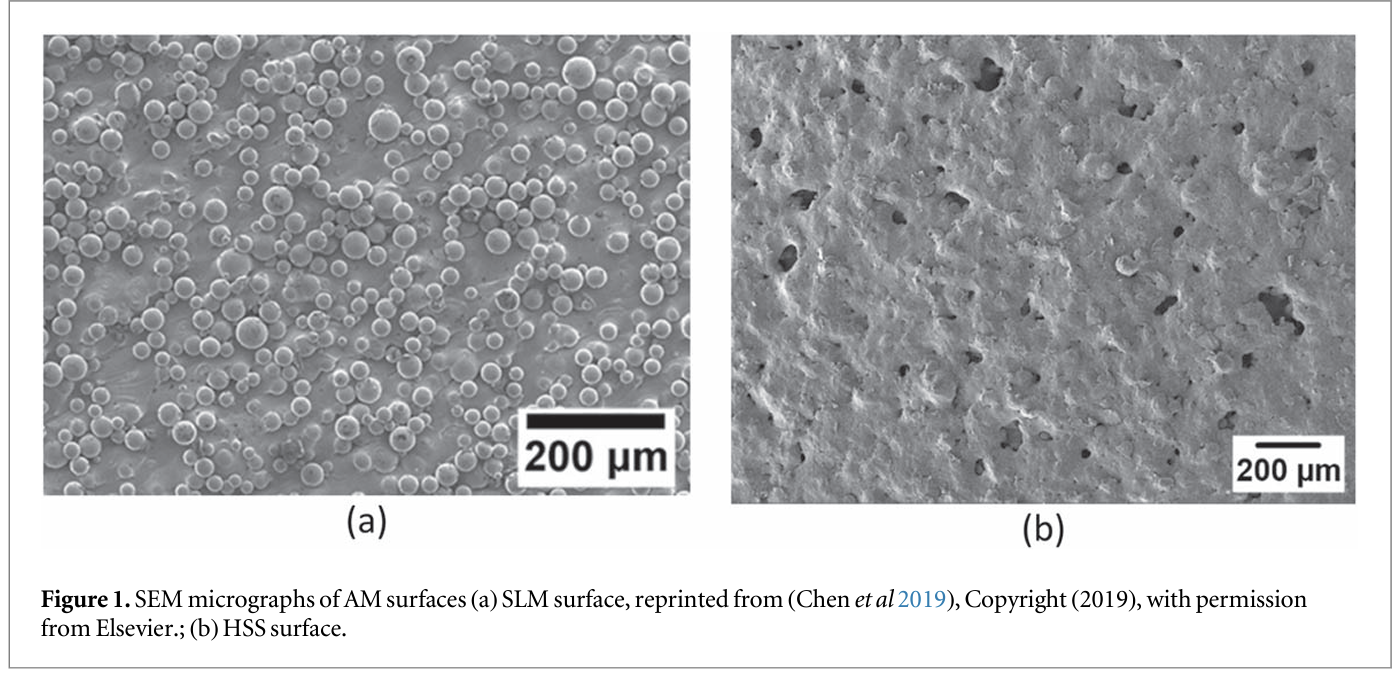
Due to the nature of AM processes, AM surface texture tends to be very rough, ranging from a few micros to hundreds of micros, depending on the AM process used. Figure 1 shows the scanning electron microscope (SEM) micrographs of two different AM surfaces. The surface topography of a Ti6Al4V component made by Selective Laser Melting (SLM) is presented in figure 1(a). Plenty of unmelt/partially melt particles with varying sizes adhere to the top of the relatively smooth underlying surface. The surface in figure 1(b) is a typical surface of a High Speed Sintered (HSS) Nylon-12 part. Partially sintered particles and voids caused by lack of fusion is plainly visible, resulting in a rough surface texture together with significant open surface pores presented. Being able to measure and characterise these topography features will not only benefit AM process optimisation, but also facilitate the assessment of product performance, e.g. mechanical strength (Strano et al 2013, Zhu et al 2020).
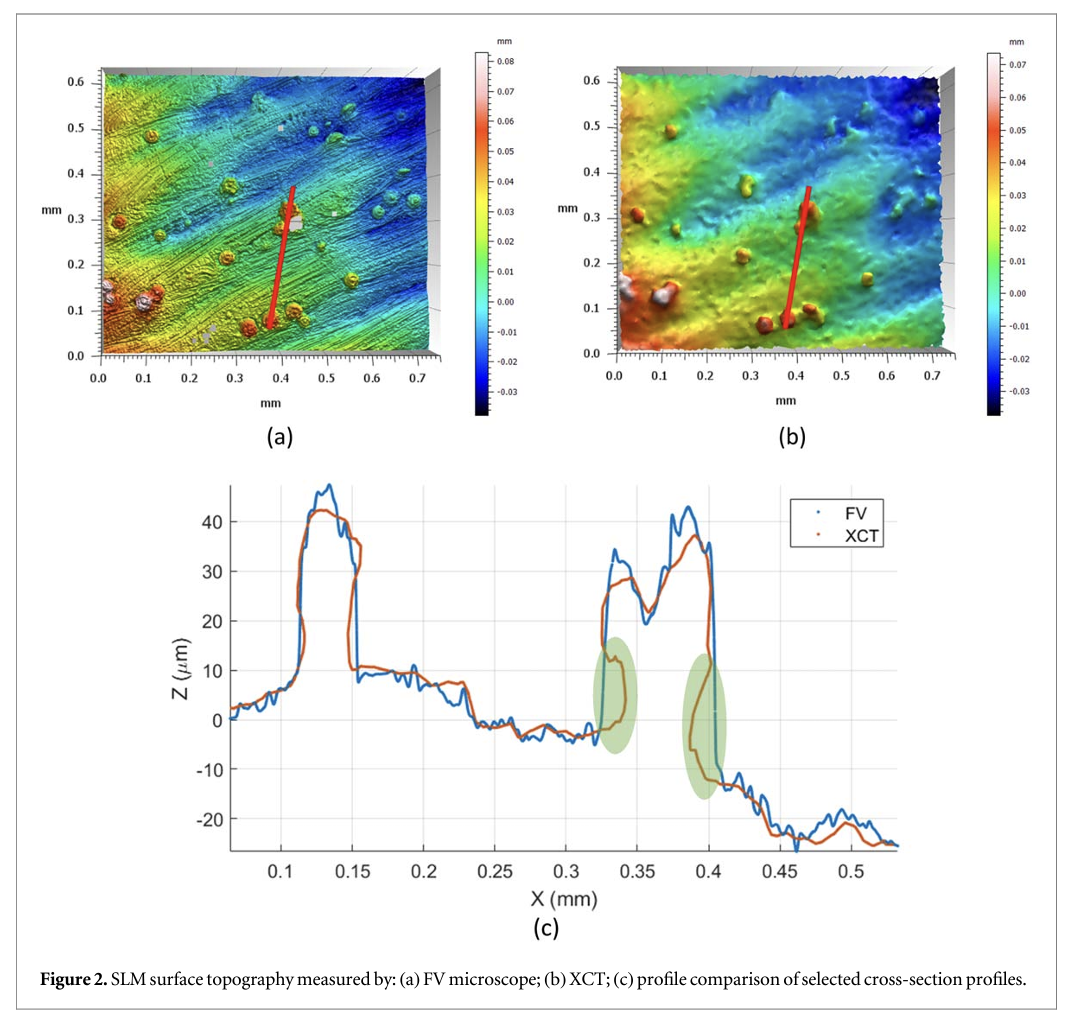
AM surface topography is in nature 3D, comprising of undercut surfaces and re-entrant features. These 3D topography feature cannot be measured using conventional tactile and optical measurement techniques due to the line-of-sight limit, but could be instead captured by x-ray computed tomography (XCT) which has no constraint on surface geometry (Townsend et al 2016). The use of XCT for AM surface texture, in recent years, has been a focus of the AM metrology community (Townsend et al 2017, Thompson et al 2017, Fox et al 2018), bringing in the advantages that enable not only the capture of 3D topography features, but also the non-destructive measurement of internal surfaces. Figure 2 illustrates the comparison of a SLM surface topography measured by a focus variation (FV) microscope and an XCT system, as well as the comparison of selected cross-section profiles aiming for a better visualisation of the differences between two measurement techniques. As shown in figure 2(c), XCT captured the undercut surfaces of particle features, while FV microscope resulted in sharp flanks instead. It, however, should be noted that although FV microscope could resolve a finer detail of surface texture, it is unable to fully measure the 3D topography features, e.g. open surface pores; in comparison, XCT is capable of capturing these features, which are the main concern of this work.
Surface characterisation is demanded to provide quantitative assessment of surface quality of AM parts such that this information can be used to link with AM process optimisation and product performance. The AM community, particularly in the AM process field, tends to use the simple profile surface texture parameters, such Ra, Rq, to to address the general surface quality, whereas areal parameters are proving more useful. Sidambe (2017) showed Sa and Sq have better correlation with the surface angle than Ra and Rq. Triantaphyllou et al (2015) found that Ssk can differentiate up-skin and down-skin of as-build SLM surfaces. While these averaged height parameters are very popular and useful, they can only reveal limited information that restricts the full benefits of surface metrology for AM process control (Fox et al 2016, Lou et al 2019a, 2019b). Grimm et al (2015) found a strong correlation between the surface orientation and the areal parameters Str and Sdq. The investigation of Lemoine et al (2016) showed that multi-scale fractal parameters correlate well with the linear energy density of SLM process. Bespoke characterisation techniques and parameters were also developed to analyse the typical AM topography features, e.g. particle density, melt track width, total surface at different scales (Rosa et al 2016, Quinsat et al 2018, Senin et al 2018, Lou et al 2019a).
Apart from areal surface texture parameters based on surface height map, 3D surface texture parameters were recently developed by the University of Huddersfield, which allow XCT measurement data to be used for the assessment of 3D surface topography. These 3D surface parameters include height parameters (Pagani et al 2017, Abdul-Rahman et al 2016), hybrid parameters (Pagani et al 2017), volume parameters (Pagani et al 2019) as well as feature parameters based on 3D watershed segmentation (Lou et al 2019b, Lou et al 2020). Different from the traditional material ratio curve calculated on the base of surface height map, the material ratio curve in this research work is resulted from the 3D surface topography (usually measured by XCT and presented by triangular mesh). The impact of re-entrant features is considered while calculating the volume above the surface height.
On the base of the newly developed 3D surface texture parameters, this paper aims to investigate the material ratio curves of 3D AM surface topographies, which enables surface topographical features to be linked with AM process optimisation. The volume parameters derived from the material ratio curve will be used to characterise open surface pores of AM surfaces, which is the open pores on the surface and the near surface pores with the channels connected to the external surface.
2. Material ratio curve and function related parameters
2.1. Material ratio curve
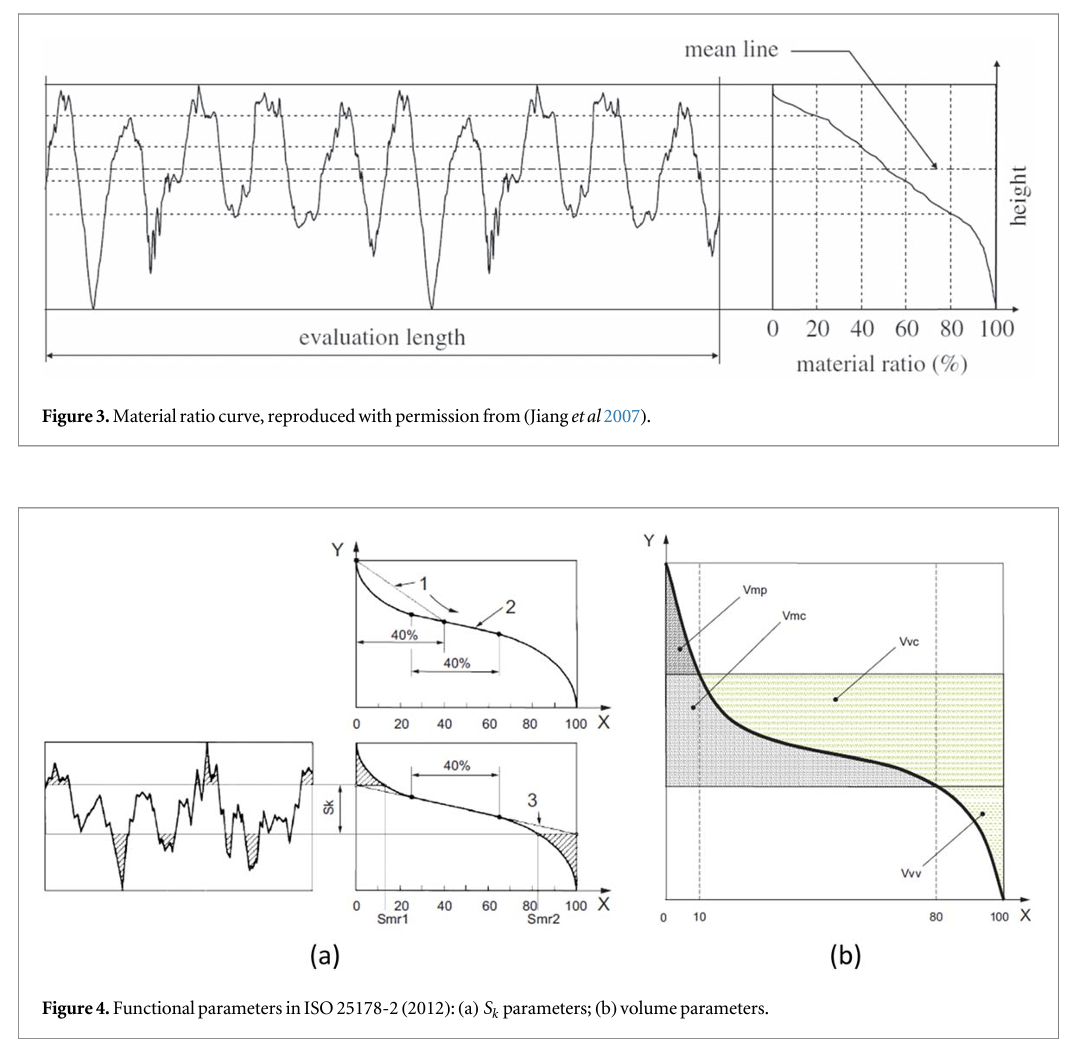
The Abbott-Firestone curve, named by Abbott & Firestone (Abbott and Firestone 1933), is a curve of the material to air ratio of the surface as a function of depth, from which realistic numbers could be determined depending upon the surface application. It is the first attempt to link function to numbers simple enough to control manufacture (Jiang et al 2007).
The Abbott-Firestone curve is also named as the material ratio curve or bearing area curve. Mathematically it is the cumulative probability density function of the surface profile's height and can be calculated by integrating the profile traces (Stachowiak and Batchelor 2013), see figure 3. The material ratio curve is often divided into three height zones that relate to bearing problems of the automotive industry: the peak zone corresponds to initial running-in wear, the core zone to wear throughout the lifetime of the component, and the valley zone to lubricant retention under heavy wear conditions (Jiang and Whitehouse 2012).
2.2. Functional parameters
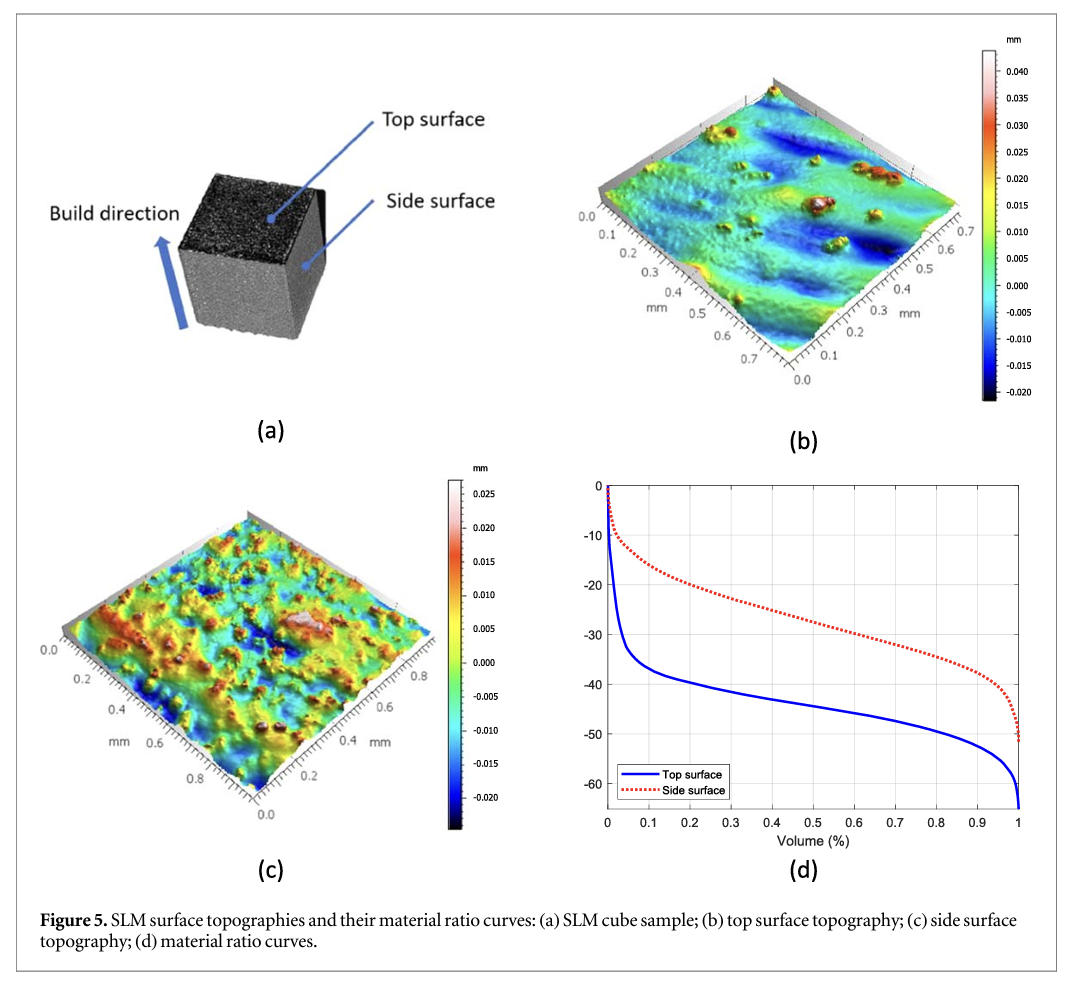
Indicative parameters relevant to the material ratio curve were developed to characterise common functional properties, such as wear and tribological related characteristics. Rk family parameters of ISO 13565-2 (1998) are based on the profile material ratio curve. They are the function related parameters designed for highly stressed surface texture, e.g. honed cylinder bores. This concept was then extended to areal surfaces as the Sk family parameters in ISO 25178-2 (2012). As shown in figure 4(a), the areal material ratio curve is split into three zones by means of drawing a secant to the region at the point of inflection corresponding to a 40% material ratio, which is then drawn to intercept the axes. The three split zones are identified by Spk (reduced peak height), Sk (core height), and Svk (reduced dale height). This method was developed for the German car industry and its variation are proving to be useful (Whitehouse 2010).
Complimentary to Sk parameters, the material/void volume parameters are derived from the volume information of areal material ratio curves of the topographic surface. Similar to the determination of Sk parameters, the volume parameters are obtained by splitting the material ratio curve into three zones by applying two material ratio thresholds Mr1 10% and Mr2 80%, see figure 4(b). $Mr1$ and $Mr2$ are two ratio thresholds to determine the peak zone and the valley zone respectively, see figure 4(a). The default assumption for these two ratios is that the peak materials embraces 0%–10% of the material ratio whilst the core material/void ranges cover 10%–80% and void valley ranges from 80% to 100% of the material ratio (Blunt and Jiang 2003). However, it should be noted that $Mr1$ and $Mr2$ can be set flexibly upon the requirement of specific application. The volume family parameters have enormous practical significance, which can be used to address the material and void volume for different scales of roughness. A comparison study of functional parameters was performed to verify their capabilities in differentiating various engineering surfaces, e.g. ground, honed, lapped and electrical discharge machined surfaces (Jiang et al 2000). ${S}_{k}$ parameters and volume parameters, although derived based on different mechanisms, were found somehow related with the link of ${S}_{pk}$ and ${V}_{mp}$ (peak material volume), $\displaystyle \frac{1}{2}{S}_{pk}{S}_{mr1}={V}_{mp}$ (Franco and Sinatora 2015).
The material ratio curve and associated function parameters are widely adopted in automotive industry for quality control and tribology analysis of engine cylinder liners (Michalski and Pawlus 1992, Ander- berg etal 2009, Lawrence etal 2014, Pawlus etal 2020). Similar to the case of cylinder liner surfaces, which are manufactured by two-stage processes (a combination of plateau and honing), the material ratio curve is also employed to analyse the wear of other multi-processed surfaces, such as the surface processed by combining laser-hardening and ultrasonically peening (Lesyk et al 2018), the surface generated from hard machining followed by robot assisted polishing (Friis et al 2011). Wider applications of material ratio curve were also found in other engineering applications, e.g. corrosion of coil steel surfaces (Zecchino 2003), friction of clutch plates (Michigan Metrology), as well as healthcare applications, e.g. femoral stem wear (Whitehead et al 1997), enamel wear (Las Casas et al 2008), tooth surface loss (Field et al 2010), and artificial femoral stem wear (Blunt and Jiang 2003)
3. Material ratio curve of AM surface topography
Surface topographies of AM components are diverse and influenced by many factors, including AM process and process parameters, powder material and particle size distribution, surface orientation. Subsequently, the characteristics of surface topographies are reflected in their material ratio curves.
3.1. Material ratio curves of metal SLM surfaces
A 3 mm3 stainless steel cube sample made by SLM, see figure 5(a), was scanned by XCT to generate the 3D surface topography (Nikon XTH 225, voxel size 3 μm, exposure time 1000 ms, voltage 120 kV, local iterative surface determination provided by VGStudio Max 3.2). Figures 5(b) and (c) illustrate the surface topographies measured from its top and side surfaces, respectively. Metal SLM processes with proper process parameters usually produce high density components (>99.5%) comparable to conventional manufacturing techniques. Although undercut surfaces can be found on particle features, no open surface pores with re-entrant features are noticed on the measured surface. Consequently, the resulted material ratio curves flow smoothly, see figure 5(d). The top surface topography features a few large particles and wide troughs (the gaps between melt tracks). In contrast, the side surface is dominated by a number of particles with no sign of melt tracks. These distinct surface topography characteristics are also recognisable from their material ratio curves. The curve of the top surface drops down rapidly in the peak zone because of the presence of a few isolated large particles; this curve goes down slower in the core and valley zones and is deeper than those of the side surface, which is due to the gradually changing topography of underlying melt tracks.
3.2. Material ratio curves of Nylon HSS surfaces
In comparison to metal SLM components, re-entrant features/open surface pores are more popular on the surfaces of Nylon HSS samples. Seven sets of samples developed in Zhu et al (2020) were measured by XCT (Nikon Custom Bay 225/320, voxel size 10 μm, exposure time 500 ms, voltage 100 kV, Otsu surface determination provided by FEI Avizo 9), from which the 3D surface topographies were extracted. Set 1 indicates the sample produced using industrial established HSS process parameters, while Set 2 and Set 3 are two sets of samples produced from inappropriate parameters i.e. reduced amount of energy input (Set 1, Set 2, and Set 3 in this work are identical to Set 2, Set 6 and Set 7 in Zhu et al 2020 respectively). All these surfaces present open surface pores, despite different levels, see figures 6–8. Table 1 lists their surface roughness $Sa$ measured by FV microscope and the overall porosity by XCT.
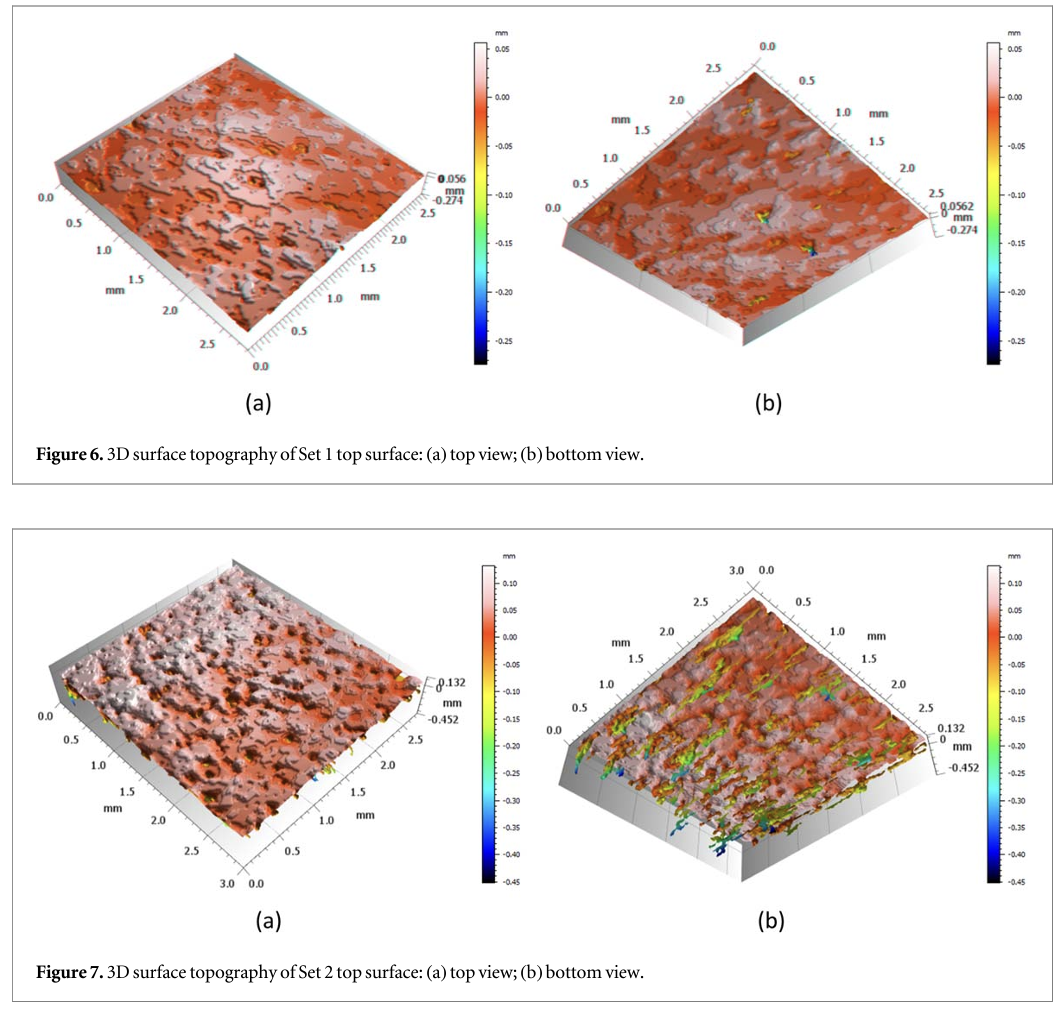
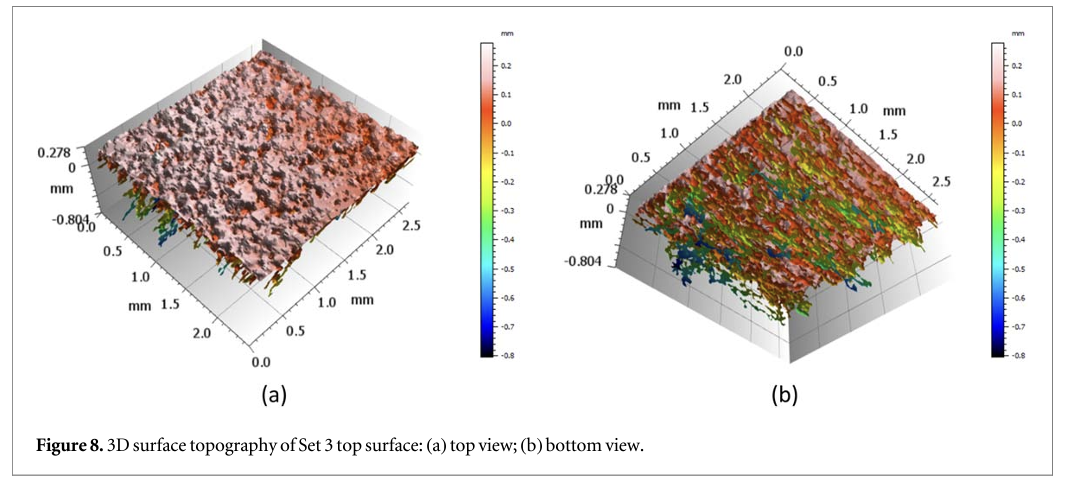
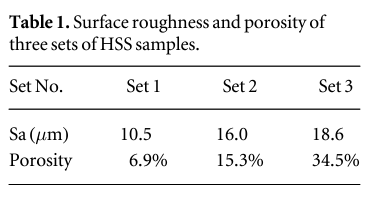
The surface topography of Set 1 is smooth with only a few visible surface pores, see figure 6(b). Surface topographies of Set 2 and Set 3 are rougher than that of Set 1. Although $Sa$ of Set 2 and Set 3 measured by FV microscope are close (difference less than 3 μm), their 3D surface topographies show that Set 3 has a much higher density of open surface pores than Set 2, see figures 7(b) and 8(b). The material ratio curves of the three surfaces are illustrated in figure 9. Recesses are found on the curves of Set 2 and 3 (more significant on Set 3). In the valley zone, the void volume shows big differences among three sets: the curve of Set 1 drops down sharply when approaching to the end, i.e. at the ratio of 98%; Set 2 starts decreasing intensively at the ratio of 90%; the dramatic drop of Set 3 starts even earlier, at around the ratio of 78%. This indicates that material ratio curve can provide rich information of the development of open surface pores, while $Sa$ is very limited in this aspect.
3.3. Comparison of material ratio curves of 3D and areal surface topography
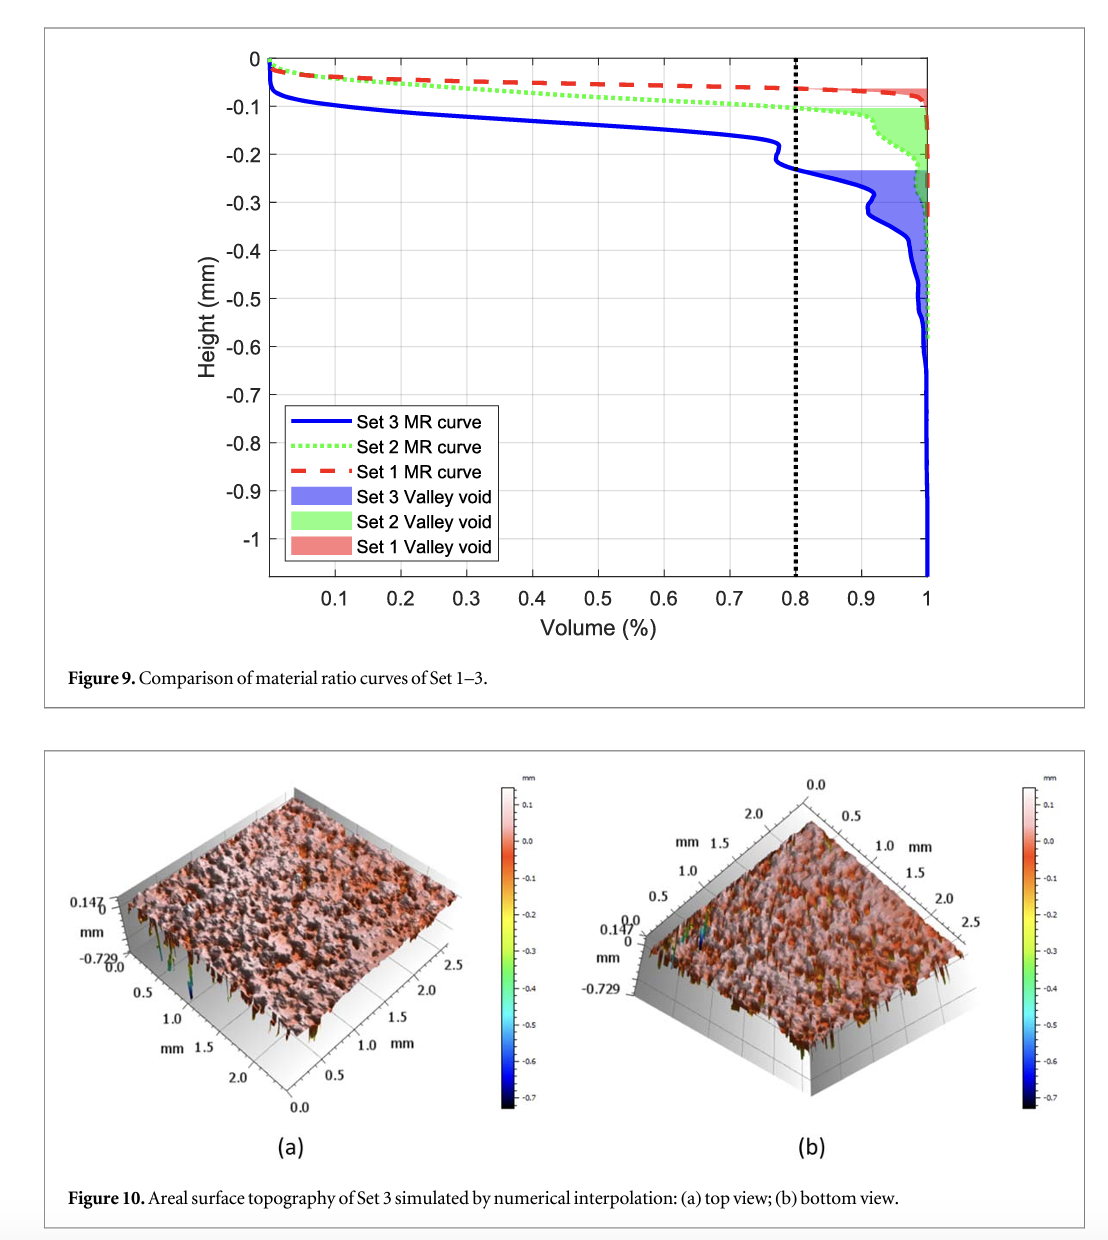
Open surface pores of HSS surfaces can be captured by XCT, whereas optical techniques are not viable in this case as they can only measure part of features which are within line-of-sight. Consequently, 3D surface topography generated by XCT scans and areal surface topography captured by optical techniques will lead to a difference in their corresponding material ratio curves. A primary example is illustrated by comparing the material ratio curves of the 3D HSS surface topography displayed in figure 8 and a simulated areal surface shown in figure 10. This simulated areal surface topography is generated by uniformly interpolating points perpendicularly on the 3D surface topography. In the case of multiple intersection points are encountered in a single interpolation position, only the highest point is recorded. By doing so, the interpolation generates a surface height map similar to optical measurement, which results a sharp flank at the edge of re-entrant features, see the highlighted areas of figure 2(c). Thus, all re-entrant features on the 3D surface topography are trimmed off in this simulated areal surface height map.
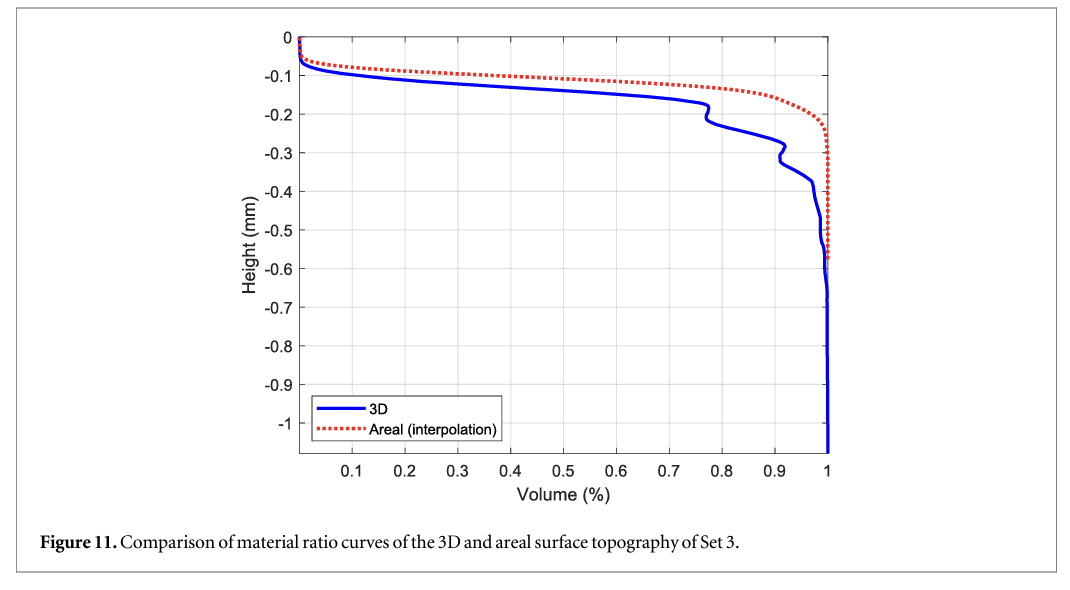
As figure 11 shows, the material ratio curve of the 3D surface topography features two significant recess portions at the heights of −0.2 mm and −0.33 mm. These are the surface heights where open surface pores go recessively. In comparison, the material curve of the areal surface topography progresses smoothly, without any recess presented, due to the loss of re-entrant features. It is also noticed that the areal material ratio curve locates above that of the simulated 3D surface topography and in general drops down much slower in the valley zone. This is attributed to the valleys on the areal surface topography is shallower than its 3D counterpart, again because of the loss of re-entrant features.
4. Link material ratio curve with AM open surface pores
4.1. Surface roughness, open surface pores relating to AM process and mechanical properties
AM process and associated process variables have direct impacts on the quality of produced parts, including surface roughness, open surface pores and internal porosity, and the resultant mechanical properties. For a SLM process, laser powder, scan speed and hatch distance are identified as the three major process variables that have significant impact on the part quality. For example, a high laser power and a low scan speed increase the melt pool size, reducing the balling effect of particles surrounding the laser scan track. As a result, surface roughness of the top surface reduces (Whip et al 2019). Hatching is another factor contributing to volume energy density. Decreasing hatch distance effectively increases volume energy density, promoting larger and deeper melt pools to form. This allows for remelting of inter-layer porosity, which is beneficial to a dense bulk density and a smooth surface roughness (Koutiri et al 2018). However, an excess laser power could cause 'keyhole' porosity, leading to a high level of sub-surface porosity and thus reduced mechanical properties such as fatigue strength (Gockel et al 2019). There is also an increased possibility that particles are ejected from the keyhole, which then fall and embed onto the surface, resulting in the increased surface roughness (Koutiri et al 2018). In the HSS process, lamp powder and speed, and the ink grey level are the dominant process variables that have a substantial influence the surface quality and porosity of printed components. In principle, a greater amount of energy that is input into and/or absorbed by the part on the powder bed leads to a more complete melting of particles and subsequently particle coalescence and solidification, resulting in reduced voids. Given that the volume of Nylon material increases as it is melted from a solid to a liquid state, the melted particles flow outwards, generating a smoother surface. As the layer-by-layer melting process continues, the excess heat dissipates downwards and penetrates through the current layer, whereby the previous layer is remelted. This further closes down the voids between particles, leading to a reduced level of open surface pores on the layer surface. The reduced porosity enhances the bonding strength between particles, as a result, reduces the tendency of crack initiation and propagation between melted particles, which consequently improves mechanical properties of the printed part. A good correlation was found between surface texture parameters (e.g. Sa,Sq,Sv) and the internal porosity as well as the tensile strength (Zhu et al 2020). AM's rough surface texture, particularly surface notches, some of which are open surface pores, could lead to a shortened fatigue life (Nasab et al 2020, McMillan and Jones 2020, Du Plessis and Beretta 2020).
4.2. Valley void volume for AM open surface pore characterisation
The material ratio curve is often divided into three zones, i.e. the peak zone, the core zone, and the valley zone, to match three tribology stage of automotive engineering surfaces, e.g. cylinder liner surfaces. To adopt this concept into the context of AM, the valley zone is where open surface pores happen. Therefore, it is natural to employ the valley void volume Vw parameter among the volume parameter family, which is used to indicate the void volume per unit area, to characterise open surface pores. As mentioned in section 2.2, ISO 25178-2 assumes that void valley ranges from 80% to 100% of the material ratio. This 80% Mr2 ratio, however, is to a large extent proposed based on the experience of automotive industry, and might not be directly applicable to AM. Figure 9 illustrates the valley void areas of three HSS samples. It is evident on the material ratio curve of Set 3 that the surface height corresponding to Mr2 80% is below the first recess position (—0.2 mm), and thus its valley void area only covers part of open surface pores, leading to an inadequate assessment of these pores.
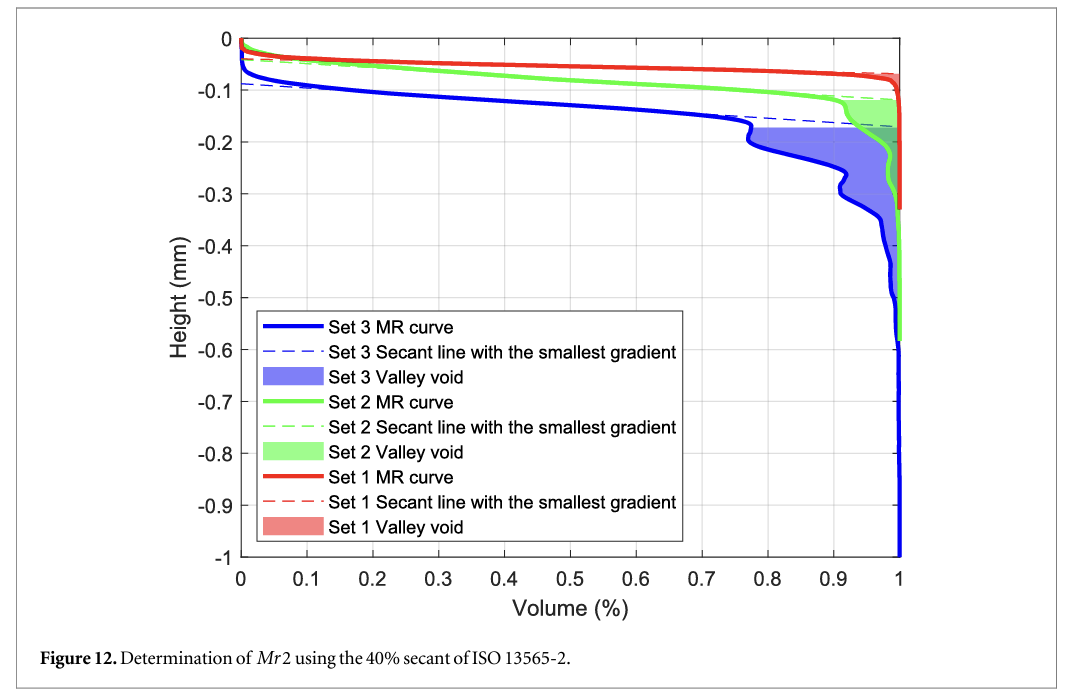
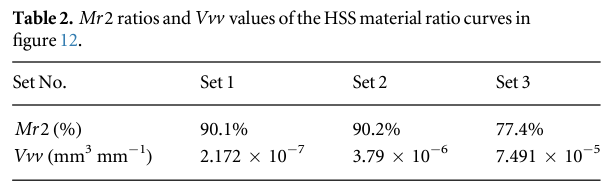
To determine a reasonable value of Mr2 for open surface pores, alternative methods must be explored instead of fixing it to 80%. This complies with the statement in section 2.2 that Mrl and Mr2 can be set flexibly upon specific application. A feasible way to target a suitable Mr 2 is to use the methodology specified in ISO 13565-2, where a secant of 40% length is iteratively scanned over the material ratio curve to find the smallest line gradient. This approach results in the valley voids as shown in figure 12. The corresponding Mr2 ratios and Vw values are listed in table 2. It is evident that the valley voids generated from this approach are more reasonable in comparison to fixing to 80%, having all recesses on the material ratio curve covered.
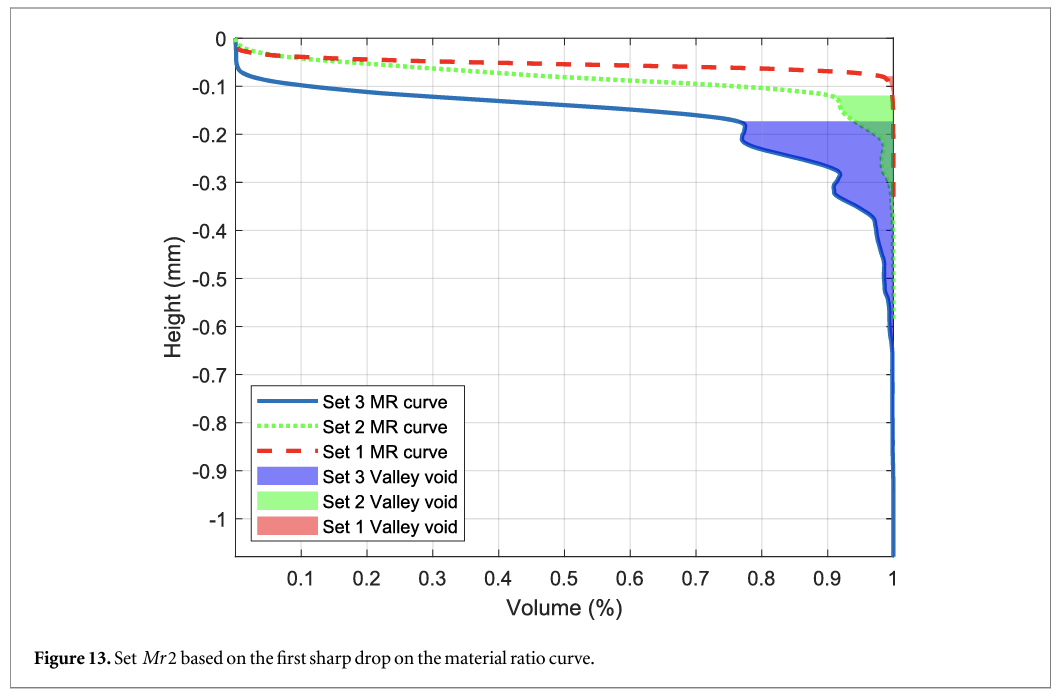
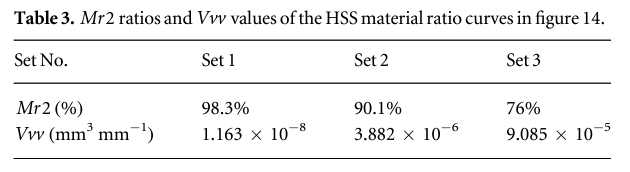
With a careful observation of 3D surface topography of Set 3, a large portion of open surface pores starts to develop near the surface height on the material ratio curve where it experiences the first dramatic fall. Therefore, setting Mr2 ratios on the first sharp drop of material ratio curves yields a good covering of open surface pores, see figure 13. The Mr2 ratios and their corresponding Vw values of the material ratio curves of HSS surfaces using this approach are listed in table 3. It is interesting to find that these manually selected Mr2 ratios are very close to those automatically generated by the secant scanning method (table 2).
5. Conclusion and future work
The material ratio curve has been proven to provide rich information that the height parameters cannot offer. AM surfaces with similar Sa may have different material ratio curves. The shape of AM material ratio curve is dependent on its 3D surface topography, which is generated by the AM process together with process parameters and surface orientation. The recesses of 3D material ratio curves are caused by reentrant features, e.g. open surface pores. These unique characteristics make the material ratio curve an effective analysis tool to differentiate various AM surface topography and to provide useful information to link surface texture with AM process optimisation and AM product functional assessment. Vw is identified as a useful parameter to characterise AM open surface pores. Vw is determined by Mr2 ratio, which is critically important for the identification of the height position where open surface pores start to develop. Three options of determining Mr2 ratio are compared, i.e. 80% as the default values in ISO 25178- 2, the secant scanning approach proposed by ISO 13565-2, and the ratio at the first dramatic drop of the material ratio curve. It is found that the secant approach and the ratio at the first dramatic drop could lead to more reasonable results, with which the valley void areas cover all open surface pores, while fixing Mr2 at the default value 80% could result inaccurate estimate of these pores.
More experiments are required to verify these two methods for an accurate characterisation of AM open surface pores. Another future work is to investigate the impact of XCT measurement parameters on open surface pores and porosity measurement, and to examine the response of 3D material ratio curve and Vw to the XCT configuration changes.
Acknowledgments
- Lou would like to acknowledge the support of the UK's Engineering and Physical Sciences Research Council (EPSRC) via New Investigator Award (EP/S000453/1), and the support of the 3 M Buckley Innovation Centre via 3 M BIC Fellowship. The authors from the University of Huddersfield gratefully acknowledge EPSRC funding of the Future Advanced Metrology Hub (EP/P006930/1). The authors also thank Digital Surf for providing the MountainsMap software.
Data availability statement
The data that support the findings of this study are available upon reasonable request from the authors.
References
- AbbottE J and Firestone FA 1933 Specifying surface quality Meeh. Eng. 55 569-72
- Abdul-Rahman H S, Lou S, Zeng W, Jiang X and Scott P J 2016 Freeform texture representation and characterisation based on triangular mesh projection techniques Measurement 2 172-82
- Anderberg C, Pawlus P, Rosen В G and Thomas T R 2009 Alternative descriptions of roughness for cylinder liner production J. Mater. Process. Technol. 2091936-42
- Attaran M 2017 The rise of 3D printing: the advantages of additive manufacturing over traditional manufacturing Bus. Horiz. 60 677-88
- Blunt L and Jiang X 2003 Advanced Techniques for Assessment Surface Topography: Development of a Basis for 3D Surface Texture Standards’ Surfstand’ (Amsterdam: Elsevier)
- Chen C, Hao Y, Bai X, Ni J, Chung S M, Liu F and Lee IS 2019 3D printed porous ТІ6А14Ѵ cage: effects of additive angle on surface properties and biocompatibility; bone ingrowth in Beagle tibia model Mater. Des. 175 107824
- Du Plessis A and Beretta S 2020 Killer notches: the effect of as-built surface roughness on fatigue failure in AlSil OMg produced by laser powder bed fusion Additive Manufacturing35 101424
- Field J, Waterhouse P and GermanM 2010 Quantifying and qualifying surface changes on dental hard tissues in vitro Journal of dentistry 38182-90
- Fox J C, Kim F, Reese Z and Evans C 2018 Complementary use of optical metrology and x-ray computed tomography for surface finish and defect detection in laser powder bed fusion additive manufacturing 2018 ASPE and euspen Summer Topical Meeting-Advancing Precision in Additive Manufacturing
- Fox J C etal 2016 Preliminary study toward surface texture as a process signature in laser powder bed fusion additive manufacturing 2016 Summer Topical Meeting: Dimensional Accuracy and Surface Finish in Additive Manufacturing
- Franco L A and Sinatora A 2015 3D surface parameters (ISO 25178- 2): actual meaning ofSpk and its relationship to Vmp Precis. Eng. 40106-11
- Friis К S, Godi A and De Chiffre L 2011 Characterisation of multifunctional surfaces with robust filters 4th International Swedish Production Symposium pp 525-32
- Gockel J, Sheridan L, Koerper В and Whip В 2019 The influence of additive manufacturing processing parameters on surface roughness and fatigue life Int. J. Fatigue 124 380-8
- Grimm T, Wiora G and Witt G 2015 Characterization of typical surface effects in additive manufacturing with confocal microscopy Surface Topography: Metrology and Properties 3 014001
- Jiang X, Blunt L and Stout К J 2000 Comparison study of areal functional parameters for rough surfaces ProcASPE (Nashville)
- Jiang X, Scott P J, Whitehouse D J and Blunt L 2007 Paradigm shifts in surface metrology. Part I. Historical philosophy Proceedings of the Royal Society A: Mathematical, Physical and Engineering Sciences 463 2049-70
- JiangX J and Whitehouse D J 2012 Technological shifts in surface metrology CIRP Ann. 61815-36
- Koutiri I, PessardE, Peyre P, Amlou О and De Terris T 2018 Influence of SLM process parameters on the surface finish, porosity rate and fatigue behavior of as-built Inconel 625 parts J. Mater. Process. Technol 255 536-46
- Las Casas E B, Bastos F S, Godoy G C D and Buono V T L 2008 Enamel wear and surface roughness characterization using 3D profilometry Tribal. Int. 411232-6
- Lawrence К D, Shanmugamani R and Ramamoorthy В 2014 Evaluation of image based Abbott-Firestone curve parameters using machine vision for the characterization of cylinder liner surface topography Measurement 55 318-34
- Lemoine A C, Mancini M P and Velez J A 2016 Multi-scale surface metrology of additive manufactured surfaces Doctoral dissertation, Worcester Polytechnic Institute
- Lesyk D A, Martinez S, Mordyuk В N, Dzhemelinskyi V V, Lamikiz A, Prokopenko G I, Grinkevych К E and Tkachenko IV 2018 Laser-hardened and ultrasonically peened surface layers on tool steel AISID2: correlation of the bearing curves’ parameters, hardness and wear J. Mater. Eng. Perform. 27 764-76
- Lou S, Jiang X, Sun W, Zeng W, Pagani L and Scott P J 2019a Characterisation methods for powder bed fusion processed surface topography Precis. Eng. 571-15
- Lou S, Pagani L, Zeng W, Ghori M U, Jiang X and Scott P J 2019b Surface texture evaluation of additively manufactured metallic cellular scaffolds for acetabular implants using x-ray computed tomography Bio-Design and Manufacturing 55-64
- Lou S, Pagani L, Zeng W, JiangX and Scott P J 2020 Watershed segmentation of topographical features on freeform surfaces and its application to additively manufactured surfaces Precis. Eng. 63 177-86
- Michigan Metrology, Applying the Bearing Ratio Parameters Case Study: Analyzing Clutch Steel Reaction Plates (https:// michmet.com/surface-roughness-analysis-blog-applying- bearing-ratio-pararneters.htm)
- McMillan A J and Jones R 2020 Combined effect of both surface finish and sub-surface porosity on component strength under repeated load conditions Engineering Reports 2 el 2248
- Michalski J and Pawlus P1992 Description of the bearing length curve of the inner surface of piston engine cylinders Wear 157 207-14
- Nasab M H, Romano S, Gastaldi D, Beretta S and Vedani M 2020 Combined effect of surface anomalies and volumetric defects on fatigue assessment of AlSi7Mg fabricated via laser powder bed fusion Additive Manufacturing34100918
- Pagani L, Qi Q, Jiang X and Scott P J 2017 Towards a new definition of areal surface texture parameters on freeform surface Measurement 109 281-91
- Pagani L, Townsend A, Zeng W, Lou S, Blunt L, Jiang X Q and Scott P J 2019 Towards a new definition of areal surface texture parameters on freeform surface: re-entrant features and functional parameters Measurement 41442-59
- Pawlus P, Reizer R, Wieczorowski M and Krolczyk G 2020 Material ratio curve as information on the state of surface topography —a review Precis. Eng. 65 240-58
- Quinsat Y, Lartigue C, Brown C A and Hattali L 2018 Characterization of surface topography of 3D printed parts by multi-scale analysis International Journal on Interactive Design and Manufacturing (IJIDeM) 121007-14
- Rosa B, Brient A, Samper S and Hascoet JY 2016 Influence of additive laser manufacturing parameters on surface using density ofpartiallymeltedparticles Surface Topography: Metrology and Properties 1045002
- Senin N, Thompson A and Leach R 2018 Feature-based characterisation of signature topography in laser powder bed fusion of metals Meas. Sei. Technol. 29045009
- Sidambe A T 2017 Three dimensional surface topography characterization of the electron beam melted ТІ6А14Ѵ Met. Powder Rep. 72 200-5
- Stachowiak G and Batchelor AW 2013 EngineeringTribology (Oxford, UK: Butterworth-Heinemann)
- Strano G, Hao L, Everson R M and Evans К E 2013 Surface roughness analysis, modelling and prediction in selective laser melting J. Mater. Process. Technol. 213 589-97
- Thompson A, Senin N, Giusca C and Leach R 2017 Topography of selectively laser melted surfaces: a comparison of different measurement methods CIRPAnn. 66 543-6
- Townsend A, Pagani L, Scott P and Blunt L 2017 Areal surface texture data extraction from x-ray computed tomography reconstructions of metal additively manufactured parts Precis. Eng. 48 254-64
- Townsend A, Senin N, Blunt L, Leach R К and Taylor J S 2016 Surface texture metrology for metal additive manufacturing: a review Precis. Eng. 4634-47
- Triantaphyllou A, Giusca C L, Macaulay G D, Roerig F, Hoebel M, Leach R K, Tomita В and Milne К A 2015 Surface texture measurement for additive manufacturing Surface topography: metrology and properties i 024002
- Whip B, Sheridan L and Gockel J 2019 The effect of primary processing parameters on surface roughness in laser powder bed additive manufacturing Int. J. Adv. Manuf. Technol 103 4411-22
- Whitehead S A, Lo L Y, Watts D C and Wilson H HF 1997 Changes of surface texture of enamel in vivo Journal of oral rehabilitation 24 449-53
- Whitehouse D J 2010 Handbook of Surface and Nanometrology (Boca Raton, FL: CRC Press)
- Zecchino M 2003 Characterizing surface quality: why average roughness is not enough Veeco Application Notes
- ZhuZ, Lou S and Majewski C 2020 Characterisation and correlation of areal surface texture with processing parameters and porosity of high speed sintered parts Additive Manufacturing 36101402