Эта статья опубликована под лицензией Creative Commons и не автором статьи. Поэтому если вы найдете какие-либо неточности, вы можете исправить их, обновив статью.

Modelling snow ice and superimposed ice on landfast sea ice in Kongsfjorden, Svalbard


Caixin Wang
Bin Cheng
Keguang Wang
Sebastian Gerland
Olga Pavlova
Опубликована Авг. 24, 2015
Последнее обновление статьи Авг. 20, 2023
Эта статья опубликована под лицензией
")


Abstract
Snow ice and superimposed ice formation on landfast sea ice in a Svalbard fjord, Kongsfjorden, was investigated with a high-resolution thermodynamic snow and sea-ice model, applying meteorological weather station data as external forcing. The model shows that sea-ice formation occurs both at the ice bottom and at the snow/ice interface. Modelling results indicated that the total snow ice and superimposed ice, which formed at the snow/ice interface, was about 14 cm during the simulation period, accounting for about 15% of the total ice mass and 35% of the total ice growth. Introducing a time-dependent snow density improved the modelled results, and a time-dependent oceanic heat flux parameterization yielded reasonable ice growth at the ice bottom. Model results suggest that weather conditions, in particular air temperature and precipitation, as well as snow thermal properties and surface albedo are the most critical factors for the development of snow ice and superimposed ice in Kongsfjorden. While both warming air and higher precipitation led to increased snow ice and superimposed ice forming in Kongsfjorden in the model runs, the processes were more sensitive to precipitation than to air temperature.
Ключевые слова
Landfast sea ice, thermodynamic modelling, superimposed ice, Snow ice, Kongsfjorden
Sea ice plays a key role in the global climate system and ecosystem (AMAP 2011; Stocker et al. 2013; Meier et al. 2014). It insulates the ocean from the atmosphere and modifies the exchange of heat, water vapour and momentum in the atmosphere–ice–ocean system. The rapid decline of Arctic sea ice in extent and thickness in recent decades (e.g., Comiso et al. 2008; Kwok & Rothrock 2009; Hansen et al. 2013; Laxon et al. 2013; Renner et al. 2014) affects the Earth’s radiation balance, atmospheric and oceanic circulations and the Arctic ecosystem (AMAP 2011; Meier et al. 2014).
Snow on top of sea ice has important implications for the sea-ice evolution. After it accumulates on ice in early winter, snow may slow down ice growth at the ice bottom. Snow on ice may delay ice melting in late spring since the snow has to melt away first. In the Arctic summer, snow melting forms melt ponds, which substantially reduce the surface albedo and change sea-ice thickness distribution (Pedersen et al. 2009). Moreover, snow may increase ice thickness through the formation of snow ice (Leppäranta 1983) or superimposed ice (Kawamura et al. 1997) at the snow/ice interface. A substantial snow cover on the sea-ice surface may result in a negative freeboard—the distance from ice surface level to the seawater level (counted negative if the ice surface level is lower than the water level)—which subsequently leads to seawater flooding of the ice surface and basal snow to form a salty slush layer. Refreezing of this slush layer then forms snow ice. On the other hand, melted snow or liquid precipitation may percolate downwards to the original ice cover to form a fresh slush layer, and refreezing of this slush layer forms superimposed ice. In terms of timing, snow ice tends to form in early winter (Leppäranta 1983), while superimposed ice formation is more pronounced in early spring, when snow melt starts (Kawamura et al. 1997; Haas et al. 2001; Nicolaus et al. 2003; Granskog et al. 2006). Besides their contribution to the total ice mass, snow ice and superimposed ice prolong the lifetime of the ice cover in summer and can greatly affect the optical properties of the upper ice surface (Haas et al. 2001; Nicolaus et al. 2003) as well as biota associated with the sea-ice environment since radiation is crucial for these organisms.
Snow ice and superimposed ice formation may contribute significantly to the total sea-ice mass. In an extreme case, snow ice can make up the entire ice floe, as observed in the Sea of Okhotsk (Shirasawa et al. 2005). Snow ice and superimposed ice can contribute up to half of the entire ice column (Palosuo 1963; Kawamura et al. 2001; Granskog et al. 2003) in the Baltic Sea. Snow ice and superimposed ice are extensive in the Antarctic (Massom et al. 2001) with a proportion from 5% (Haas et al. 2001) to 25% (Eicken et al. 1994; Jeffries et al. 1997) of the total sea-ice mass. Snow ice and superimposed ice have been observed in Kongsfjorden (Gerland et al. 1999; Nicolaus et al. 2003; Gerland et al. 2004; Gerland & Hall 2006), where the amount of superimposed ice was observed to be 8% (Nicolaus et al. 2003) or 22% (Gerland et al. 2004) of the total sea-ice mass.
Modelling snow ice and superimposed ice has been carried out for the Baltic Sea (e.g., Leppäranta 1983; Saloranta 2000; Cheng et al. 2003; Cheng et al. 2006), the Antarctic (Maksym & Jeffries 2000; Maksym & Markus 2008) and the Sea of Okhotsk (Shirasawa et al. 2005). However, in the Arctic, snow ice and superimposed ice have not drawn much attention in modelling studies so far. This is partly because the overall snow precipitation in the Arctic is relatively small compared with that in other high-latitude seas. Snow ice rarely forms because of the low ratio of snow thickness to ice thickness, and the superimposed ice usually deteriorates rapidly in the following melting season (Holt & Digby 1985). Cheng et al. (2008) modelled snow ice and superimposed ice in the central Arctic, but a proper validation is missing on account of the limitation of in situ measurements. Nicolaus et al. (2006) modelled superimposed ice formation in Kongsfjorden with a snow model; however, neither snow ice nor sea-ice evolution can be simulated with a stand-alone snow model.
In this article, we study snow ice and superimposed ice with a high-resolution thermodynamic snow and sea-ice model (HIGHTSI) in Kongsfjorden. Our objectives are: (1) to quantify the contribution of snow ice and superimposed ice to the ice mass balance on a seasonal scale; (2) to investigate the effect of snow physics, in particular, the time-dependent snow density and surface albedo, on ice mass balance; (3) to identify the most critical external forcing factors that affect seasonal snow ice and superimposed ice formation in the Arctic fjords; and finally (4) to assess the climatological conditions in the Kongsfjorden region and their impact on snow ice and superimposed ice formation. We are not aware of similar studies that have been carried out before.
In Kongsfjorden, Svalbard, measurements of snow and ice thickness and freeboard have been carried out consistently since 2003 (Gerland & Renner 2007). However, the interannual variability of the fjord’s landfast ice is high, and the amount of data that can be collected in a season varies accordingly. The monitoring set-up provides a test bench to explore various snow and sea-ice thermodynamic processes that play a role in Arctic sea-ice changes at a large scale (Nghiem et al. 2007).
Model description
Originally developed by Launiainen & Cheng (1998), the HIGHTSI model has been under continuous development and has been applied in the Antarctic (Vihma et al. 2002), the Baltic Sea (Cheng et al. 2003; Cheng et al. 2006), the Arctic (Cheng et al. 2008; Cheng et al. 2013) and sub-Arctic lakes (Semmler et al. 2012; Yang et al. 2012; Yang et al. 2013; Cheng et al. 2014). The core of the model is a partial differential heat conduction equation for snow and ice: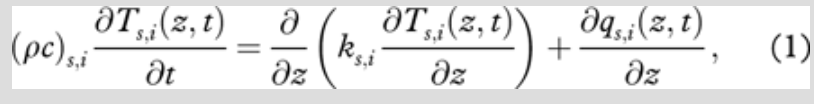
where the subscripts s and i denote snow and ice, respectively, z is the vertical axis (positive downward), t is the time, T is the temperature, ρ is the density, c is the specific heat, k is the thermal conductivity and q is the amount of incoming solar radiation penetrating below the snow and ice surface. The thermal properties (c and k) of snow and sea ice are parameterized in accordance with Sturm et al. (1997) and Pringle et al. (2007).
The melting of snow is calculated on the basis of surface energy balance (Cheng et al. 2003):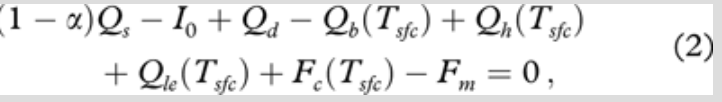
where α is the albedo, Qs is the incoming shortwave solar radiation at the surface and I0 is the net shortwave radiation that penetrates the snow or bare ice, contributing to internal heating of the snow and ice. Qd and Qb are the incoming and outgoing longwave radiation. Qh and Qle are the sensible and latent heat flux. Fc is the surface conductive heat flux, and Fm is the heat used for surface melting. All fluxes are positive towards the snow or ice surface. The penetration of solar radiation into snow and ice is considered so subsurface snow melting can be quantitatively calculated (Cheng et al. 2003).
Estimation of liquid precipitation in the winter season is challenging, primarily because of the lack of precipitation data and the difficulty in discriminating the types of precipitation that reach the ground. Whether precipitation is solid or liquid from fall to spring seasons depends largely on the temperature conditions (Auer 1974). A recent study suggested that this critical air temperature is highly geographically dependent, varying from −1.0°C up to 2.5°C in northern Eurasia (Ye et al. 2013). To assign precipitation to either snow or rain, we use a threshold temperature of 0.5°C (Yang et al. 2013). The slush from wet/melting snow is assumed to be at the freezing point and percolates downward to the snow/ice interface without delay (Cheng et al. 2003).
The calculation of slush and snow ice formation is based on Archimedes’ Principle. The process of snow ice formation was initially studied by Leppäranta (1983) and later by Saloranta (2000). The freeboard (fb) is calculated from the equation of isostatic balance: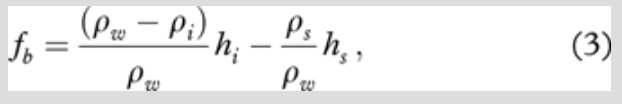
where hi and hs are the thicknesses of ice and snow, respectively, and ρi, ρs and ρw are the sea ice, snow and sea water densities. When the freeboard becomes negative (fb<0), seawater reaches the ice surface through cracks or pores (assuming the sea ice is permeable enough) or from the edges of ice floes. The amount of slush formed is computed in accordance with Saloranta (2000), as shown below
where Ws is the weight of overlying snow in water equivalent (WE). B is the buoyancy of the ice, snow ice and old slush layers: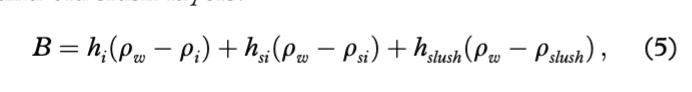
where hsi and ρsi are the thickness and density of snow ice, and hslush and ρslush are the thickness and density of flooded slush, respectively. The snow slush is a mixture of water, ice and air bubbles. Its density is hard to measure accurately, varying from about 700 to 960 kg m−3 (Adolphs 1998). The slush density here is taken as 920 kg m−3, as by Saloranta (2000).
Refreezing of the slush is calculated according to the heat flux divergence at the snow/ice interface:
where hsui and ρsui are the thickness and density of superimposed ice or snow ice, and Lf is the specific latent heat of freezing. The formation of snow ice and superimposed ice is naturally limited to the available total snow slush created by flooding and surface melting and sleet or wet snow/rainfall. After snow-to-ice transformation, the snow ice or superimposed ice becomes an integral part of the total ice thickness.
At the ice bottom, the ice temperature is kept at freezing point (Tf) in the model, and the heat is used to grow or melt the ice:
where Fw is the heat flux from water to ice. Table 1 summarizes the parameters used in the model.
Table 1 Numerical values of model parameters and constants in high-resolution thermodynamic snow and sea-ice model (HIGHTSI). | ||
Abbreviation | Parameter/constant | Value |
ci | Specific heat of sea ice | 2093 J kg−1 K−1 |
cs | Specific heat of snow | 2093 J kg−1 K−1 |
ρi | Density of sea ice | 910 kg m−3 |
ρs | Initial density of snow | 330 kg m−3 |
ρw | Density of sea water | 1020 kg m−3 |
ρsui | Superimposed ice density | 850 kg m−3 |
ρslush | Slush density | 920 kg m−3 |
Tf | Freezing point temperature of seawater | −1.8°C |
Lf | Specific latent heat of freezing | 0.33×10⁶ J kg−1 |
In situ measurements and forcing data for model simulations
Study site and in situ data
Located on the west coast of Spitsbergen, Svalbard, Kongsfjorden (79°N, 12°E) is about 20 km long and 4–10 km wide (Fig. 1). Landfast sea ice in this fjord generally forms between December and March and lasts until June (Svendsen et al. 2002; Gerland & Renner 2007; Gerland et al. 2007; Pavlova et al. 2011). The inner fjord is usually covered by landfast ice during the ice season, with ice thickness <1 m (Gerland & Renner 2007). The fjord not only is usually dominated by cold and fresh Arctic water, but also can be dominated by warm and saline Atlantic water, which flushes into the fjord from the continental slope of western Spitsbergen (Cottier et al. 2005) after persistently southerly or northerly winds (Cottier et al. 2007).

The 2003/04 winter had the highest maximum of snow and ice thickness in Kongsfjorden according to in situ observations between 1997 and 2011 (Pavlova et al. 2011). In that year, snow and ice thickness, as well as freeboard, were measured approximately biweekly by the Norwegian Polar Institute (NPI) at four sites (K1–K4) in the inner part of the fjord (Gerland & Renner 2007) from 23 January to 21 May (Fig. 1). The large standard deviation (SD) of the mean (average at the four observation sites) snow depth and ice thickness (Fig. 2a, b) indicates that snow and ice thickness had large spatial and temporal variability (Gerland & Hall 2006, see also their figure 3a), for example, after 9 February for the mean snow thickness, or on 10 March (±8 cm), 22 April (±10 cm) and 7 May (±8 cm) for the mean ice thickness. The mean from the four observation sites is used in the following model simulations.

In the beginning of the monitoring period, there was on average 9 cm snow on top of 54-cm-thick ice (Fig. 2a, b). Afterwards, the mean snow thickness started to increase after the third visit (9 February) and reached a maximum of 30 cm on 6 April. From then on, the snow thickness decreased under the influence of warm air and increased radiative forcing (Fig. 3a), reaching 8 cm on 21 May. The mean ice thickness generally kept increasing until reaching a maximum thickness of 92 cm by 8 May. Afterwards, the mean ice thickness decreased slightly, reaching 89 cm on the last visit. The rate of the increase of ice thickness was relatively large (ca. 1 cm day−1) before 20 March. Negative freeboard was registered between 10 March and 22 April (Fig. 2c), with the lowest value being −37 cm measured on 20 March. The SD of the mean freeboard was small (<1 cm) before 9 February and became large (2–5 cm) afterwards, when major snowfall events started (Fig. 3c). The large SD of freeboard was correlated with the large SD of the mean snow thickness (Fig. 2a).
Forcing data for model simulations
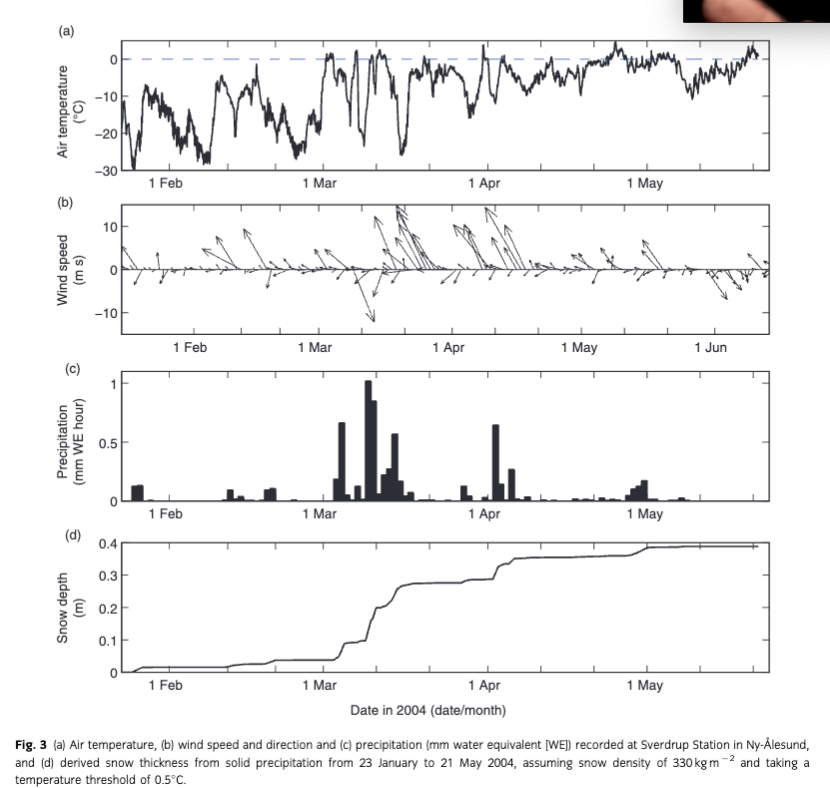
Air temperature, wind speed and direction, relative humidity, precipitation and cloudiness were recorded at the weather station of the NPI’s Sverdrup Station in Ny-Ålesund (78°57.9′N, 11°51.4′E; www.eKlima.no) at the southern shore of Kongsfjorden (see Fig. 1). The time interval of observation is one hour for air temperature, relatively humidity, wind speed and direction, 12 hours for precipitation and three times a day (6:00, 12:00 and 18:00 UTC) for cloudiness. Cloudiness and precipitation measurements are linearly interpolated into hourly data and used to force the model.
In the period between 23 January and 21 May 2004, the air temperature (Fig. 3a) was generally low (below −5°C) until the end of February. In March, temperatures were highly variable, with maxima temperatures above 0°C in warm spells and minima as low as −27°C in cold spells. From early April onwards, the weather became warmer, with more periods staying above 0°C. In addition, the diurnal variation became more pronounced in this period. During the monitoring period, the dominant wind direction (Fig. 3b) was south-easterly (120°), representing the prevailing winds in Ny-Ålesund (Svendsen et al. 2002). The total precipitation was 165.2 mm WE, mainly in March and early April (Fig. 3c). With a threshold of 0.5°C, the amount of solid precipitation would be 155 mm WE. This would result in an accumulated snow depth of 39 cm by 6 April and 47 cm by 23 May (Fig. 3d) using a snow density of 330 kg m−3. In contrast, the measured snow thickness was 21 cm (from 9 to 30 cm) from the beginning of the monitoring period to 6 April, substantially lower than the estimated snow accumulation during the same period. The difference (18 cm) may be attributed to wind drift, snow-to-ice transformation or local differences in precipitation between Ny-Ålesund (where the meteorological observations are made) and in the inner fjord.
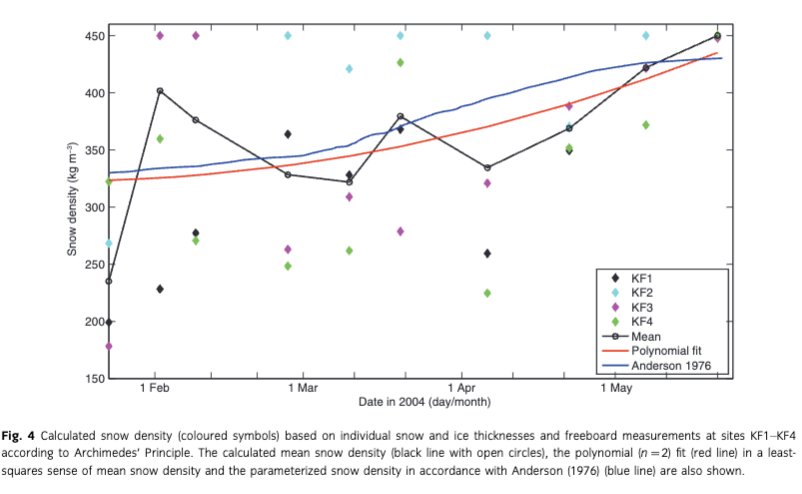
The impact of wind on snow redistribution cannot be assessed quantitatively without high-resolution spatial wind and snow measurements. The ageing and densification of the bulk snow layer can, however, be estimated based on observed snow and ice thicknesses and freeboard if it is assumed that the ice floe was in isostatic equilibrium when the measurements were taken. According to Eqn. 3, based on the fact that sea-ice density is relatively constant, the snow density can be calculated as![]()
The calculated snow density demonstrates large spatial and temporal variability during the monitoring period (Fig. 4). The mean snow density at the four observation sites varied from 235 to 450 kg m−3 from January to May. In May, it was from 372 to 450 kg m−3, which is similar to the range of the snow density measured in late spring 2002 by Nicolaus et al. (2003). The temporal variation of the mean snow density was nonlinear. Fitted with a second-order (n=2) polynomial, the parameterized snow density based on in situ data increased with time (Fig. 4), which is close to that calculated from the parameterization of Anderson (1976).
Model experiments
To investigate snow ice and superimposed ice formation and factors affecting ice evolution, seven model experiments were carried out during the monitoring period (Table 2): one reference run (Ref), three experiments involving snow physics (S1 [snow density], S2 [wind drift] and S3 [albedo]) and three experiments involving oceanic heat flux (F1, F2 and F3). In Ref, a parameterized snow density (Anderson 1976), a constant oceanic heat flux of 2 W m−2 (Maykut & Untersteiner 1971) and a sophisticated surface albedo scheme (Briegleb et al. 2004) were applied. In experiment S1, mean snow densities derived from 2004 in situ measurements in Kongsfjorden (black line in Fig. 4) replaced the parametrized snow density used in Ref. Under windy conditions, directly applying solid precipitation as model input may overestimate the snow accumulation. In experiment S2, 85% of the solid precipitation was used as input into the model, arbitrarily assuming that 15% of the solid precipitation was removed by wind. The snow melting which occurred during the monitoring period can substantially reduce the surface albedo and further influence the snow and ice evolution during the melting season. To investigate the impact of surface albedo on snow and ice evolution, model experiment S3 was run with an albedo scheme derived from measurements on Arctic landfast ice (Flato & Brown 1996) in which albedo is a function of snow and ice thickness and surface temperature. The oceanic heat flux (Fw) is crucial for the fate of Arctic sea ice (Polyakov et al. 2010) and also for fjord ice. It may increase over time with the intrusion of relatively warm Atlantic water (Cottier et al. 2005) in Kongsfjorden, or as more solar radiation penetrates through ice in spring and summer (Maykut & McPhee 1995; Perovich & Elder 2002). With the shrinkage and thinning of the Arctic sea ice in recent decades, more solar radiation has been shown to penetrate through the ice (Nicolaus et al. 2012; Hudson et al. 2013). This implies that the oceanic heat flux likely increases as ice thickness decreases, especially in spring, when more solar radiation is available. To investigate the influence of oceanic heat flux on ice, constant oceanic heat flux values of 5 and 10 W m−2 were prescribed in experiments F1 and F2, respectively. Linking the oceanic heat flux with temporal variation of ice thickness, a third experiment F3 was carried out applying a simple parameterization of oceanic heat flux (Fw) (see Table 2).
Table 2 Configurations of high-resolution thermodynamic snow and sea-ice model (HIGHTSI) experiments. | |
Experiment run | Parameters |
Ref | ρsa(initial)=330 kg m−3; ρs calculated according to the parameterization of Anderson (1976); Fwb=2 W m−2; |
S1 | Ref set-up, but ρs is derived from in situ data |
S2 | S1 set-up, snow input=85% solid precipitation |
S3 | S2 set-up, albedo scheme (Flato & Brown 1996) |
F1 | Ref set-up, but Fw=5 W m−2 |
F2 | Ref set-up, but Fw=10 W m−2 |
F3 | Ref set-up, but Fw time-dependent; Fw=2, if hic≤0.6; Fw=hi×15−7, if 0.6≤hi≤1; and Fw=8, if hi>1 |
aρs is the snow density. bFw is the oceanic heat flux. chi is the ice thickness.
Results
The modelled snow thickness, freeboard and ice thickness are presented in Fig. 5 along with observed data. Prior to 10 March, the modelled snow thickness in experiment Ref was in line with observations (Fig. 5a). The simulation error increased between 10 March and 20 April, when snowfall episodes occurred. Afterwards, the modelled snow thickness remained quite stable, overestimating the thickness towards the end of the simulation (9 and 12 cm positive bias in May; see Table 3). The modelled freeboard also agreed well with observations until 10 March. It remained largely lower than the observations in the remaining period in response to the overestimation of snow thickness. The mean bias of the modelled freeboard in April and May was −7 cm. Until 10 March, the modelled total ice thickness followed the observations well. Afterwards, the ice thickness was overestimated by the model, with the modelled thickness 11 cm larger than the observations in April.

Table 3 Bias, root mean square error (RMSE) and correlation coefficient of simulated snow thickness, freeboard and ice thickness compared to observations. | |||||||||
| Snow thickness (hs) | Freeboard (fb) | Ice thickness (hi) | ||||||
Model runs | Bias (cm) | RMSE (cm) | Corr. coef. | Bias (cm) | RMSE (cm) | Corr. coef. | Bias (cm) | RMSE (cm) | Corr. coef. |
Ref | 2.2 | 5.5 | 0.83 | −3.0 | 5.5 | 0.54 | 4.7 | 6.3 | 0.98 |
S1 | 3.0 | 5.9 | 0.84 | −2.2 | 4.5 | 0.54 | 4.5 | 5.7 | 0.99 |
S2 | 1.7 | 4.4 | 0.90 | −0.8 | 2.9 | 0.68 | 2.6 | 3.6 | 0.99 |
S3 | 0.5 | 4.1 | 0.90 | −0.1 | 2.7 | 0.80 | 2.7 | 4.0 | 0.98 |
The temporal variation of modelled snow thickness in experiment S1 was more pronounced compared with experiment Ref, particularly in April. This is because snow density in experiment S1 followed more closely the in situ conditions. The modelled snow remained overestimated at the end of the season. The modelled freeboard and ice thickness in experiment S1 showed some improvement compared with experiment Ref.
When the solid precipitation input into the model (experiment S2) was reduced, the modelled snow thickness was the same compared with experiments Ref and S1 before 10 March, because the snow precipitation was small. Afterwards, experiment S2 produced slightly thinner snow and ice but a larger freeboard as compared with experiment S1 because of less solid precipitation input. At the end of the monitoring period, the thinner snow in experiment S2 resulted in an overall better estimation of freeboard and ice thickness compared with observations.
After applying the albedo scheme of Flato & Brown (1996) into the model in experiment S3, the simulation results did not show considerable differences to experiment S2 until 6 April. Afterwards, the simulated snow thickness in experiment S3 became lower than in experiment S2 (Fig. 5a), especially after 22 April. This is because the snow metamorphism and snow melting decreased the surface albedo, which in turn enhanced the surface melting during the melting season. The reduction in snow lightened the overburden of weight on ice and, therefore, the freeboard became positive faster in experiment S3 than in experiment S2.
Differences between simulated and observed snow and ice thickness and freeboard are summarized in Table 3. Overall, in experiment S3 the simulated snow and freeboard were more consistent with the observations, having the least bias and root mean square errors (RMSE) and higher coefficients.
Slush can form with flooding from the ocean or as a result of snow melting or liquid precipitation. Time series of these kinds of slush formation in the model experiments are shown in Fig. 6. In the experiments Ref and S1–S3, slush due to flooding started to form around 10 March and increased in April (Fig. 6a). Afterwards, it decreased to zero, with the freeboard becoming positive (Fig. 5b). The amount of slush due to flooding was greater in experiments Ref and S1 and less in experiments S2 and S3 (Fig. 6a) in response to the overburden amount of snow. Slush due to melting/wetting mainly formed after 20 April (Fig. 6b) in Ref and S1–S3 experiments. The amount of slush was similar among Ref, S1 and S2 experiments but was more in experiment S3, which can be explained by the albedo feedback included in experiment S3. We, therefore, conclude from the model results that the slush was mainly formed by flooding processes during March and April; its formation shifted from flooding to snow melting with the enhancement of snow melting in May. By the end of the monitoring period, the total slush formation was 16, 15, 13 and 17 cm in experiments Ref, S1, S2 and S3, respectively. Refreezing the slush formed 14, 13, 11 and 15 cm of snow ice and superimposed ice in experiments Ref, S1, S2 and S3, respectively, accounting for 15, 14, 13 and 15% of the total ice mass, and 36, 35, 34 and 32% of the total ice growth during the simulation period. This suggests that the ice growth at the ice bottom alone could not explain the total seasonal ice growth and implies that the upward ice growth at the ice surface was a major contributor.

Oceanic heat flux affected the ice bottom evolution. Figure 7 shows the ice bottom changes in experiments Ref and F1–F3. With larger oceanic heat flux, there was less ice bottom accretion and more ice bottom ablation in Kongsfjorden. During the simulation period, sea ice at the ice bottom grew 25 cm in experiment Ref and 16 cm in experiment F1, while the growth (13 cm) and melting cancelled each other in experiment F2. In experiment F3, the calculated oceanic heat flux gradually increased from 2 W m−2 in early February to roughly 8 W m−2 towards the end of the simulation period. The modelled ice growth at the ice bottom in experiment F3 did not differ significantly from experiment Ref before 1 March. Afterwards, there was less ice growth and more melting at the ice bottom in experiment F3 compared with experiment Ref, since the penetration of solar radiation made more energy available at the ice bottom.

Discussion
2003/04 season
Long-term snow and ice monitoring indicated that during the winter of 2003/04 ice formed relatively early in the fjord (Gerland & Hall 2006). Prior to the in situ measurements, the weather station record from Ny-Ålesund showed that the air temperature was below −10°C in early December 2003, with a monthly mean of about −17°C. January 2004 was still cold, with a mean air temperature of −15.8°C. The prevailing weather condition favoured a total ice growth up to a half metre before the in situ measurements started. The total snow precipitation was 46 mm WE before the in situ measurement started, roughly corresponding to a total 14 cm snow accumulation (using ρs=330 kg m−3). The mean snow thickness from measurements was 8 cm at the first visit on the landfast ice (23 January 2004), which is thinner than the expected snow accumulation of 14 cm (using ρs=330 kg m−3). This might suggest that snow ice formation most likely occurred before 23 January, as in other seasonal ice-covered seas, for example, the Baltic Sea, partly because heavy snowfall on thin ice easily leads to negative freeboard.
During the winter season 2003/04, the air temperature rose occasionally above 0°C in April. The parameterized daily mean downward solar radiation under clear sky conditions was 240 W m−2 in early April. This would enhance internal and surface melting of the snow during daytime, as clearly observed since April. Our simulated superimposed ice formation (Fig. 6) is consistent with such melting. In fact, superimposed ice formation in spring has also been observed in other Arctic and sub-Arctic seasonal ice-covered seas, for example, in Van Mijenfjorden (Gerland & Hall 2006) and in the Baltic Sea (Granskog et al. 2006).
The modelled snow thickness deviated more from the observations during snowfall events. This is most likely due to differences in the snowfall at Ny-Alesund and inner fjord as well as the uncertainty of the model input of solid precipitation and the crude estimation of the wind drift effect on snow accumulation (see Fig. 5). When snowfall started, the accumulated snow thickness instantly showed spatial variation caused by the wind and ice surface topography, which was not captured in our study. Additionally, the inaccuracy of observed solid precipitation could directly contribute to the deviation of snow thickness. Improving snow information largely relies on accurate measurement of precipitation and better physics being taken into account in the models. Applying prescribed snow density based on observations somewhat improved the modelled snow thickness, particularly the snow growth. This was also demonstrated by Semmler et al. (2012) in a study of lake ice.
The freeboard detection is crucial for large-scale sea-ice monitoring conducted by space-borne (e.g., CryoSat-2) or helicopter-borne altimetry in recent years. Freeboard observation in the field is challenging, especially in late spring. With increasing solar radiation and the air temperature fluctuating around 0°C, deteriorated ice, metamorphosed snow, ice lenses and gap layers often form within the snow or at the snow/ice interface, resulting in difficulty in determining the snow/ice interface when making in situ measurements (Wang et al. 2013). Simulating freeboard in the model was also challenging. The modelled freeboard was lower than the measured freeboard after the ice surface was below the water level (Fig. 5). A bulk snow density application for the whole snow layer may have resulted in errors of the modelled freeboard, since precipitation conditions and snow metamorphosis during the season would result in vertical variability in snow density. Improving snow density and solid precipitation inputs to the model could, to some extent, improve the model results (Fig. 5). However, a better modelling of freeboard depends on a better understanding of the snow physics.
In wintertime, for a thick ice floe with snow cover, the upward heat flux at the ice bottom is greatly constrained by the insulation of ice and snow, so that the bottom ice growth largely depends on the oceanic heat flux. Our study confirmed that the oceanic heat flux is a key factor for sea-ice development in Kongsfjorden (Gerland & Hall 2006). Kongsfjorden can be less influenced by the Atlantic water in some years (Cottier et al. 2005; Tverberg et al. 2007). This is represented in the model by a small oceanic heat flux of 2 W m−2, which reproduced the sea-ice evolution in 2004 well. The warming of the West Spitsbergen Current (Pavlov et al. 2013) indicates that there is more oceanic heat flux available if the Atlantic water flushes into Kongsfjorden (Cottier et al. 2007), which would have a significant role in the sea-ice evolution in the fjord. This will be further investigated in different seasons. Solar radiation penetrating through ice is also a source of oceanic heat flux (Maykut 1982; Perovich et al. 2007) and plays an important role in diminishing Arctic sea ice (Hudson et al. 2013). In this study, the role of solar radiation was investigated simply by assuming a dependence of oceanic heat flux on sea-ice thickness (experiment F3). The reduced ice growth from April to the end of the observation period in late May indicated the importance of sea-ice thickness to the oceanic heat flux, especially in late spring (April–May). With snow thinning in late spring, there was more solar radiation penetrating through the ice into the ocean, warming the upper ocean and increasing melt at the bottom of the ice.
Climatology investigation
Our seasonal study confirmed that snow ice and superimposed ice develop on the ice surface in Kongsfjorden. Air temperature and precipitation are critical factors for snow ice and superimposed ice formation. An increase in air temperature has been found in Svalbard (Øyvind et al. 2014). It is one of the reasons for the less severe sea-ice conditions in Grønfjorden, Svalbard (Zhuravskiy et al. 2012) and has been considered one of the factors contributing to the decrease of Arctic sea ice (Screen & Simmonds 2010). A recent study showed that the largest external uncertainty for snow and ice thermodynamic modelling originated from precipitation (Cheng et al. 2014). The increase in total precipitation in winter could naturally increase the overall snow load on ice and lead to the formation of more snow ice. Rain and sleet falling on ice favour superimposed ice formation. A mild winter is usually associated with higher air temperature and more snow, whereas a severe winter is usually associated with cold and little snow.
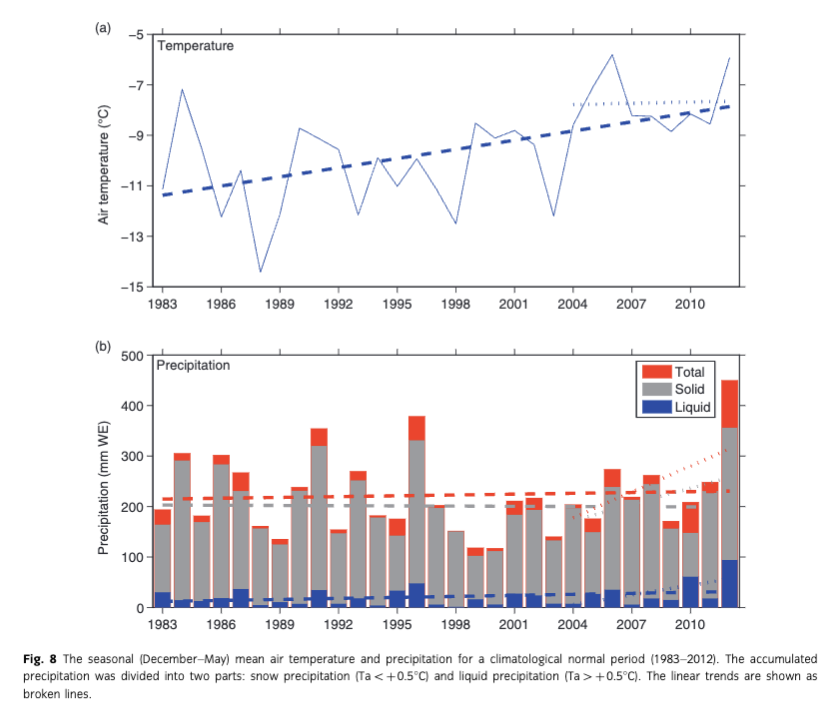
In Kongsfjorden, the seasonal mean (December–May) air temperature and accumulated precipitation demonstrates large interannual variability during the past 30 years (1983–2012; Fig. 8). The mean air temperature has a statistically significant (at the 95% level) positive trend in the ice season (coefficient: r2=0.28; significance: p=0.0013). For just the recent 10-year period 2003–2012, the mean air temperature still increased but the trend was not statistically significant (r2=0.0015; p=0.46). The accumulated total precipitation roughly remains unchanged from 1983 to 2012. There was a slight decrease/increase in solid/liquid precipitation during the same period, but the trend was not statistically significant at the 95% level. However, in the last decade (2003–2012), a positive trend with statistically significant levels (at 95%) is detected for the accumulated total precipitation (r2=0.31; p=0.047), and the liquid precipitation (r2=0.32; p=0.044), but not for the snow precipitation (r2=0.19; p=0.104).
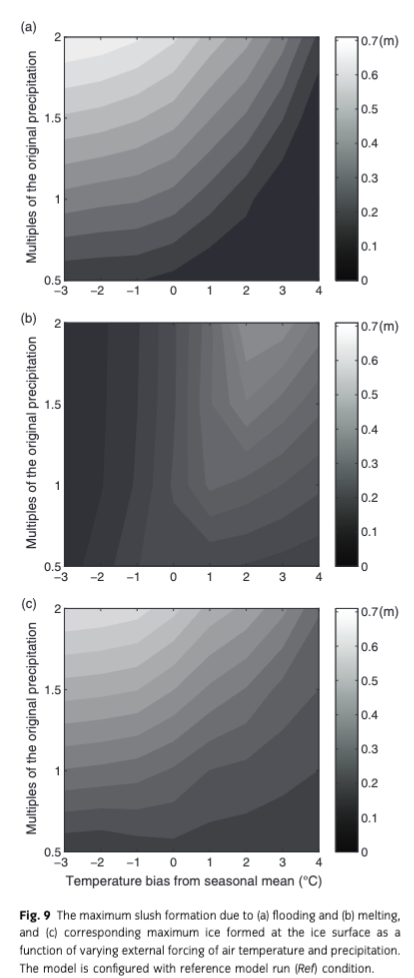
The effect of temperature or precipitation on snow ice and superimposed ice can be investigated by simple model sensitivity experiments. With the reference model run (Ref) conditions, an increase in seasonal mean air temperature by 1°C could reduce the modelled maximum ice thickness by 5 cm, meaning roughly 5% reduction of the total ice thickness. An increase in the total precipitation by 50% could result in 15 cm more maximum ice thickness in the reference run due to ice formation at the ice surface. The effect of temperature and precipitation on maximum slush formation due to flooding, melting as well as maximum snow to ice transformation was demonstrated by a number of model experiments forced with different combinations of air temperature and precipitation (Fig. 9). Under cold conditions, the slush formation due to flooding was almost linearly proportional to the total available precipitation. With the large precipitation scenario, the formation of slush due to flooding was sensitive to temperature changes. The slush formation due to melting was less sensitive to precipitation in cold conditions and more sensitive in warm conditions. The formation of slush due to melting was also sensitive to temperature changes when there was a great deal of seasonal precipitation. The total granular ice formation was more sensitive to precipitation than the temperature.
Conclusions
Applying the one-dimensional thermodynamic snow and ice model HIGHTSI in Kongsfjorden showed that the total snow ice and superimposed ice formation accounted for 15% of the total ice mass. This is likely a typical value compared with the observations (Nicolaus et al. 2003; Gerland et al. 2004) in the fjord. It indicated that snow ice and superimposed ice formation at the snow/ice interface was a major contributor to the total ice mass in the fjord.
The modelled snow thickness appears to be sensitive to the snow density used as input. The parameterized snow density gradually increases in response to the snow ageing and densification. However, the temporal variations of snow density due to snowfall events and wind were not included in the parameterization scheme. Applying a prescribed snow density (experiment S1) based on field measurements could improve the temporal variation of snow thickness (Semmler et al. 2012). Large errors of the modelled snow thickness occur during the periods when snowfall happen, largely due to uncertainties of snow precipitation and wind drift. Tuning the solid precipitation has a minor impact on the total snow and ice mass balance (experiment S2). We conclude that to improve the snow input for ice models, the wind effect on snow drift needs special attention. After the onset of snowmelt, surface albedo plays a critical role and eventually affects the modelled snow and ice thickness much more effectively than the snow precipitation (experiment S3).
The modelled snow ice and superimposed ice accounted about 35% of the total ice growth at the end of model simulation. Unfortunately, we do not have in situ measurements of snow ice and superimposed ice to verify modelled results. However, results from various sensitivity studies indicated that the total growth of sea ice could not be solely accounted for by bottom freezing. Modelling showed that snow ice and superimposed ice developed at the ice surface from the combined effect of air temperature and precipitation (see Fig. 9).
The current modelling work was confined to the observation period using meteorological data as model forcing. A next step would be to focus on field campaigns and modelling experiments for the entire winter season. It is important to emphasize that our modelling work identified the slush layer as a source of both snow ice and superimposed ice formation. More detailed information, for example, ice core analysis and ice salinity, would be required to validate separately snow ice and superimposed ice. Intensive and long-term sustainable in situ observations are critically important for better understanding snow ice and superimposed ice thickness as well as tests and experiments with novel modelling approaches. Monitoring sea ice is much easier and more cost-efficient at coastal sites, such as Arctic fjords, in contrast to the Arctic Basin. Arctic coastal sites provide us a good experimental base to further explore snow and ice processes, especially with respect to thermodynamic ice evolution.
Air temperature and precipitation are critical factors for snow ice and superimposed ice formation. There is a positive trend in air temperature and in total precipitation in Kongsfjorden during the past 30 years (1983–2012) and the past 10 years (2004–2012). The increase in wintertime air temperature could significantly affect snow metamorphism and snow and ice temperature distributions (Vihma et al. 2011). Our model sensitivity study illustrates that slush formation and the total ice formation at the ice surface are more sensitive to precipitation than to air temperature. More precipitation would cause more ice formation at the ice surface. With the thinning of the Arctic sea ice (Gerland et al. 2008; Kwok & Rothrock 2009; Kwok & Untersteiner 2011; Maslanik et al. 2011; Hansen et al. 2013; Renner et al. 2014), the warming of the Arctic (AMAP 2011; Stocker et al. 2013) and projected increases in Arctic precipitation (e.g., Kattsov et al. 2005), snow ice and superimposed ice are most probably becoming more extensive and will contribute more to the total ice thickness in Kongsfjorden, other Svalbard fjords and other Arctic regions.
Acknowledgements
We thank the personnel of the NPI’s Sverdrup Station in Ny-Ålesund, Svalbard, for conducting snow and ice thickness measurements in Kongsfjorden. We are grateful to Oddveig Øien Ørvoll (NPI) for producing the map of Kongsfjorden and Lana Cohen (NPI) for language checking. This study was supported by the Research Council of Norway, through the projects 178246/S30 (Climate of Norway and the Arctic in the 21st century) and 193592 (Advancing Modelling and Observing Solar Radiation of Arctic Sea Ice), and by the Academy of Finland (contract no. 259537), by the NPI and its Centre for Ice, Climate and Ecosystems through the projects ICE-Fluxes and Svalbard Fast Ice Monitoring, and by the Fram Centre Arctic Ocean flagship programme through the project Developing Modelling Tools to Understand the Role of Solar Radiation to Sea Ice Mass Balance in a Seasonally Ice-Covered Arctic. The meteorological data used in this study were measured by the personnel of the Sverdrup Station for the Norwegian Meteorological Institute and were accessed through the institute’s eKlima website.
References
- Adolphs U. 1998. Ice thickness variability, isostatic balance and potential for snow ice formation on ice floes in the south polar Pacific Ocean. Journal of Geophysical Research—Oceans 103, 24675–24691. Publisher Full Text
- AMAP (Arctic Monitoring and Assessment Programme) 2011. Snow, water, ice and permafrost in the Arctic (SWIPA): climate change and the cryosphere. Oslo: Arctic Monitoring and Assessment Programme.
- Anderson E.A. 1976. A point energy and mass balance model of a snow cover. NOAA Technical Report 19. Silver Spring, MD: US Department of Commerce, National Oceanic and Atmospheric Administration, Office of Hydrology.
- Auer A.H. 1974. The rain versus snow threshold temperatures. Weatherwise 27, 67. Publisher Full Text
- Briegleb B.P., Bitz C.M., Hunke E.C., Lipscomb W.H., Holland M.M., Schramm J.L. & Moritz R.E. 2004. Scientific description of the sea ice component in the Community Climate System Model, Version Three. NCAR Technical Report NCAR/TN-463+STR. Boulder, CO: National Center for Atmospheric Research.
- Cheng B., Launiainen J. & Vihma T. 2003. Modelling of superimposed ice formation and subsurface melting in the Baltic Sea. Geophysica 39, 31–50.
- Cheng B., Mäkynen M., Similä M., Rontu L. & Vihma T. 2013. Modelling snow and ice thickness in the coastal Kara Sea. Annals of Glaciology 53, 105–113. Publisher Full Text
- Cheng B., Vihma T., Pirazzini R. & Granskog M.A. 2006. Modelling of superimposed ice formation during the spring snowmelt period in the Baltic Sea. Annals of Glaciology 44, 139–146. Publisher Full Text
- Cheng B., Vihma T., Rontu L., Kontu A., Kheyrollah Pour H., Duguay C. & Pulliainen J. 2014. Evolution of snow and ice temperature, thickness and energy balance in Lake Orajärvi, northern Finland. Tellus A 66, article no. 21564, doi: http://dx.doi.org/10.3402/tellusa.v66.21564 Publisher Full Text
- Cheng B., Zhang Z., Vihma T., Johansson M., Bian L., Li Z. & Wu H. 2008. Model experiments on snow and ice thermodynamics in the Arctic Ocean with CHINARE 2003 data. Journal of Geophysical Research—Oceans 113, C09020, doi: 10.1029/2007JC004654. Publisher Full Text
- Comiso J.C., Parkinson C.L., Gersten R. & Stock L. 2008. Accelerated decline in the Arctic sea ice cover. Geophysical Research Letters 35, L01703, doi: 10.1029/2007GL031972. Publisher Full Text
- Cottier F.R., Nilsen F., Inall M.E., Gerland S., Tverberg V. & Svendsen H. 2007. Wintertime warming of an Arctic shelf in response to largescale atmospheric circulation. Geophysical Research Letters 34, L10607, doi: 10.1029/2007GL029948. Publisher Full Text
- Cottier F.R., Tverberg V., Inall M.E., Svendsen H., Nilsen F. & Griffiths C. 2005. Water mass modification in an Arctic fjord through cross-shelf exchange: the seasonal hydrography of Kongsfjorden, Svalbard. Journal of Geophysical Research—Oceans 110, C12005, doi: 10.1029/2004JC002757. Publisher Full Text
- Eicken H., Lange M.A., Hubberten H.-W. & Wadhams P. 1994. Characteristics and distribution patterns of snow and meteoric ice in the Weddell Sea and their contribution to the mass balance of sea ice. Annales Geophysicae 12, 80–93. Publisher Full Text
- Flato G.M. & Brown R.D. 1996. Variability and climate sensitivity of landfast Arctic sea ice. Journal of Geophysical Research—Oceans 101, 25767–25777. Publisher Full Text
- Gerland S., Gascard J.C., Ivanov B., Nielsen C.P., Nilsen E., Pavlova O., Leu E., Tverberg V. & Barrault S. 2007. Fast ice evolution in Kongsfjorden compared with other Svalbard fjords. Extended abstract. In R. Azzolini (ed.): 8th Ny-Ålesund seminar. 16–17 October 2007. Cambridge, UK. Polarnet Technical Report. Pp. 44–46. Rome: Earth and Environment Department, National Research Council.
- Gerland S., Haas C., Nicolaus M. & Winther J.-G. 2004. Seasonal development of structure and optical surface properties of fast-ice in Kongsfjorden, Svalbard. Reports on Polar and Marine Research 492, 26–34.
- Gerland S. & Hall R. 2006. Variability of fast-ice thickness in Spitsbergen fjords. Annals of Glaciology 44, 231–239. Publisher Full Text
- Gerland S. & Renner A.H.H. 2007. Sea-ice mass balance monitoring in an Arctic fjord. Annals of Glaciology 46, 435–442. Publisher Full Text
- Gerland S., Renner A.H.H., Godtliebsen F., Divine D. & Løyning T.B. 2008. Decrease of sea ice thickness at Hopen, Barents Sea, during 1966–2007. Geophysical Research Letters 35, L06501, doi: 10.1029/2007GL032716. Publisher Full Text
- Gerland S., Winther J.-G., Ørbæk J.B. & Ivanov B.V. 1999. Physical properties, spectral reflectance and thickness development of first year fast ice in Kongsfjorden, Svalbard. Polar Research 18, 275–282. Publisher Full Text
- Granskog M.A., Kaartokallio H. & Shirasawa K. 2003. Nutrient status of Baltic Sea ice: evidence for control by snow-ice formation, ice permeability, and ice algae. Journal of Geophysical Research—Oceans 108, 3253, doi: 10.1029/2002JC001386. Publisher Full Text
- Granskog M.A., Vihma T., Pirazzini R. & Cheng B. 2006. Superimposed ice formation and surface energy fluxes on sea ice during the spring melt–freeze period in the Baltic Sea. Journal of Glaciology 52, 119–127. Publisher Full Text
- Haas C., Thomas D.N. & Bareiss J. 2001. Surface properties and processes of perennial Antarctic sea ice in summer. Journal of Glaciology 47, 613–625. Publisher Full Text
- Hansen E., Gerland S., Granskog M.A., Pavlova O., Renner A.H.H., Haapala J., Løyning T.B. & Tschudi M. 2013. Thinning of Arctic sea ice observed in Fram Strait: 1990–2011. Journal of Geophysical Research—Oceans 118, 5202–5221. Publisher Full Text
- Holt B. & Digby S.A. 1985. Processes and imagery of first-year fast sea ice during the melt season. Journal of Geophysical Research—Oceans 90, 5045–5062. Publisher Full Text
- Hudson S.R., Granskog M.A., Sundfjord A., Randelhoff A., Renner A.H.H. & Divine D.V. 2013. Energy budget of first-year Arctic sea ice in advanced stages of melt. Geophysical Research Letters 40, 2679–2683. Publisher Full Text
- Jeffries M.O., Worby A.P., Morris K. & Weeks W.F. 1997. Seasonal variations in the properties and structural composition of sea ice and snow cover in the Bellingshausen and Amundsen seas, Antarctica. Journal of Glaciology 43, 138–151.
- Kattsov V.M., Källén E., Cattle H., Christensen J., Drange H., Hanssen-Bauer I., Jóhannesen T., Karol I., Räisänen J., Svensson G. & Vavulin S. 2005. Chapter 4. Future climate change: modeling and scenarios for the Arctic. In C. Symon, L. Arris, & B. Heal (eds.): Arctic climate impact assessment. Pp. 100–150. Cambridge: Cambridge University Press.
- Kawamura T., Ohshima K.I., Takizawa T. & Ushio S. 1997. Physical, structural, and isotopic characteristics and growth processes of fast sea ice in Lutzow-Holm Bay, Antarctica. Journal of Geophysical Research—Oceans 102, 3345–3355. Publisher Full Text
- Kawamura T., Shirasawa K., Ishikawa N., Lindfors A., Rasmus K., Granskog M.A., Ehn J., Leppäranta M., Martma T. & Vaikmë R. 2001. Time series observations of the structure and properties of brackish ice in the Gulf of Finland, the Baltic Sea. Annals of Glaciology 33, 1–4. Publisher Full Text
- Kwok R. & Rothrock D.A. 2009. Decline in Arctic sea ice thickness from submarine and ICESat records: 1958–2008. Geophysical Research Letters 36, L15501, doi: 10.1029/2009GL039035. Publisher Full Text
- Kwok R. & Untersteiner N. 2011. The thinning of Arctic sea ice. Physics Today 64, 36–41. Publisher Full Text
- Launiainen J. & Cheng B. 1998. Modelling of ice thermo-dynamics in natural water bodies. Cold Regions Science and Technology 27, 153–178. Publisher Full Text
- Laxon S.W., Giles K.A., Ridout A.L., Wingham D.J., Willatt R., Cullen R., Kwok R., Schweiger A., Zhang J., Haas C., Hendricks S., Krishfield R., Kurtz N., Farrell S. & Davidson M. 2013. CryoSat-2 estimates of Arctic sea ice thickness and volume. Geophysical Research Letters 40, 732–737. Publisher Full Text
- Leppäranta M. 1983. A growth model for black ice, snow ice and snow thickness in sub-Antarctic basins. Nordic Hydrology 14, 59–70.
- Maksym T. & Jeffries M.O. 2000. A one-dimensional percolation model of flooding and snow ice formation on Antarctic sea ice. Journal of Geophysical Research—Oceans 105, 26313–26331. Publisher Full Text
- Maksym T. & Markus T. 2008. Antarctic sea ice thickness and snow-to-ice conversion from atmospheric reanalysis and passive microwave snow depth. Journal of Geophysical Research—Oceans 113, C02S12, doi: 10.1029/2006JC004085.
- Maslanik J., Stroeve J., Fowler C. & Emery W. 2011. Distribution and trends in Arctic sea ice age through spring 2011. Geophysical Research Letters 38, L13502, doi: 10.1029/2011GL047735. Publisher Full Text
- Massom R.A., Eicken H., Haas C., Jeffries M.O., Drinkwater M.R., Sturm M., Worby A.P., Wu X., Lytle V.I., Ushio S., Morris K., Reid P.A., Warren S.G. & Allison I. 2001. Snow on Antarctic sea ice. Reviews of Geophysics 39, 413–445. Publisher Full Text
- Maykut G.A. 1982. Large-scale heat exchange and ice production in the central Arctic. Journal of Geophysical Research—Oceans 87, 7971–7984. Publisher Full Text
- Maykut G.A. & Untersteiner N. 1971. Some results from a time dependent thermodynamic model of sea ice. Journal of Geophysical Research 76, 1550–1575. Publisher Full Text
- Maykut G.A. & McPhee M.G. 1995. Solar heating of the Arctic mixed layer. Journal of Geophysical Research—Oceans 97, 24691–24703. Publisher Full Text
- Meier W.N., Hovelsrud G.K., van Oort B.E.H., Key J.R., Kovacs K.M., Michel C., Haas C., Granskog M.A., Gerland S., Perovich D.K., Makshtas A. & Reist J.D. 2014. Arctic sea ice in transformation: a review of recent observed changes and impacts on biology and human activity. Reviews of Geophysics 52, 185–217. Publisher Full Text
- Nghiem S.V., Rigor I.G., Perovich D.K., Clemente-Colón P., Weatherly J.W. & Neumann G. 2007. Rapid reduction of Arctic perennial sea ice. Geophysical Research Letters 34, L19504, doi: 10.1029/2007GL031138. Publisher Full Text
- Nicolaus M., Haas C. & Bareiss J. 2003. Observations of superimposed ice formation at melt-onset on fast ice on Kongsfjorden, Svalbard. Physics and Chemistry of the Earth 28, 1241–1248. Publisher Full Text
- Nicolaus M., Haas C., Bareiss J. & Willmes S. 2006. A model study of differences of snow thinning on Arctic and Antarctic first-year sea ice during spring and summer. Annals of Glaciology 44, 147–153. Publisher Full Text
- Nicolaus M., Kaltein C., Maslanik J. & Hendricks S. 2012. Changes in Arctic sea ice result in increasing light transmittance and absorption. Geophysical Research Letters 39, L24501, doi: 10.1029/2012GL053738. Publisher Full Text
- Øyvind N., Przybylak R., Ogilvie A.E.J. & Isaksen K. 2014. Long-term temperature trends and variability on Spitsbergen: the extended Svalbard airport temperature series, 1898–2012. Polar Research 33, article no. 21349, doi: http://dx.doi.org/10.3402/polar.v33.21349
- Palosuo E. 1963. The Gulf of Bothnia in winter (II). Freezing and ice forms. Merentutkimuslaitoksen Julkais 209. Helsinki: Finnish Institute of Marine Research.
- Pavlov A.K., Tverberg V., Ivanov B.V., Nilsen F., Falk-Petersen S. & Granskog M.A. 2013. Warming of Atlantic water in two west Spitsbergen fjords over the last century (1912–2009). Polar Research 32, article no. 11206, doi: http://dx.doi.org/10.3402/polar.v32i0.11206 Publisher Full Text
- Pavlova O., Gerland S. & Moe B. 2011. Long-term monitoring of Kongsfjorden fast ice. Paper presented at the 10th Ny-Ålesund Seminar. 25–26 October, Kjeller, Norway.
- Pedersen C.A., Roeckner E., Lüthje M. & Winther J.-G. 2009. A new sea ice albedo scheme including melt ponds for ECHAM5 general circulation model. Journal of Geophysical Research—Atmospheres 14, D08101, doi: 10.1029/2008JD010440. Publisher Full Text
- Perovich D.K. & Elder B. 2002. Estimates of ocean heat flux at SHEBA. Geophysical Research Letters 29, 1344, doi: 10.1029/2001GL014171. Publisher Full Text
- Perovich D.K., Light B., Eicken H., Jones K.F., Runciman K. & Nghiem S.V. 2007. Increasing solar heating of the Arctic Ocean and adjacent seas, 1979–2005: attribution and role in the ice-albedo feedback. Geophysical Research Letters 34, L19505, doi: 10.1029/2007GL031480. Publisher Full Text
- Polyakov I.V., Timokhov L.A., Alexeev V.A., Bacon S., Dmitrenko I.A., Fortier L., Frolov I.E., Gascard J.-C., Hansen E., Ivanov V.V., Laxon S., Mauritzen C., Perovich D.K., Shimada K., Simmons H.L., Sokolov V.T., Steele M. & Toole J. 2010. Arctic Ocean warming contributes to reduced polar ice cap. Journal of Physical Oceanography 40, 2743–2756. Publisher Full Text
- Pringle D.J., Eicken H., Trodahl H.J. & Backstrom L.G.E. 2007. Thermal conductivity of landfast Antarctic and Arctic sea ice. Journal of Geophysical Research—Oceans 112, C04017, doi: 10.1029/2006JC003641. Publisher Full Text
- Renner A.H.H., Gerland S., Haas C., Spreen G., Beckers J.F., Hansen E., Nicolaus M. & Goodwin H. 2014. Evidence of Arctic sea ice thinning from direct observations. Geophysical Research Letters 41, 5029–5036. Publisher Full Text
- Saloranta T.M. 2000. Modeling the evolution of snow, snow ice and ice in the Baltic Sea. Tellus A 52, 93–108. Publisher Full Text
- Screen J.A. & Simmonds I. 2010. The central role of diminishing sea ice in recent Arctic temperature amplification. Nature 464, 1334–1337. Publisher Full Text | PubMed Abstract
- Semmler T., Cheng B., Yang Y. & Rontu L. 2012. Snow and ice on Bear Lake (Alaska)—sensitivity experiments with two lake ice models. Tellus A 64, article no. 17339, doi: http://dx.doi.org/10.3402/tellusa.v64i0.17339 Publisher Full Text
- Shirasawa K., Leppäranta M., Saloranta T., Kawamura T., Polomoshnov A. & Surkov G. 2005. The thickness of coastal fast ice in the Sea of Okhotsk. Cold Regions Science and Technology 42, 25–40. Publisher Full Text
- Stocker T.F., Qin D., Plattner G.-K., Tignor M., Allen S.K., Boschung J., Nauels A., Xia Y., Bex V. & Midgley P.M. (eds.) 2013. Climate Change 2013. The Physical Science Basis. Contribution of Working Group I to the Fifth Assessment Report of the Intergovernmental Panel on Climate Change. Cambridge: Cambridge University Press.
- Sturm M., Holmgren J., König M. & Morris K. 1997. The thermal conductivity of seasonal snow. Journal of Glaciology 43, 26–41.
- Svendsen H., Beszczynsk-Møller A., Hagen J.O., Lefauconnier B., Tverberg V., Gerland S., Ørbæk J.B., Bischof K., Papucci C., Zajaczkowski M., Azzolini R., Bruland O., Wiencke C., Winther J.-G. & Dallmann W. 2002. The physical environment of Kongsfjorden–Krossfjorden, an Arctic fjord system in Svalbard. Polar Research 21, 133–166. Publisher Full Text
- Tverberg V., Nilsen E., Goszczko I., Cottier F., Svendsen H. & Gerland S. 2007. The warm winter temperature of 2006 and 2007 in the Kongsfjorden water masses compared to historical data. Extended abstract. In R. Azzolini (ed.): 8th Ny-Ålesund Seminar. 16–17 October 2007. Cambridge, UK. Polarnet Technical Report. Pp. 40–43. Rome: Earth and Environment Department, National Research Council.
- Vihma T., Mattila O.-P., Pirazzini R. & Johansson M.M. 2011. Spatial and temporal variability in summer snow pack in Dronning Maud Land, Antarctica. The Cryosphere 5, 187–201. Publisher Full Text
- Vihma T., Uotila J., Cheng B. & Launiainen J. 2002. Surface heat budget over the Weddell Sea: buoy results and comparisons with large-scale models. Journal of Geophysical Research—Oceans 107, 3013, doi: 10.1029/2000JC000372. Publisher Full Text
- Wang C., Shi L., Gerland S., Granskog M.A., Renner A.H.H., Li Z., Hansen E. & Martma T. 2013. Spring sea ice evolution in Rijpfjorden (80°N), Svalbard, from in-situ measurements and ice mass balance buoy (IMB) data. Annals of Glaciology 53, 253–260. Publisher Full Text
- Yang Y., Cheng B., Kourzeneva E., Semmler T., Rontu L., Leppäranta M., Shirasawa K. & Li Z. 2013. Modelling experiments on air–snow–ice interactions over Kilpisjärvi, a lake in northern Finland. Boreal Environment Research 18, 341–358.
- Yang Y., Leppäranta M., Cheng B. & Li Z. 2012. Numerical modelling of snow and ice thicknesses in Lake Vanajavesi, Finland. Tellus A 64, article no. 17202, doi: http://dx.doi.org/10.3402/tellusa.v64i0.17202 Publisher Full Text
- Ye H., Cohen J. & Rawlines M. 2013. Discrimination of solid from liquid precipitation over Northern Eurasia using surface atmospheric condition. Journal of Hydrometeorology 14, 1345–1355. Publisher Full Text
- Zhuravskiy D., Ivanov B. & Pavlov A. 2012. Ice conditions at Gronfjorden Bay, Svalbard, from 1974 to 2008. Polar Geography 35, 169–176. Publisher Full Text