Эта статья опубликована под лицензией Creative Commons и не автором статьи. Поэтому если вы найдете какие-либо неточности, вы можете исправить их, обновив статью.

Patterns of interdisciplinary collaboration resemble biogeochemical relationships in the McMurdo Dry Valleys, Antarctica: a historical social network analysis of science, 1907–2016


Stephen M. Chignell
Adrian Howkins
Poppie Gullett
Andrew G. Fountain
Опубликована Июнь 4, 2022
Последнее обновление статьи Июль 26, 2023
Эта статья опубликована под лицензией
")


Abstract
Co-authorship networks can provide key insights into the production of scientific knowledge. This is particularly interesting in Antarctica, where most human activity relates to scientific research. Bibliometric studies of Antarctic science have provided a useful understanding of international and interdisciplinary collaboration, yet most research has focused on broad-scale analyses over recent time periods. Here, we take advantage of a ‘Goldilocks’ opportunity in the McMurdo Dry Valleys, an internationally important region of Antarctica and the largest ice-free region on the continent. The McMurdo Dry Valleys have attracted continuous and diverse scientific activity since 1958. It is a geographically confined region with limited access, making it possible to evaluate the influence of specific events and individuals. We trace the history of environmental science in this region using bibliometrics and social network analysis. Our results show a marked shift in focus from the geosciences to the biosciences, which mirrors wider trends in the history of science. Collaboration among individuals and academic disciplines increased through time, and the most productive scientists in the network are also the most interdisciplinary. Patterns of collaboration among disciplines resemble the biogeochemical relationships among respective landscape features, raising interesting questions about the role of the material environment in the development of scientific networks in the region, and the dynamic interaction with socio-cultural and political factors. Our focused, historical approach adds nuance to broad-scale bibliometric studies and could be applied to understanding the dynamics of scientific research in other regions of Antarctica and elsewhere.
Ключевые слова
History of science, visual network analysis, scientometrics, environmental history, Critical physical geography, science and technology studies
Introduction
Scientific research is a social process (Ben-David & Sullivan 1975; Latour & Woolgar 1979; Turnhout et al. 2019; Sismondo 2010), and collaboration in modern science appears to be one of the key factors affecting publication productivity and quality (Ferligoj et al. 2015). Understanding the forces that drive collaboration has important implications for how scientific research is funded, conducted and disseminated (Adams 2012; Ma et al. 2015; Fortunato et al. 2018). One popular method of studying scientific collaboration is through co-authorship networks, whereby each author is represented by a network node and when two scientists co-author a paper together, a tie is drawn to represent the collaboration between them (Glänzel & Schubert 2004; Adams 2012; Uddin et al. 2012). Statistical examination of these networks has been used to understand collaboration patterns within and across specific disciplines (Newman 2001b, 2004; Fonseca e Fonseca et al. 2016), academic institutions (Cummings & Kiesler 2005; Bellanca 2009), and geographic and national boundaries (Luukkonen et al. 1992; Gaskó et al. 2016; Leifeld & Ingold 2016). Longitudinal network studies have also provided insights into the evolution of collaborative communities through time (Barabási et al. 2002; Brunson et al. 2014; Ferligoj et al. 2015) and how they organize in response to external forces (Ma et al. 2015).
Collaboration is an important theme in the history of Antarctic science (Summerhayes 2008; Erb 2011; Walton et al. 2011). Political and logistical cooperation lay at the heart of the Antarctic Treaty System, and the need to understand complex environmental systems encourages interdisciplinary collaboration among scientists (O’Reilly 2017; Antonello 2019). It is, therefore, surprising that few studies of the collaboration dynamics among scientific disciplines working in the southern continent have been done. Rather, bibliometric studies of Antarctic science have primarily focused on international collaboration at the continental scale (Dastidar 2007; Dastidar & Ramachandran 2008; Aksnes & Hessen 2009; Ji et al. 2014; Kim & Jung 2016; Jang et al. 2020). Each of these studies covers a recent 20–30-year period, usually back to the 1990s, with the earliest date being 1980. However, Antarctic science extends back to the early 20th century, and in some cases even earlier (see Fogg 1992), and much was previously classified or published in out-of-print journals and grey literature not indexed in online databases like the Web of Science (Dastidar & Ramachandran 2008). Thus, while useful, broad-scale bibliometric analyses relying solely on digital databases may miss important dynamics in the development of Antarctic collaboration networks. For example, Jang et al. (2020) examined changes in scientific disciplines and international co-authorship from 1998 to 2015 through an SNA of peer-reviewed journals. Among other results, they found that the number of publications steadily increased over time, that Antarctic research is dominated by Earth and related environmental sciences and the biological sciences, and that these disciplines have followed similar patterns in the development of their networks. This suggests that the recent history of Antarctic research follows a straightforward, linear trend, with steadily increasing numbers of publications and collaborative ties. However, without earlier bibliometric data, it is impossible to determine whether these trends are continuations of historical trends or, in fact, recent developments. Moreover, such continental-scale analyses are often unable to adequately capture regional- and local-scale patterns, which may differ considerably. Recognizing this, Jang et al. (2020: 14) call for research on the dynamics of international collaboration in specific geographic regions of Antarctica, asking, for example, “In the McMurdo region, are the Americans, New Zealanders and Italians working together more than with other international colleagues?”
In this study, we answer this call by conducting an in-depth bibliometric SNA of the history of scientific collaboration in the MDV. At approximately 4500 km2, the MDV comprise the largest ice-free area in Antarctica (Levy 2013). The region was first reached in December 1903 (Scott 1905) and explored further in February 1911 (Scott 1913; Taylor 1914, 1922). Since the International Geophysical Year of 1957–58, scientists have worked in the MDV every summer as well as for three winter seasons. This 60-year period includes investigations of past activity of the Antarctic ice sheet (Denton et al. 1969; Hall & Denton 2000), plate tectonics (Hamilton 1967; Fitzgerald 1992), microbial ecosystems (Hogg et al. 2006; Van Horn et al. 2013; Herbei et al. 2016) and geomorphic change (Marchant & Head 2007; Bockheim & McLeod 2013; Fountain et al. 2014), among other topics. Projects range in size, from individuals or small teams to ‘big science’ projects with large groups of international collaborating researchers. An early example of big science was the geology-focused DVDP, initiated in 1971 (McGinnis et al. 1972). The DVDP brought together experienced MDV scientists and newcomers to the region, including researchers from Japan, NZ, and the US. The unique environment of the MDV and their accessibility to nearby research stations have helped make the region an internationally important location for field-based environmental research. The MDV’s combination of a well-defined region with limited access and a history of vigorous activity provides a ‘Goldilocks’ scenario for tracing the development of scientific collaborations and research themes through time. Although the MDV is claimed by NZ as part of its assertion of sovereignty over the larger Ross Dependency region, MDV science is international in character. Still, only a few nations have conducted significant research in the region, and the number of disciplines is diverse but relatively small. The variety of political, international and scientific conditions governing research in the MDV are large enough to be of broader interest but not so overwhelming that it becomes impossible to interpret. Importantly, the three-volume Bibliography of international Dry Valley publications, produced by the New Zealand Antarctic Division between 1978 and 1995, allows for a bibliometric analysis to be extended much further back in time than analyses based exclusively on modern scientific databases would allow (Mead 1978; Antarctic Division 1985; New Zealand Antarctic Programme 1995).
Focusing on the MDV allows us to take advantage of the region’s limited physical extent, relatively long history of scientific activity and data availability for a network-based study of scientific collaboration. In particular, the MDV offer an opportunity to take the analysis further back in time to the very start of human activity in the region. A historical approach to SNA allows us to study how international and interdisciplinary networks change in response to changes in the social, political and material environments. Historical research can also offer important contributions for contemporary scientific research (Russell 1998; Szabó 2010), including in Antarctica (Howkins 2014, 2016), and some historians are using network techniques as powerful complements to traditional historical analyses (Grandjean 2017, 2018; Painter et al. 2019; Robertson & Mullen 2021). We draw on these approaches to answer the following research questions. (1) What is the output (as measured in publications) and disciplinary composition of MDV research and how has this changed over time? (2) What are the scientific research communities in the MDV and how have they developed? (3) Does collaboration among individuals or disciplines increase concomitantly with scientific output? (4) Do collaborations cross disciplines and national research programmes?
In examining these questions, we make no claim that collaboration networks in the MDV are representative of Antarctica as a whole. Rather, we suggest that looking in detail at this particular region can offer useful and nuanced insights for thinking about the history of science in Antarctica more generally.
Methods
Research design
We combined standard techniques from quantitative SNA (e.g., degree, centrality and density metrics) with recent approaches from visual network analysis (Decuypere 2019; Jaspersen & Stein 2019; Gamper & Schönhuth 2020; Venturini et al. 2021). Visual network analysis has evolved in recent years as network scholars have shifted attention away from small graphs with diagrammatic visualizations (interpreted by following paths between individual nodes) toward larger graphs with topological visualizations (interpreted by detecting spatial patterns; Grandjean & Jacomy 2019; Venturini et al. 2021). Although a heterogeneous and evolving research area, visual network analysis often relies on the use of force-directed layout algorithms, which simulate a physical system by ‘charging’ nodes with a repulsive force and ties with an attractive force (Noack 2009; Jacomy et al. 2014; Venturini et al. 2021). When the simulation is run, the push and pull of the forces rearrange the position of the nodes based on the strength of their ties. When the forces reach equilibrium, the result is a spatialized network graph, with nodes that are more closely related positioned more closely together (Gamper & Schönhuth 2020; Venturini et al. 2021). These graphs can highlight the positions of key individuals as well as reveal polarization (stretched shapes) and clustering (density of nodes) within and between communities (Grandjean & Jacomy 2019; Venturini et al. 2021). Recognizing the limitations of reducing the ‘messiness’ of large networks to the metrics of SNA, visual network analysis seeks to preserve the inherent ambiguity in large data sets. In doing so, it encourages analysts to explore the full network data set dynamically from different perspectives, modifying parameters of the layout algorithms and interpreting the subsequent changes to the network structure (Venturini et al. 2021). These and other so-called ‘quali-quantitative’ approaches (Venturini 2012; Munk 2019) do not aim to replace quantitative structural network analysis, but rather focus on “developing the link between mathematical properties of networks and the stories they evoke” (Venturini et al. 2017: 2–3). In adapting these methods, we began with the four main steps in the quantitative analysis of scientific co-authorship networks outlined by Fonseca e Fonseca et al. (2016): (1) retrieve scientific publications; (2) standardize author names and metadata; (3) visualize network graphs and calculate metrics; and (4) interpret results. Drawing on visual network analysis, we repeated steps 3 and 4, exploring various bibliometric trends and force-directed network visualizations. This was an iterative process of constructing the networks, discussing their spatial patterns, and adjusting the parameters of the layout and clustering algorithms.
Bibliographic data
Between 1978 and 1995, the NZ Antarctic Program published three volumes of the Bibliography of international Dry Valley publications (Mead 1978; Antarctic Division 1985; New Zealand Antarctic Programme 1995). These include all mainstream academic literature (e.g., journal articles, books and conference proceedings) as well as grey literature (e.g., theses/dissertations, institute reports and unindexed journal articles) published between 1959 and 1994. We acquired paper copies of these volumes and digitized all references (n = 1569) and their associated attributes (e.g., author name and publication year). The original bibliography organized the references by academic disciplines, which varied slightly among the three volumes. To improve consistency, we reduced the number of academic disciplines from 17 to 14 by folding sub-disciplines into their respective overarching disciplines (e.g., geochronology into geology and microbiology into biology/ecology). We kept the category “general” from the NZ bibliography as one of our 14 disciplines, which includes studies of the MDV as a whole, reports on field seasons and other subjects that are not easily classifiable into a traditional scientific discipline.
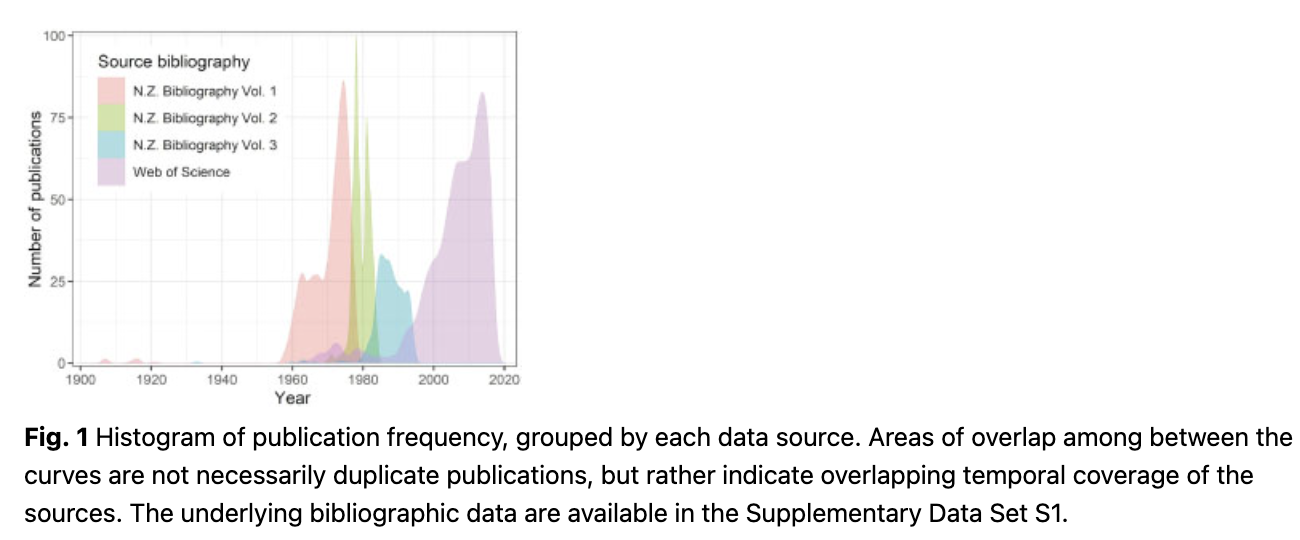
To supplement and update the NZ bibliography, we searched the Web of Science Core Collection (accessed 25 July 2017) for MDV-related publications. The search was constrained to the years 1900–2016 and by Web of Science “Topic” (TS), which searches the title, abstract and keywords of all indexed references in the database. We used the following query: (TS=(“MDV”) OR TS=(“Taylor Dry Valley”) OR TS=(“Wright Dry Valley”) OR TS=(“Victoria Dry Valley”) OR TS=(“Taylor Valley”) OR TS=(“Wright Valley”) OR TS=(“Victoria Valley”) OR TS=(Dry Valley*) OR TS=(Ice-free Valley*)) AND TS=(Antarctica). The search returned 1257 results. We identified and removed duplicates between the published bibliography and the Web of Science results (n = 84), and standardized author names using OpenRefine software (Ham 2013). This resulted in a final set of references (N = 2742), which we used for all subsequent analyses (Fig. 1). Approximately 80% of the references were journal articles; the data set also included 137 book chapters, 136 proceedings papers, 94 reports and 62 theses/dissertations, among other publication formats (Supplementary Table S1). About 98% of the papers were in English, 1% in Japanese and the remaining 1% split among five other languages (Supplementary Table S2). The Web of Science references included the attributes “Subject Category” and “Web of Science Category,” which both give an indication of academic discipline. To make these categories compatible with those from the published bibliography, we reclassified each Web of Science publication as one of the 14 academic disciplines from the NZ bibliography. This was a subjective process, with the primary determining factor being the landscape component of interest in the study (e.g., glaciers and lakes). If multiple landscape components were the focus of the study, then we assigned a discipline based on the primary scientific approach taken by the authors. For example, a study of stream chemistry of a stream flowing on a glacier would be considered glaciology; chemistry of a stream flowing on the valley floor would be considered hydrology; and if it was a comparison of chemistries across soils, lakes, streams and glaciers, it would be classified as geochemistry.
Network construction
We used Gephi software (Bastian et al. 2009) to create two types of networks: co-authorship (authors connected to other authors) and author–discipline (authors connected to academic disciplines). In this article, we use the term ‘author’ when discussing the networks ‘scientist’ when discussing individuals and their research. To construct the co-authorship network, we drew a tie between authors when two or more scientists were listed as authors of a publication. We assigned tie weights based on the number of times each pair of authors published together. To construct the author–discipline network, we drew a tie between the author and the scientific discipline of the work and assigned tie weights based on the number of times the author published in a given discipline.
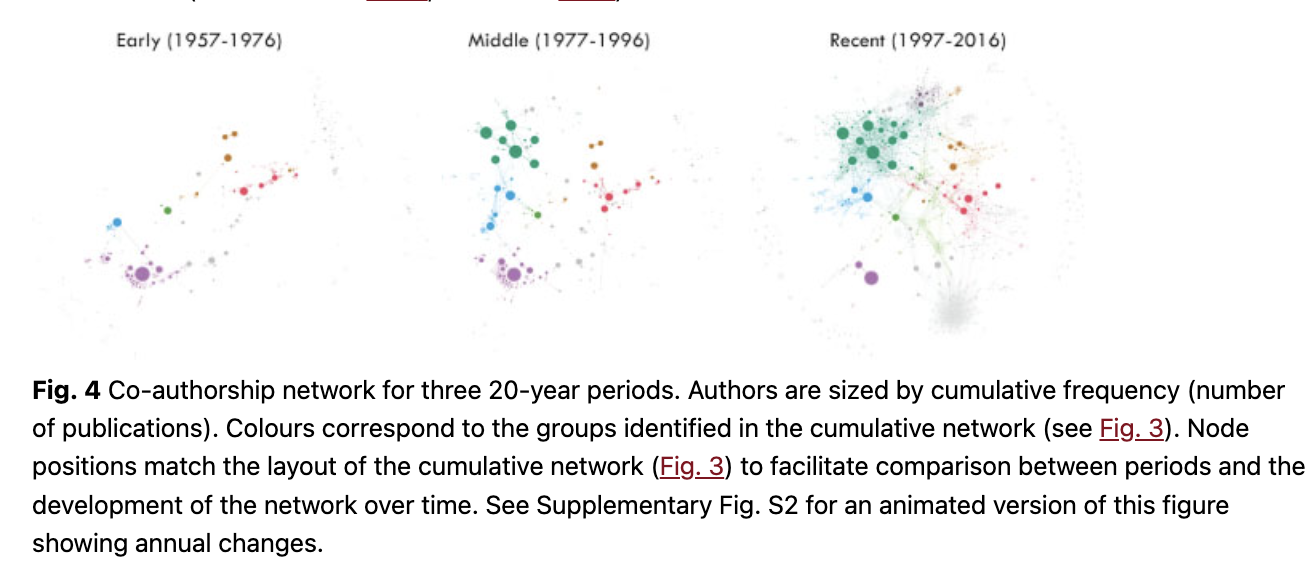
For both types of networks, we used the cumulative data set of all bibliographic references (1900–2016). For each author in the co-authorship network, we computed a series of network statistics at the network and author scale. These included various degree, centrality and network diameter metrics as well as a modularity algorithm for identifying communities (see the supplementary material for descriptions and references for each metric used). In our initial exploration of publication frequency over time, we noticed three major breaks in the data, occurring approximately 20 years apart (Fig. 2). These correspond to changes in scientific activity in the region (discussed below) and provided useful bounds for analysing network changes over time. We, therefore, subset the full data set into three 20-year periods: early (1957–1976), middle (1977–1996) and recent (1997–2016). To capture both short- and long-term temporal changes in the network, we computed the same set of statistics for each period as well as each individual year (post-1957; Barabási et al. 2002).

Network visualization
Many approaches exist for visualizing network graphs, but we focused on circular and force-directed layouts. Circular layouts arrange nodes in a circle, with their respective ties drawn across the interior of the circle. We used this layout to visualize the evolution of the author–discipline network. In doing so, we transformed the two-mode author–discipline network into a one-mode network using the Multimode Networks plugin for Gephi (Kuchař & Codina 2018), so that the authors themselves represent the ties among disciplines. In contrast to circular layouts, force-directed layouts position nodes relative to each other, with the distance between nodes representing a measure of connectedness. The shorter the distance between nodes, the greater the connectedness (Jacomy et al. 2014). This improves legibility by minimizing line crossings (Venturini et al. 2019) and allows the user to filter the input data and immediately visualize changes in the network. We used Force Atlas 2 (Jacomy et al. 2014), a continuous, force-directed layout that reorganizes the structure of the nodes in response to real time adjustments. This creates an interactivity that is crucial for exploring the evolution of associations through time (Bounegru et al. 2017).
Results
Bibliometric trends
The bibliometric results turn up only a handful of publications from the early ‘Heroic Era’ of Antarctic exploration in the first two decades of the 20th century (Howkins 2016) and show that major research activity did not start until after the International Geophysical Year of 1957–58 (Fig. 2). Two peaks in publication activity are evident. The first is in the 1970s, driven in large part by the geological sciences (geology, geophysics, geochemistry and palaeontology) and to a lesser degree by the water and ice sciences (limnology, hydrology, glaciology). This initial peak was followed by a 20-year decline in publication frequency until the late 1990s, when the trend again turned upward. This led to the second peak in the 2010s, driven by the biological and hydrological sciences and to a lesser degree the geological sciences.
Co-authorship network
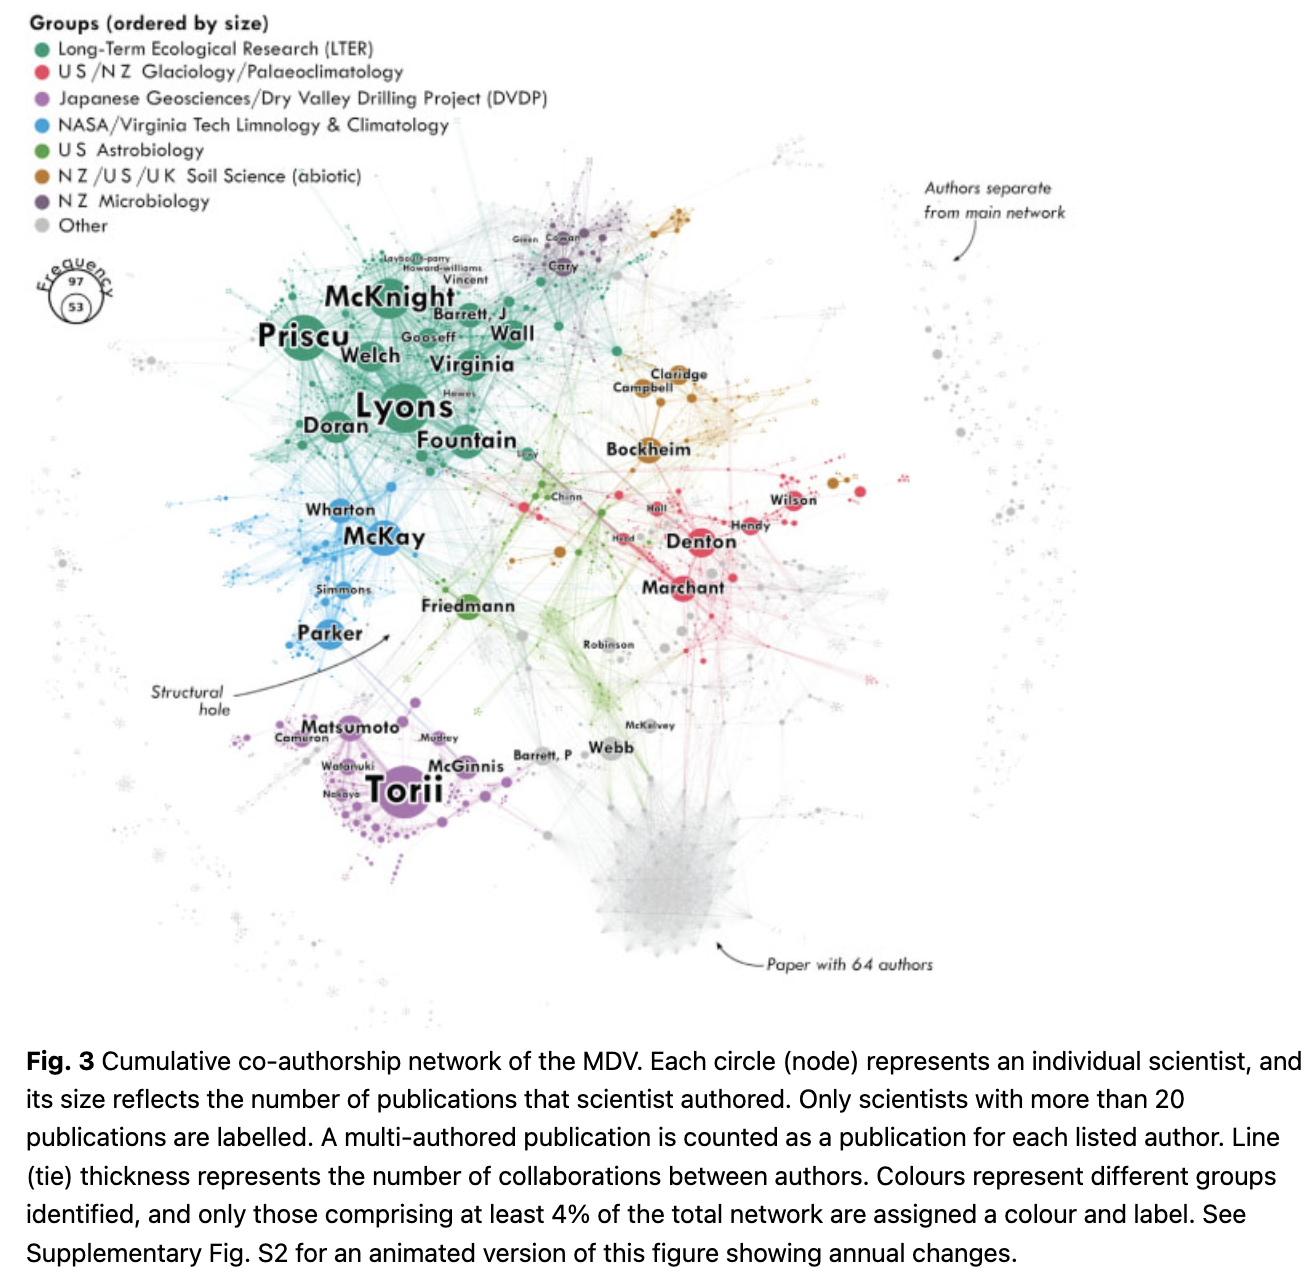
The co-authorship network comprised 3083 authors with 13 612 collaborative ties over the cumulative study period. We identified seven main research communities (hereafter, “groups”) based on the modularity analysis, many of which approximate real-world research projects, academic institutions or national programmes (Fig. 3). One of the more conspicuous (yet unlabelled) groups represents the community formed through a single article with 64 authors (Wilson et al. 2012). The gaps between groups represent areas of weak connection, or ‘structural holes,’ in the network (Burt 2004, 2009). In this conception, researchers on either side of a structural hole tend to think and publish in different flows of information, which, in turn, creates a competitive advantage for individuals whose relations span those holes (Burt 2004, 2017). Indeed, in the MDV, we see several scientists acting as bridges across structural holes by forming collaborative ties that connect different parts of the network. For example, Joe Levy, who studies the geomorphic and hydrologic effects of melting permafrost, connects the glaciologists in the MDV LTER with the palaeoclimatology group. E. Imre Friedmann, an expert on cryptoendoliths (organisms living in rocks), is located between the limnologists and planetary geologists. Other scientists lie outside the main network, representing individuals with no collaborative ties to the primary research groups (‘isolates,’ in network terminology).
Cumulatively, each scientist was a co-author on an average of 2.8 publications, and this ratio remained fairly stable throughout MDV science history (Table 1). The mean degree (number of ties per author) was 8.8 and increased through each of the periods (2.9, 3.8 and 10.6, respectively). The number of authors per year gradually increased through the early period as the network was forming, decreased in the middle period, and then began increasing again at the start of the recent period (Fig. 7b). This growth accelerated over the following two decades, with nearly 400 unique authors in 2016 alone—a nearly tenfold increase from the 43 authors in 1996.
Table 1 Statistics for the three 20-year periods and the cumulative co-authorship networks. | |||||
Network statistic | Early | Middle | Recent | Cumulative |
|
1957–1976 | 1977–1996 | 1997–2016 | 1907–2016 |
| |
Number of publications | 772 | 850 | 1111 | 2742 |
|
(% increase from previous period) | – | 10.1 | 30.7 | – |
|
Number of authors | 482 | 610 | 2246 | 3083 |
|
Mean frequency (number of publications) per author | 3.0 | 3.1 | 2.3 | 2.8 |
|
Degree (number of ties) | 692 | 1165 | 11 946 | 13 612 |
|
Mean degree | 2.9 | 3.8 | 10.6 | 8.8 |
|
Mean weighted degree | 5.8 | 6.5 | 13.7 | 12.1 |
|
Network diameter | 12 | 14 | 13 | 14 |
|
Mean path length | 4.4 | 5.4 | 4.1 | 4.5 |
|
Graph density | 0.006 | 0.006 | 0.005 | 0.003 |
|
Modularity | 0.84 | 0.83 | 0.80 | 0.81 |
|
Number of communities | 146 | 142 | 116 | 302 |
|
Connected components | 138 | 130 | 99 | 280 |
|
Mean clustering coefficient | 0.79 | 0.82 | 0.87 | 0.85 |
|
Total triangles | 574 | 1373 | 69 705 | 71 679 |
|
Giant component (authors) | 202 | 352 | 1814 | 2344 |
|
Giant component (authors %) | 41.9 | 57.7 | 80.8 | 76 |
|
Giant component (ties) | 466 | 950 | 10 952 | 12 445 |
|
Giant component (ties %) | 67.3 | 81.6 | 91.7 | 91 |
|
The evolution of the co-authorship groups shows that the early period consisted of distinct research groups with limited interaction (Fig. 4, Supplementary Fig. S2). These were primarily scientists from NZ and Japan as well as numerous isolates from the US and UK. The middle period saw the addition of new groups including the LTER as well as new ties between existing groups. NASA activity increased while the Japanese and soils research activity remained relatively constant. The recent period shows continued growth of the network, with a rapid increase in ties among groups; the LTER comprises a large part of this growth, and the group of NZ microbiologists appeared. Japanese activity thinned considerably until its complete disappearance in 2005. The recent period also shows the rapid growth of a giant component (a well-connected super-group forming the core of the network) as well as increasing numbers of ties, triangles and clustering. These patterns are indicative of ‘preferential attachment,’ a common process in the development of co-authorship networks, whereby new authors tend to enter the network via well-established authors (Barabási & Albert 1999; Newman 2001a). As a result, the number of isolated groups decreases as individuals cluster into larger, more connected communities (Barabási et al. 2002; Mali et al. 2012).
Although the number of ties in the giant component nearly doubled between the early and middle periods, this number increased by more than 11-fold between the middle and recent periods (Table 1). This contrasts with a concomitant linear increase in weighted degree (Fig. 7b), a measure of connectivity based on the number of ties as well as their weights (repeated collaborations between authors). These trends indicate that the addition of new authors and collaborations occurred alongside the maturation of existing relationships. The fact that these changes occurred without a marked increase in network diameter (the greatest distance between two nodes) shows the network’s rapid evolution into a ‘small world’ structure. Small world networks have distinct clusters connected to each other by a small number of ties (Mali et al. 2012) and are understood to be a crucial property of functioning scientific communities (Newman 2001b).
Author–discipline network
Cumulatively, geology was the most published discipline (602), followed by limnology (419) and biology/ecology (416). The spatial arrangement of the author–discipline network shows a variety of local-scale relations nested within the macro-level network structure (Fig. 5). At the coarsest level, a clear distinction exists between abiotic and biotic disciplines, which occupy the left and right sides of the network, respectively. These are connected by the disciplines of hydrology and general studies, located near the centre. Other disciplines have stronger connections within the biotic or abiotic halves, such as conservation, which sits among the biotic disciplines but has relatively little connection to geology or geophysics. The disciplines of oceanography, palaeontology and cartography are less prominent and lie on the periphery of the network. At the finer scale, the vast majority of discipline-specific scientists lie on the periphery of the network, having published only one or two publications. Meanwhile, scientists who have co-authored papers in multiple disciplines (more than two ties) are located near the centre. Interestingly, this interdisciplinary space contains nearly all the most published scientists in the network. The exceptions are the disciplines of hydrology and general studies, which are so interdisciplinary that they pull their less-published scientists into the centre.

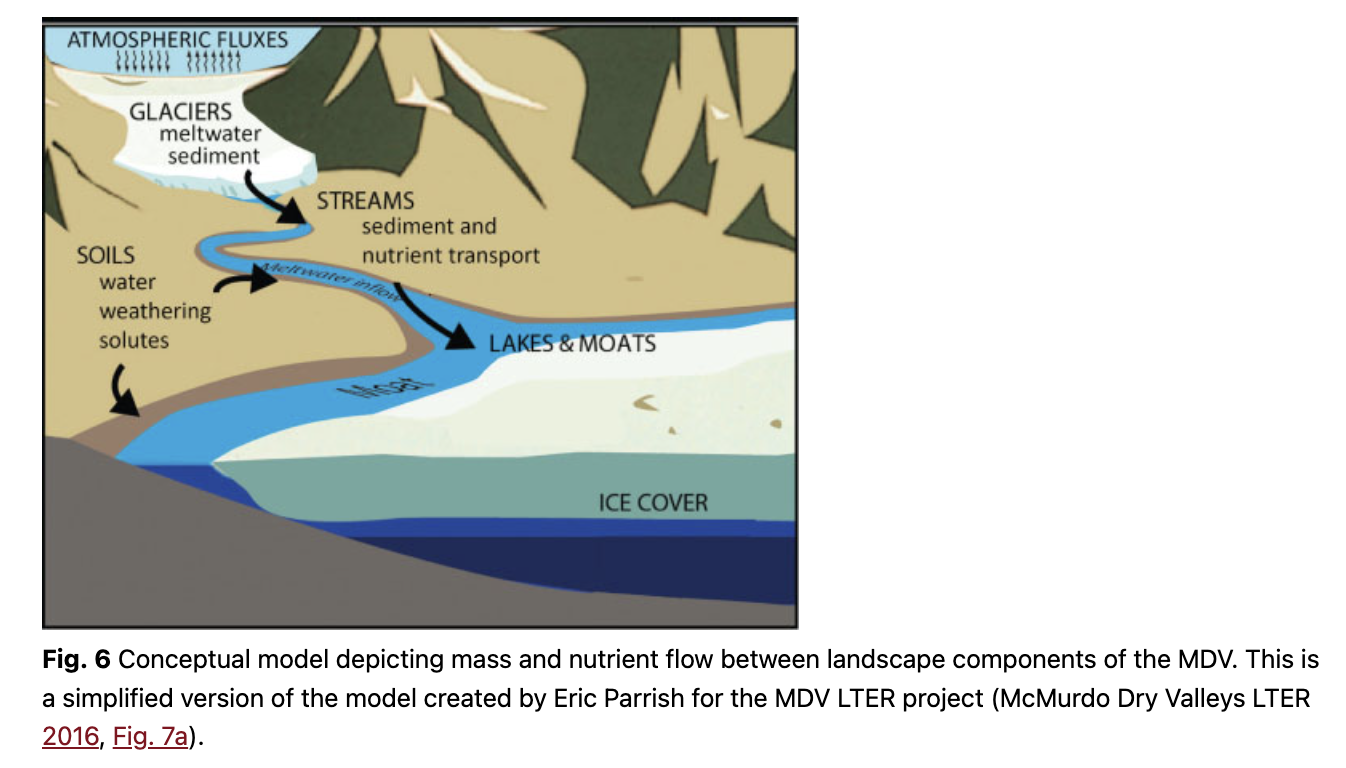
It is interesting to observe that the collaborative relationships among academic disciplines (Fig. 5) resemble the physical relationships among real-world landscape components in the MDV. For example, oceanography lies at the periphery of the network, much like the McMurdo Sound at the terminus of each of the valleys. Geology interfaces closely with glaciology, similar to how glaciers move rock from valley walls. Geochemists are integrated with limnologists, just as rock and organic material is suspended or dissolved in the lakes. Hydrology sits near the middle of the network, reflecting the connecting role that streams play in transporting sediment and nutrients between landscape components of the MDV (Fig. 6).
Over time, author–discipline relationships show increasing interdisciplinary ties (Fig. 7a). However, the strength and longevity of these relationships differ by discipline. During the early period, geology dominated in both number of publications and ties to other disciplines, particularly limnology and glaciology. Geology and the other geosciences remained important during the middle period, alongside considerable increases in publications in the biological sciences. The middle period also saw the development of strong ties between geochemistry, limnology and biology/ecology. During the recent period, geology’s activity (number of publications and ties) decreased significantly, with the biological sciences overtaking the geosciences as the most active disciplines. Our data suggest that this change is driven in part by the dramatic increase in soil science (primarily soil ecology) but may also have been the result of organizational changes within the international scientific community in Antarctica and the availability of funding. Both the number and weight of ties increased in the recent period, indicating increased interdisciplinary collaborations. The tie between biology/ecology and soil science, which was nearly absent in the prior periods, now rivals any in strength. Glaciology maintained strong ties with geology throughout the entire study period while simultaneously becoming more connected to the biosciences. Hydrology played a minor role until the recent period, during which time it became the most central discipline.

Discussion
Our local-scale analysis of MDV science raises questions about the limitations of bibliometric and SNA research while drawing attention to patterns that may be missed at a broader scale. For example, our results suggest that, from a historical point of view, the question asked by Jang et al. (2020) about collaboration among Americans, New Zealanders and Italians might actually be better asked about collaboration among Americans, New Zealanders and Japanese. The Japanese geochemist Tetsuya Torii was the most published researcher in the cumulative MDV network (Supplementary Table S3), yet without the historical data, the contributions by Torii and others from the Japanese group would have been largely missed. Another interesting example is the observation by Jang et al. (2020) that Earth and environmental sciences show similar growth patterns as biological sciences in their collaboration networks at the continental scale. Our case study in the MDV not only shows similar trends over the same period but also shows that these trends emerged from a previous 20-year decline in publications, following the peak of geophysical research in the 1980s. This underscores that different time periods reflect different research contexts, and the importance of a historical approach for situating more recent trends.
Another example of the importance of incorporating different temporal scales into the SNA comes from our observation that the collaborative relationships among academic disciplines resemble the physical relationships among material landscape components in the MDV (Figs. 5, 6). Looking at the cumulative network and the most recent 20-year period, this pattern might be interpreted as the scientific network organizing itself around a pre-existing set of ‘natural’ relations among the features of the material landscape (i.e., biogeochemical connectivity). However, the early and middle 20-year periods show very different relationships among scientists and disciplines (Fig. 7a). As noted, the first 40 years were dominated by the geosciences, which, at the time, adopted a less integrative approach, whereas the last 20-year period has seen the ascendancy of ecological sciences, which embrace a more ‘systems’ approach. If the current collaboration network resembles a highly connected system, it might be due to the recent dominance of the ecological sciences and their current understanding of the landscape. If the geological sciences were to regain their earlier prominence, it is likely that the structure of the collaboration network would look quite different to the way it does today.
However we choose to interpret these patterns; they highlight the need for an integrative approach that incorporates deep knowledge of biophysical systems with close attention to socio-political factors and histories of the sciences. The shift in emphasis from geosciences to the biosciences that followed the conclusion of the DVDP, for example, cannot be explained by a single cause. It is also important to remember that the MDV environment itself is constantly changing, and at least some of this change is caused by the scientific activities taking place in the region, for example, field camp construction and associated activities, drilling equipment and boreholes, human trampling and vehicle tracks, and the installation of weirs on streams (Ayres et al. 2008; O’Neill et al. 2013; Priscu & Howkins 2016; Sakaeva et al. 2016). Thus, the social network of MDV science—and indeed, Antarctic science more broadly—is inherently dynamic as it continually shapes and is shaped by dynamic biophysical processes. Future work examining the recursive relationship between the material environment and the scientific study of it could focus on rereading the network data alongside interviews, archival sources and fieldwork.
The emerging field of critical physical geography offers a potential framework for conducting such work (Lave et al. 2018; Biermann et al. 2021). Critical physical geography focuses on developing integrative theoretical explanations of the material and social forces shaping hybrid landscapes in conjunction with research into the experiences, practices and politics within the environmental sciences (Tadaki 2020). Through a mixed-method and reflexive approach that considers the role of researchers’ social embeddedness and values, critical physical geographers seek to “pick up the conceptual and methodological gauntlet thrown down by the Anthropocene” (Biermann et al. 2020: 1). In other words, an approach informed by critical physical geography would acknowledge that both the scientists and the material environment of the MDV are “already tangled in political, social, and economic relations” (Lave 2015: 573), and that the science being conducted in the region has itself always been an eco-social hybrid (Ashmore 2015; King & Tadaki 2018; Lave et al. 2018; Howkins et al. 2021).
The ideas motivating critical physical geography and related approaches resonate with recent efforts to combine quantitative and qualitative perspectives in SNA, many of which we have drawn on in this article. While quantitative SNA approaches produce valuable insights into network structure, on their own, they cannot fully reveal underlying motivations and social forces that drive collaboration (Hayat & Lyons 2017). Qualitative data collection and analysis can support quantitative SNA by drawing on network members’ own narratives to provide context for structural patterns, yielding a deeper understanding of the cultural dynamics of social networks (Stoddart & Tindall 2010; Bellotti 2016). Combining structural analysis with interviews can reveal mechanisms that guide the evolution of scientific research communities (Hayat & Lyons 2017) and help identify emergent themes in the network data (Bellotti 2016). Recent work in digital humanities and science and technology studies pushes this integration further, arguing that networks themselves can possess narrative qualities (Ryan 2004), and demonstrates how network visualizations can help in the construction of narratives (Bounegru et al. 2017; Venturini et al. 2017; Decuypere 2019). While our analysis relied primarily on quali-quantitative analysis of bibliometric data, further integration with qualitative data could provide new empirical insights into the history of scientific collaboration in Antarctica and elsewhere.
Conclusions
We traced the history of science in the MDV by integrating bibliometric and social network analyses. While we observed some continuities, we found that over the past six decades, growth in scientific output from the MDV has been non-linear, with major fluctuations in both the annual number of publications and disciplinary composition. We observed an overall shift in focus from the geosciences to the biosciences, which occurred alongside a shift toward ecology and more integrative systems approaches of the last 20 years. Over time, collaboration among individuals and academic disciplines increased, and the most productive and central scientists in the network also tended to be the most interdisciplinary. Many of these individuals work with one or more research groups outside the ones they are professionally associated with, revealing collaborative structures that belie straightforward organizational boundaries and correspond to global trends toward internationalization in science. Interestingly, collaborative relationships among academic disciplines resemble biogeochemical relationships among landscape components of the MDV. While the reasons for this are unclear and deserve future study, it, nevertheless, offers a useful reminder that the physical environment plays a role in shaping the scientific network at the same time as science shapes the physical environment.
Although this study focused on a single region, it is in dialogue with wider conversations about the history of science in Antarctica and scientific collaboration. Our results show how an in-depth historical approach complements and complicates continental-scale analyses, and they highlight the need to taking into account of what is happening at local scales. Conducting similar case studies in other parts of Antarctica would show whether our findings are consistent across the continent or unique to the MDV. Such studies may benefit, as we have, from searching archives and print bibliographies, which often contain rich information that extend the temporal and publication coverage well beyond what is available in online bibliographic databases.
Acknowledgements
The authors sincerely appreciate the helpful comments from two anonymous reviewers. The authors are also grateful to Kelly Hopping, Tyler Kukla, David Tindall and members of the MDV LTER for their thoughtful feedback on early versions of the manuscript.
References
- Adams J. 2012. The rise of research networks: collaborations. Nature 490, 335–336, doi: 10.1038/490335a.
- Aksnes D.W. & Hessen D.O. 2009. The structure and development of polar research (1981–2007): a publication-based approach. Arctic, Antarctic, and Alpine Research 41, 155–163, doi: 10.1657/1938-4246-41.2.155.
- Antarctic Division. 1985. Bibliography of international Dry Valley publications vol. 2, 1978-1984. Christchurch: Antarctic Division, Department of Scientific and Industrial Research.
- Antonello A. 2019. The greening of Antarctica: assembling an international environment. Oxford: Oxford University Press.
- Ashmore P. 2015. Towards a sociogeomorphology of rivers. Geomorphology 251, 149–156, doi: 10.1016/j.geomorph.2015.02.020.
- Ayres E., Nkem J.N., Wall D.H., Adams B.J., Barrett J.E., Broos E.J., Parsons A.N., Powers L.E., Simmons B.L. & Virginia R.A. 2008. Effects of human trampling on populations of soil fauna in the Mcmurdo Dry Valleys, Antarctica. Conservation Biology 22, 1544–1551, doi: 10.1111/j.1523-1739.2008.01034.x.
- Barabási A.-L. & Albert R. 1999. Emergence of scaling in random networks. Science 286, 509–512, doi: 10.1126/science.286.5439.509.
- Barabási A.-L., Jeong H., Néda Z., Ravasz E., Schubert A. & Vicsek T. 2002. Evolution of the social network of scientific collaborations. Physica A 311, 590–614, doi: 10.1016/S0378-4371(02)00736-7.
- Bastian M., Heymann S. & Jacomy M. 2009. Gephi: an open source software for exploring and manipulating networks. In: Proceedings of the International AAAI Conference on Web and Social Media 3. Pp. 361–362. Palo Alto, CA: Association for the Advancement of Artificial Intelligence.
- Bellanca L. 2009. Measuring interdisciplinary research: analysis of co-authorship for research staff at the University of York. Bioscience Horizons 2, 99–112, doi: 10.1093/biohorizons/hzp012.
- Bellotti E. 2016. Qualitative methods and visualizations in the study of friendship networks. Sociological Research Online 21, article no. 2, doi: 10.5153/sro.3936.
- Ben-David J. & Sullivan T.A. 1975. Sociology of science. Annual Review of Sociology 1, 203–222, doi: 10.1146/annurev.so.01.080175.001223.
- Biermann C., Kelley L.C. & Lave R. 2020. Putting the Anthropocene into practice: methodological implications. Annals of the American Association of Geographers 111, 808–818, doi: 10.1080/24694452.2020.1835456.
- Biermann C., Lane S.N. & Lave R. 2021. Critical physical geography: in pursuit of integrative and transformative approaches to resource dynamics. In M. Himley et al. (eds.): The Routledge handbook of critical resource geography. Pp. 225–235. Abingdon, UK: Routledge.
- Bockheim J.G. & McLeod M. 2013. Glacial geomorphology of the Victoria Valley System, Ross Sea region, Antarctica. Geomorphology 193, 14–24, doi: 10.1016/j.geomorph.2013.03.020.
- Bounegru L., Venturini T., Gray J. & Jacomy M. 2017. Narrating networks. Digital Journalism 5, 699–730, doi: 10.1080/21670811.2016.1186497.
- Brunson J.C., Fassino S., McInnes A., Narayan M., Richardson B., Franck C., Ion P. & Laubenbacher R. 2014. Evolutionary events in a mathematical sciences research collaboration network. Scientometrics 99, 973–998, doi: 10.1007/s11192-013-1209-z.
- Burt R.S. 2004. Structural holes and good ideas. American Journal of Sociology 110, 349–399, doi: 10.1086/421787.
- Burt R.S. 2009. Structural holes: the social structure of competition. Cambridge, MA: Harvard University Press.
- Burt R.S. 2017. Structural holes versus network closure as social capital. In N. Lin et al. (eds.): Social capital: theory and research. Pp. 31–56. Abingdon, UK: Routledge.
- Cummings J.N. & Kiesler S. 2005. Collaborative research across disciplinary and organizational boundaries. Social Studies of Science 35, 703–722, doi. 10.1177/0306312705055535.
- Dastidar P. & Ramachandran S. 2008. Intellectual structure of Antarctic science: a 25-years analysis. Scientometrics 77, 389–414, doi: 10.1007/s11192-007-1947-x.
- Dastidar P.G. 2007. National and institutional productivity and collaboration in Antarctic science: an analysis of 25 years of journal publications (1980-2004). Polar Research 26, 175–180, doi: 10.1111/j.1751-8369.2007.00017.x.
- Decuypere M. 2019. Visual network analysis: a qualitative method for researching sociomaterial practice. Qualitative Research 20, 73–90, doi: 10.1177/1468794118816613.
- Denton G.H., Armstrong R.L. & Stuiver M. 1969. Histoire glaciaire et chronologié de la région du Détroit de McMurdo, sud de la Terre Victoria, Antarctide—note préliminaire. (Glacial history and chronology of the region of McMurdo Sound, southern Victoria Land, Antarctica—preliminary note.) Revue de Géographie Physique et de Géologie Dynamique 2, 265–278.
- Erb K.A. 2011. International collaboration in the Antarctic for global science. In P.A. Berkman et al. (eds.): Science diplomacy: science, Antarctica, and the governance of international spaces. Pp. 265–270. Washington, DC: Smithsonian Institution Scholarly Press.
- Ferligoj A., Kronegger L., Mali F., Snijders T.A.B. & Doreian P. 2015. Scientific collaboration dynamics in a national scientific system. Scientometrics 104, 985–1012, doi: 10.1007/s11192-015-1585-7.
- Fitzgerald P.G. 1992. The Transantarctic Mountains of southern Victoria Land: the application of apatite fission track analysis to a rift shoulder uplift. Tectonics 11, 634–662, doi: 10.1029/91TC02495.
- Fogg G.E. 1992. A history of Antarctic science. Cambridge: Cambridge University Press.
- Fonseca e Fonseca B.D.P., Sampaio R.B., de Araujo Fonseca M.V. & Zicker F. 2016. Co-authorship network analysis in health research: method and potential use. Health Research Policy and Systems 14, article no. 34, doi: 10.1186/s12961-016-0104-5.
- Fortunato S., Bergstrom C.T., Börner K., Evans J.A., Helbing D., Milojević S., Petersen A.M., Radicchi F., Sinatra R., Uzzi B., Vespignani A., Waltman L., Wang D. & Barabási A.-L. 2018. Science of science. Science 359, eaao0185, doi: 10.1126/science.aao0185.
- Fountain A.G., Levy J.S., Gooseff M.N. & Van Horn D. 2014. The McMurdo Dry Valleys: a landscape on the threshold of change. Geomorphology 225, 25–35, doi: 10.1016/j.geomorph.2014.03.044.
- Gamper M. & Schönhuth M. 2020. Visual network research (VNR)—a theoretical and methodological appraisal of an evolving field. Visual Studies 35, 374–393, doi: 10.1080/1472586X.2020.1808524.
- Gaskó N., Lung R.I. & Suciu M.A. 2016. A new network model for the study of scientific collaborations: Romanian computer science and mathematics co-authorship networks. Scientometrics 108, 613–632, doi: 10.1007/s11192-016-1968-4.
- Glänzel W. & Schubert A. 2004. Analysing scientific networks through co-authorship. In H.F. Moed et al. (eds.): Handbook of quantitative science and technology research. Pp. 257–276. Berlin: Springer.
- Grandjean M. 2017. Multimode and multilevel: vertical dimension in historical and literary networks. Digital Humanities 2017, halshs-01525539v2f. Accessed on the internet at https://halshs.archives-ouvertes.fr/halshs-01525539/document on 16 March 2018.
- Grandjean M. 2018. Les isuali de la isualizati intellectuelle. La Société des Nations comme actrice des échanges scientifiques et culturels dans l’entre-deux-guerres. (Intellectual cooperation networks. The League of Nations as an actor in scientific and cultural exchanges in the interwar period.) PhD thesis, Université de Lausanne. Accessed on the internet at https://tel.archives-ouvertes.fr/tel-01853903/document on 19 February 2019.
- Grandjean M. & Jacomy M. 2019. Translating networks: assessing correspondence between network visualization and analytics. Digital Humanities 2019. Accessed on the internet at https://halshs.archives-ouvertes.fr/halshs-02179024 on 26 August 2021.
- Hall B.L. & Denton G.H. 2000. Extent and chronology of the Ross Sea ice sheet and the Wilson Piedmont glacier along the Scott Coast at and since the last glacial maximum. Geografiska Annaler Series A 82, 337–363, doi: 10.1111/j.0435-3676.2000.00128.x.
- Ham K. 2013. OpenRefine (version 2.5). http://openrefine.org. Free, open-source tool for cleaning and transforming data. Journal of the Medical Library Association 101, 233–234, doi: 10.3163/1536-5050.101.3.020.
- Hamilton W. 1967. Tectonics of Antarctica. Tectonophysics 4, 555–568, doi: 10.1016/0040-1951(67)90019-4.
- Hayat T. & Lyons K. 2017. A typology of collaborative research networks. Online Information Review 41, 155–170, doi: 10.1108/OIR-11-2015-0368.
- Herbei R., Rytel A.L., Lyons W.B., McKnight D.M., Jaros C., Gooseff M.N. & Priscu J.C. 2016. Hydrological controls on ecosystem dynamics in Lake Fryxell, Antarctica. PLoS One 11, e0159038, doi: 10.1371/journal.pone.0159038.
- Hogg I.D., Craig Cary S., Convey P., Newsham K.K., O’Donnell A.G., Adams B.J., Aislabie J., Frati F., Stevens M.I. & Wall D.H. 2006. Biotic interactions in Antarctic terrestrial ecosystems: are they a factor? Soil Biology and Biochemistry 38, 3035–3040, doi: 10.1016/j.soilbio.2006.04.026.
- Howkins A. 2014. Experiments in the Anthropocene: climate change and history in the Mcmurdo Dry Valleys, Antarctica. Environmental History 19, 294–302.
- Howkins A. 2016. Taylor’s valley: what the history of Antarctica’s ‘Heroic Era’ can contribute to contemporary ecological research in the Mcmurdo Dry Valleys. Environment and History 22, 3–28, doi: 10.3197/096734016X14497391602125.
- Howkins A., Chignell S. & Fountain A. 2021. Vanda Station, Antarctica: a biography of the Anthropocene. Journal of the British Academy 9, Suppl. Issue 6, 61–89, doi: 10.5871/jba/009s6.061.
- Jacomy M., Venturini T., Heymann S. & Bastian M. 2014. ForceAtlas2, a continuous graph layout algorithm for handy network visualization designed for the Gephi software. PLoS One 9, e98679, doi: 10.1371/journal.pone.0098679.
- Jang D., Doh S. & Choi Y. 2020. Networks of international co-authorship in journal articles about Antarctic research, 1998–2015. Polar Research, 39, article no. 3647, doi: 10.33265/polar.v39.3647.
- Jaspersen L.J. & Stein C. 2019. Beyond the matrix: visual methods for qualitative network research. British Journal of Management 30, 748–763, doi: 10.1111/1467-8551.12339.
- Ji Q., Pang X. & Zhao X. 2014. A bibliometric analysis of research on Antarctica during 1993–2012. Scientometrics 101, 1925–1939, doi: 10.1007/s11192-014-1332-5.
- Kim H. & Jung W.-S. 2016. Bibliometric analysis of collaboration network and the role of research station in Antarctic science. Industrial Engineering and Management Systems 15, 92–98, doi: 10.7232/iems.2016.15.1.092.
- King L. & Tadaki M. 2018. A framework for understanding the politics of science (core tenet #2). In R. Lave et al. (eds.): The Palgrave handbook of critical physical geography. Pp. 67–88. Cham, Switzerland: Springer.
- Kuchař J. & Codina J. 2018. Multimode networks. Plugin for Gephi. Java. Accessed on the internet at https://github.com/jaroslav-kuchar/Multimode-Networks on 4 March 2018.
- Latour B. & Woolgar S. 1979. Laboratory life: the social construction of scientific facts. Beverly Hills, CA: Sage Publications.
- Lave R. 2015. Introduction to special issue on critical physical geography. Progress in Physical Geography: Earth and Environment 39, 571–575, doi: 10.1177/0309133315608006.
- Lave R., Biermann C. & Lane S.N. 2018. Introducing critical physical geography. In R. Lave et al. (eds.): The Palgrave handbook of critical physical geography. Pp. 3–21. Cham, Switzerland: Springer.
- Leifeld P. & Ingold K. 2016. Co-authorship networks in Swiss political research. Swiss Political Science Review 22, 264–287, doi: 10.1111/spsr.12193.
- Levy J. 2013. How big are the McMurdo Dry Valleys? Estimating ice-free area using Landsat image data. Antarctic Science 25, 119–120, doi: 10.1017/S0954102012000727.
- Luukkonen T., Persson O. & Sivertsen G. 1992. Understanding patterns of international scientific collaboration. Science, Technology, & Human Values 17, 101–126, doi: 10.1177/016224399201700106.
- Ma A., Mondragón R.J. & Latora V. 2015. Anatomy of funded research in science. Proceedings of the National Academy of Sciences of the United States of America 112, 14760–14765, doi: 10.1073/pnas.1513651112.
- Mali F., Kronegger L., Doreian P. & Ferligoj A. 2012. Dynamic scientific co-authorship networks. In A. Scharnhorst et al. (eds.): Models of science dynamics: encounters between complexity theory and information sciences. Pp. 195–232. Berlin: Springer.
- Marchant D.R. & Head J.W. 2007. Antarctic Dry Valleys: microclimate zonation, variable geomorphic processes, and implications for assessing climate change on Mars. Icarus 192, 187–222, doi: 10.1016/j.icarus.2007.06.018.
- McGinnis L.D., Torii T. & Webb P.N. 1972. Dry Valley Drilling Project: three nations are studying the subsurface in the McMurdo Sound region. Antarctic Journal of the United States 7, 53–56.
- McMurdo Dry Valleys LTER. 2016. LTER: ecosystem response to amplified landscape connectivity in the McMurdo Dry Valleys, Antarctica. Project summary. McMurdo Dry Valleys LTER. Accessed on the internet https://mcm.lternet.edu/research/mcm-lter-research-proposals on 5 March 2022.
- Mead K.L. 1978. Bibliography of international Dry Valley publications, 1907-1977. Christchurch: Antarctic Division, Department of Scientific and Industrial Research.
- Munk A.K. 2019. Four styles of quali-quantitative analysis: making sense of the new Nordic food movement on the web. Nordicom Review 40, 159–176, doi: 10.2478/nor-2019-0020.
- Newman M.E.J. 2001a. Clustering and preferential attachment in growing networks. Physical Review E 64, 025102, doi: 10.1103/PhysRevE.64.025102.
- Newman M.E.J. 2001b. The structure of scientific collaboration networks. Proceedings of the National Academy of Sciences of the United States of America 98, 404–409, doi: 10.1073/pnas.98.2.404.
- Newman M.E.J. 2004. Coauthorship networks and patterns of scientific collaboration. Proceedings of the National Academy of Sciences of the United States of America 101, 5200–5205, doi: 10.1073/pnas.0307545100.
- New Zealand Antarctic Programme 1995. Bibliography of international Dry Valley publications. Vol. 3, 1985-1994. Christchurch: New Zealand Antarctic Programme.
- Noack A. 2009. Modularity clustering is force-directed layout. Physical Review E 79, article no. 026102, doi: 10.1103/PhysRevE.79.026102.
- O’Neill T.A., Balks M.R. & López-Martínez J. 2013. Visual recovery of desert pavement surfaces following impacts from vehicle and foot traffic in the Ross Sea region of Antarctica. Antarctic Science 25, 514–530, doi: 10.1017/S0954102012001125.
- O’Reilly J. 2017. The technocratic Antarctic: an ethnography of scientific expertise and environmental governance. Ithaca, NY: Cornell University Press.
- Painter D.T., Daniels B.C. & Jost J. 2019. Network analysis for the digital humanities: principles, problems, extensions. Isis 110, 538–554, doi: 10.1086/705532.
- Priscu J.C. & Howkins A. 2016. Environmental assessment of the McMurdo Dry Valleys: witness to the past and guide to the future. Report of an NSF Workshop. Colorado State University. 2–3 May 2016. Special publication LRES-PRG 02. Bozeman, MT: Department of Land Resources and Environmental Sciences, College of Agriculture, Montana State University.
- R Core Team 2018. R: a language and environment for statistical computing. Vienna: R Foundation for Statistical Computing.
- Robertson S. & Mullen L. 2021. Arguing with digital history: patterns of historical interpretation. Journal of Social History 54, 1005–1022, doi: 10.1093/jsh/shab015.
- Russell E.W.B. 1998. People and the land through time: linking ecology and history. New Haven, CT: Yale University Press.
- Ryan M.-L. 2004. Narrative across media: the languages of storytelling. Lincoln, NE: University of Nebraska Press.
- Sakaeva A., Sokol E.R., Kohler T.J., Stanish L.F., Spaulding S.A., Howkins A., Welch K.A., Lyons W.B., Barrett J.E. & McKnight D.M. 2016. Evidence for dispersal and habitat controls on pond diatom communities from the McMurdo Sound Region of Antarctica. Polar Biology 39, 2441–2456, doi: 10.1007/s00300-016-1901-6.
- Scott R.F. 1905. The voyage of ‘Discovery’. London: MacMillan & Co.
- Scott R.F. 1913. Scott’s last Expedition: being the journals of Captain R.F. Scott, R.N., C.V.O. London: Smith Elder and Company.
- Sismondo S. 2010. An introduction to science and technology studies. 2nd edn. Chichester: Wiley-Blackwell.
- Stoddart M.C.J. & Tindall D.B. 2010. ‘We’ve also become quite good friends’: environmentalists, social networks and social comparison in British Columbia, Canada. Social Movement Studies 9, 253–271, doi: 10.1080/14742837.2010.493658.
- Summerhayes C.P. 2008. International collaboration in Antarctica: the International Polar Years, the International Geophysical Year, and the Scientific Committee on Antarctic Research. Polar Record 44, 321–334, doi: 10.1017/S0032247408007468.
- Szabó P. 2010. Why history matters in ecology: an interdisciplinary perspective. Environmental Conservation 37, 380–387, doi: 10.1017/S0376892910000718.
- Tadaki M. 2020. Critical physical geography. In A. Kobayashi (ed.): International encyclopedia of human geography. 2nd edn. Pp. 51–54. Oxford: Elsevier.
- Taylor T.G. 1914. Physiography and glacial geology of East Antarctica. The Geographical Journal 44, 365–382, doi: 10.2307/1778593.
- Taylor T.G. 1922. The physiography of the McMurdo sound and Granite Harbour region. London: Harrison and Sons.
- Turnhout E., Tuinstra W. & Halffman W. 2019. Environmental expertise: connecting science, policy and society. Cambridge: Cambridge University Press.
- Uddin S., Hossain L., Abbasi A. & Rasmussen K. 2012. Trend and efficiency analysis of co-authorship network. Scientometrics 90, 687–699, doi: 10.1007/s11192-011-0511-x.
- Van Horn D.J., Van Horn M.L., Barrett J.E., Gooseff M.N., Altrichter A.E., Geyer K.M., Zeglin L.H. & Takacs-Vesbach C.D. 2013. Factors controlling soil microbial biomass and bacterial diversity and community composition in a cold desert ecosystem: role of geographic scale. PLoS One 8, e66103, doi: 10.1371/journal.pone.0066103.
- Venturini T. 2012. Great expectations: méthodes quali-quantitative et analyse des réseaux sociaux. (Great expectations: qualitative-quantitative methods and social network analysis.) In J.-P. Fourmentraux (ed.): L’Ère post-media. Humanités digitales et cultures numériques. (The post-media era. Digital humanities and digital cultures.) Pp. 39–51. Paris: Hermann.
- Venturini T., Bounegru L., Jacomy M. & Gray J. 2017. How to tell stories with networks exploring the narrative affordances of graphs with the Iliad. In M.T. Schäfer & K. van Es (eds.): The datafied society: studying culture through data. Pp. 155–170. Amsterdam: Amsterdam University Press.
- Venturini T., Jacomy M. & Jensen P. 2021. What do we see when we look at networks: visual network analysis, relational ambiguity, and force-directed layouts. Big Data & Society 8, article no. 20539517211018488, doi: 10.1177/20539517211018488.
- Venturini T., Munk A.K. & Jacomy M. 2019. Actor–network versus network analysis versus digital networks are we talking about the same networks? In J. Vertesi & D. Ribes (eds.): DigitalSTS: a field guide for science & technology studies. Pp. 510–523. Princeton, NJ: Princeton University Press.
- Walton D.W.H., Clarkson P.D. & Summerhayes C.P. (eds.) 2011. Science in the snow: fifty years of international collaboration through the Scientific Committee on Antarctic Research. Cambridge, UK: Scientific Committee on Antarctic Research.
- Wilson G.S., Levy R.H., Naish T.R., Powell R.D., Florindo F., Ohneiser C., Sagnotti L., Winter D.M., Cody R., Henrys S., Ross J., Krissek L., Niessen F., Pompillio M., Scherer R., Alloway B.V., Barrett P.J., Brachfeld S., Browne G., Carter L., Cowan E., Crampton J., DeConto R.M., Dunbar G., Dunbar N., Dunbar R., von Eynatten H., Gebhardt C., Giorgetti G., Graham I., Hannah M., Hansaraj D., Harwood D.M., Hinnov L., Jarrard R.D., Joseph L., Kominz M., Kuhn G., Kyle P., Läufer A., McIntosh W.C., McKay R., Maffioli P., Magens D., Millan C., Monien D., Morin R., Paulsen T., Persico D., Pollard D., Raine J.I., Riesselman C., Sandroni S., Schmitt D., Sjunneskog C., Strong C.P., Talarico F., Taviani M., Villa G., Vogel S., Wilch T., Williams T., Wilson T.J. & Wise S. 2012. Neogene tectonic and climatic evolution of the Western Ross Sea, Antarctica—chronology of events from the AND-1B drill hole. Global and Planetary Change 96–97, 189–203, doi: 10.1016/j.gloplacha.2012.05.019.
Похожие статьи
Anna M. Gielas