Эта статья опубликована под лицензией Creative Commons и не автором статьи. Поэтому если вы найдете какие-либо неточности, вы можете исправить их, обновив статью.

Supplying drinking water to rural households through trickle fill and decentralized cisterns


Aaron Janzen
Gopal Achari
Samantha Irwin
Mohammed Dore
Опубликована Март 31, 2022
Последнее обновление статьи Авг. 22, 2022
Эта статья опубликована под лицензией
")


Abstract
Many rural households do not have access to treated drinking water. However, some households may be in regions where a water treatment plant has excess capacity to supply some additional households. In such circumstances, small diameter low-pressure supply systems can be connected to major transmission lines to give these households access to water. These typically occur in locations that do not belong to recognized municipal or other local government. Such supply systems, commonly referred to as “trickle fill,” have been implemented in South America, Africa and Canada. This paper explains the concept of trickle fill supply systems. A user-friendly decision-making framework is proposed to assist the decision maker to determine whether the implementation of a trickle fill system is economically feasible for a given rural area. The decision-making assessment template (DMAT) takes into projects the economic, energy and carbon footprint changes. A case study for a rural municipality in the province of Alberta, Canada is presented to illustrate the value of the DMAT and the feasibility of trickle fill water supply as a solution. In this case study, a trickle fill water supply solution is found to be technically and economically viable and would reduce energy consumption and the carbon footprint. It is shown that trickle fill solution can be implemented, resulting in an average cost of water to be $165 per month per household. This is higher than the affordability threshold of 2% of the median household income, but comparable to the cost that the end users currently pay for drinking water in the area. A capital grant from a higher level of government, or low interest rate financing, would reduce the end user costs to the level of the affordability criterion mentioned here. Hence, a trickle fill solution is worth investigating for some rural residents.
Ключевые слова
Small diameter water distribution pipelines., Rural water systems; economic feasibility; carbon footprint
INTRODUCTION
Small water systems dominate rural areas across North America. According to the US EPA (2012), 94% of the 156,000 public water systems in the US are small water systems. In Canada, the proportion of small systems in one survey was over 75% (Environment Canada, 2004). These small systems are either municipalities (towns, villages and hamlets) or rural areas with lower density non-municipal type developments. Rural areas are often supplied water through agricultural or residential water cooperatives.
Small water municipal drinking water systems face special challenges as they have a smaller tax base. This often requires provincial or federal government financial supports through grants or low interest loans. Water cooperatives in rural areas lack direct access to a tax base and so have additional challenges. In Canada, many small systems, both municipal and rural, continue to encounter boil water advisories and even disease outbreaks (Dore, 2015). Hundreds of drinking water advisories are put in place every year across Canada, and the majority of them are issued for systems that serve 500 people or less (Environment and Climate Change Canada, 2018).
With appropriate public funding, many of these problems could be reduced or eliminated. However, typically in North America, each small community must cover its own capital and operating costs of their drinking water supply, although some jurisdictions offer a subsidy for capital costs. Often, a rural community has a small population, lower average income and consequently a lower tax base. These financial constraints as well as other risk factors were highlighted at a 2004 conference on small water systems (Ford et al., 2005).
Some households may be in locations where a water treatment plant has excess capacity to supply additional connections. In such circumstances, small diameter low-pressure supply systems can be connected to major trunk lines to give these households access to water. These typically occur in locations that do not belong to recognized municipal or other local government. A possible solution is to have small diameter low-pressure supply system coupled with decentralized cisterns at the households. Such supply systems called “trickle fill,” have been implemented in South America, in the Pacific islands and also in the province of Alberta, Canada. Trickle fill allows rural households to benefit from the economies of scale of the larger regional water treatment plant while providing a solution to the cost challenges of providing full treatment and traditional municipal style distribution system found in small, rural and First Nation systems.
The word “regionalization” refers to small communities connecting to a nearby larger regional system via a transmission line instead of investing in their own small stand-alone drinking water treatment plants. Regionalization might require upgrades to increase the capacity of the larger regional treatment plant, but adding some additional users are usually possible as the plant capacity is based on the maximum user demand that only occurs a few days in the year, typically in high summer. Regional transmission lines carry the water to the individual communities’ treated water storage reservoirs.
Each community maintains their own existing distribution piping to supply water to their customers.
When transmission lines run past an area with existing rural residential households, it is often feasible to connect to households. In this case, instead of a municipal style service connection, a low-pressure, small diameter or “trickle fill” pipe can be attached so that treated water is delivered to individual customer’s cisterns at each rural property. This method of meeting additional demand is the focus of this paper.
Rural municipalities, new or existing water co-operatives, First Nation communities and private water providers seeking alternatives to their existing water supplies are the primary potential candidates. This applies especially to households that currently truck water in from a distance, or those whose water wells contain high metals (fluoride, arsenic) or otherwise contaminated and not suitable for drinking water.
In this paper, a user-friendly, low-cost decision-making system is proposed to help decision makers assess the economic and technical feasibility of a trickle fill solution for a community, or a group of households. The system, which is presented as a user-friendly Decision-Making Assessment Template (DMAT) is incorporated in a standard spreadsheet application, and can be easily replicated by a community. Hence the DMAT itself is low-cost and requires minimal training; it is available free of charge to potential users.
THE TRICKLE FILL CONCEPT
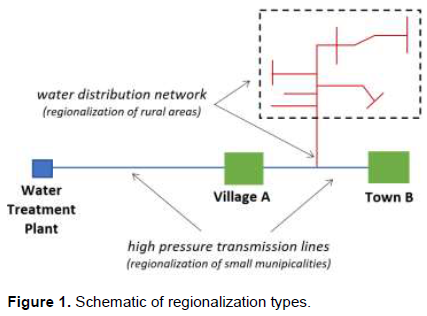
Rural water supply can be subdivided into two distinct types. One type is where water supply is brought to a small municipality, such as a village or a hamlet, via a regional high pressure transmission line. In this traditional form, small communities connect to a nearby larger regional system instead of investing in their own small stand-alone drinking water treatment plants (Alberta Transportation, 2017). Expansion requires upgrades to a single larger regional treatment plant, which becomes the hub. Then regional transmission lines carry the water to the individual communities’ treated water storage reservoirs. Each community maintains its existing distribution piping to supply water to their customers.
The second type of rural water supply is “trickle fill”, where regional water supply is brought from a transmission line to decentralized cisterns located at the rural homes and institutional/commercial customers in a low population density area via low-pressure, small diameter distribution piping (Figure 1). Trickle fill systems often are built in areas where traditional regional transmission lines exist and are within a reasonable proximity to the area intended to be served.
Examples of trickle fill implementation
Drinking water trickle fill systems have been implemented in many places throughout the province of Alberta, Canada. In approximately 20% (15 out of 72) of the rural counties and districts in Alberta, residents have connected to regional systems by implementing the trickle fill design (Roulston, 2017; Alberta Municipal Affairs, 2017; AUMA, 2018). This trend demonstrates that the trickle fill solution is technically feasible in rural areas, and indicates there is potential for social acceptance of it in the province. It also suggests that there is an existing knowledge base regarding its development and operation.
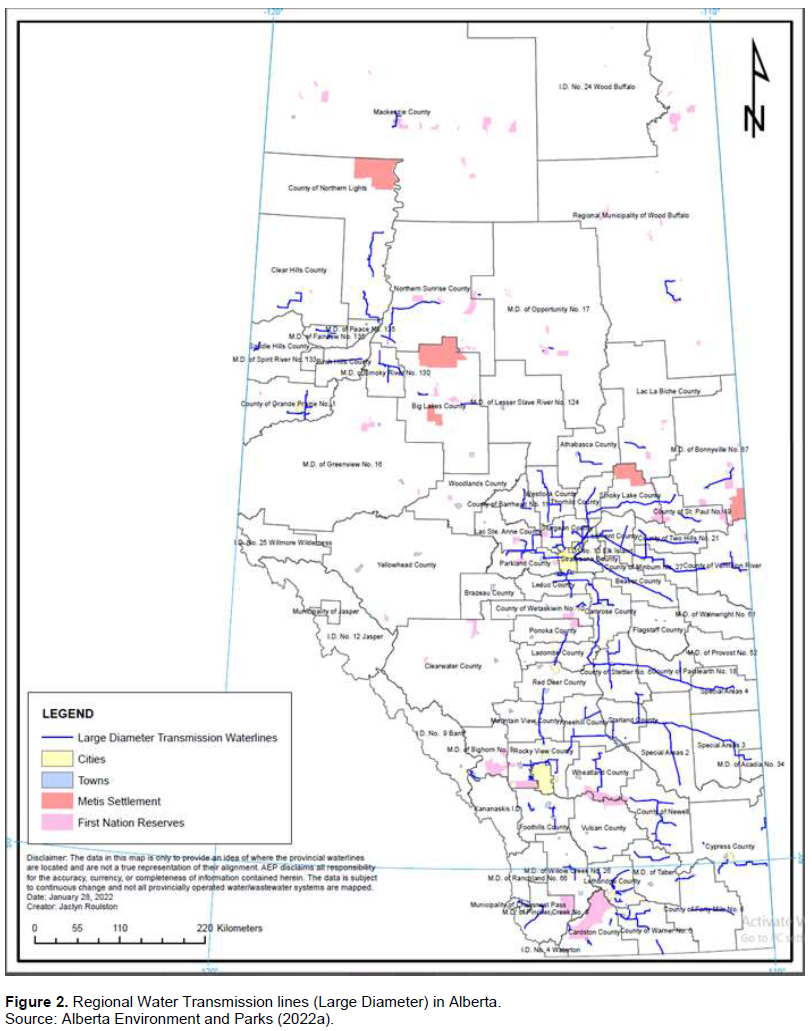
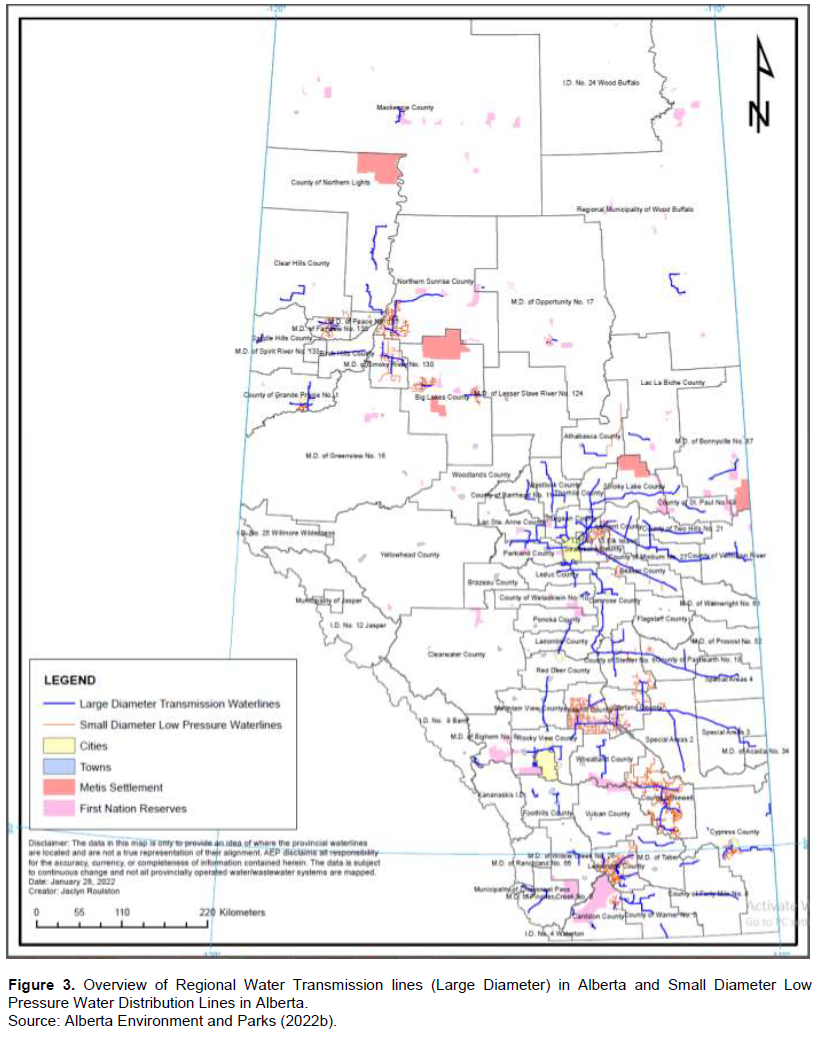
Figure 2 illustrates the extent of regional water transmission lines. On a provincial map, trickle fill system piping looks like a grid or hub-and-spoke. Figure 3 shows the extent of trickle fill water lines in addition to the regional transmission lines.
There are examples of trickle fill systems elsewhere in Canada as well. The Carlsbad Trickle Fill System supplies an institutional/commercial development in Ottawa, Ontario (Infrastructure Policy Group, 2014). There is a pair of pipeline associations that use trickle fill water supply in Saskatchewan: Melfort Rural Pipeline Association and the Coteau Hills Pipeline Association (University of Saskatchewan, SK Association for Rural Water Pipelines and PFRA, Agriculture and Agri-Food Canada, 2002). Outside of Canada, there are reports of trickle fill systems being constructed in South America, starting in the early 1970s, and in the South Pacific island country of Kiribati in the early 2000s (Albetis and Lenehan 2003). South Africa also has examples of trickle fill systems in use (Scott and Tipping, 2001).
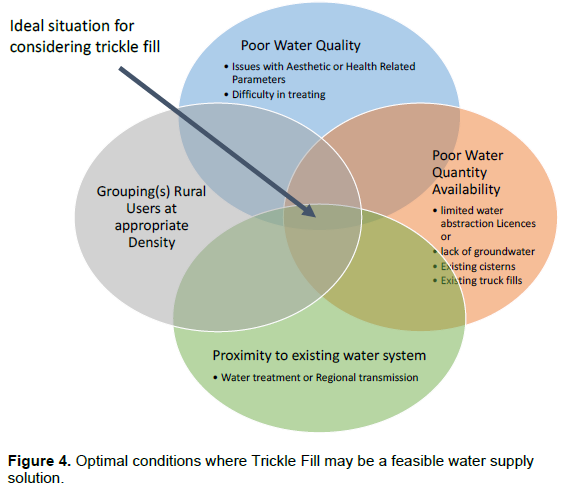
Past practice and the successful implementation of trickle fill in Alberta over the last decade indicates that there are some circumstances when trickle fill solution is suitable. Based on the authors’ analysis and field knowledge of current completed projects, Figure 4 indicates factors that influence whether trickle fill would be a feasible option for a rural service area. Past experience suggests that a cluster of water users located within 50 km from a transmission line could consider a trickle fill solution, provided the terrain gradient is appropriate. Greater distances may require a transmission line with a larger diameter pipe and/or higher pressure followed by additional reservoirs.
Those considering trickle fill systems can benefit from the experience of previous projects. Unfortunately, the published literature on this subject is limited. Project outcome or synopsis reports are not available to the public, making it more difficult for potential proponents to be aware of the solution or know how to determine if it would be the right fit for them. Hence, the decision-making template developed in this paper would help those considering the use of trickle fill.
METHODOLOGY: DECISION-MAKING TEMPLATE FOR ASSESSING TRICKLE FILL
The Decision-Making Assessment Template (DMAT) is focused on assessing the feasibility of trickle fill systems. The DMAT takes a multi-disciplinary approach by incorporating three main aspects of analysis, which are (a) economic feasibility, (b) energy requirements, and (c) environmental impacts, which includes the change in the carbon footprint. For potential users of this DMAT, a more detailed explanation on how the template was developed and how it can be used to analyze the feasibility of applying the Trickle Fill solution can be accessed via the University of Calgary’s manuscript vault (Irwin, 2018) (https://prism.ucalgary.ca/handle/1880/109762). Thus, this DMAT is being made publicly available at no cost for potential users.
The DMAT is intended to be used at an early stage of project development to help screen for potentially viable trickle fill opportunities. The DMAT allows the decision maker to determine whether the implementation of a trickle fill system, is economically feasible for a given rural service area.
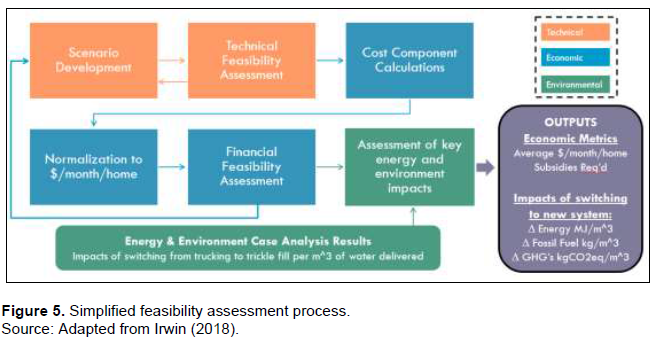
As illustrated in Figure 5, the process can be described in the following main overarching steps:
1) Scenario development.
2) Technical feasibility assessment.
3) Cost component calculations.
4) Normalization and combination of cost components into total dollar cost per month per household.
5) Financial feasibility assessment.
6) Determination of key energy and environment impacts of switching to trickle fill system and the associated change in the carbon footprint.
The scenario development and technical feasibility assessment are the most critical and sometimes most time-consuming elements of the process. These two steps work together to produce the concept design, which will then be tested for financial feasibility. Once a geographical area of interest has been selected, the assessor needs first to decide which type of planning horizon will be used. If a long-term planning horizon is desired, then future growth will need to be considered in the scenario. If a short-term planning horizon is deemed appropriate or minimal growth is anticipated, then only the present-day data on the number of households will be required. The groupings of potential customers and the tie-in point to the existing system should be identified and marked out on a map. The existing system type, number of connections, and number of households for each customer grouping will need to be identified as these characteristics have a bearing on the cost structure and environmental impacts per household. To conceptualize the potential new distribution network, basic preliminary routing principles can be applied. The preliminary routing process should include marking out the potential pipeline routing on a map by following roads, identifying any known existing pipeline right-of-way, and avoiding any obviously complex crossings. Opportunities to use blanket easements on private land should be considered in the routing as previous trickle fill projects have found this an effective way to keep capital costs down (Tiffin, Personal Communication, May 2, 2018).
Langford et al. (2012) outlined an approach for determining the high density polyethylene (HDPE) piping specifications (size and pressure rating). The demand data (that is, population projections, water usage rates, types of demand, major water users, and required delivery pressures) are critical inputs. Primary water consumption data should be used where possible. Best practice recommends that the projection of the water demand on the proposed system should consider “historical data, previous studies, record drawings, digital mapping, public opinions, and application of engineering principles” (Langford et al., 2012, p. 802). As a starting point, the following pipe sizes should be selected: for mainlines that need fire flow, use a minimum diameter of 150 mm (6”); for other mainlines, use a minimum diameter of 50mm (2”).
Once the conceptual piping route has been laid out, its technical feasibility will need to be assessed via hydraulic analysis. Once the scenario has been developed and determined to be technically feasible, the economic analysis part of the process can begin. Cost components to be considered include:
Capital cost: Order of magnitude cost estimates to build the new trickle fill system.
System connection cost: Determined by owner of existing system, and commonly referred to as an offsite levy. This typically captures portion of capital cost of existing infrastructure.
Treated water purchase cost: Determined by owner of existing system. Water treatment costs associated with the water consumed.
O&M cost: Costs of running the existing distribution systems (e.g. water co-op reservoirs) only. Any incremental O&M costs for the new trickle fill piping are assumed to be covered under the water treatment purchase cost.
In this framework, the capital cost is shared equally among “household equivalents” (defined below), meaning that the capital cost amount of the monthly rate for each single-family household is the same. Once the cost components are calculated for each customer grouping, they should be normalized into $/month/ household and then summed together to give the total monthly cost per household within each grouping. Note that the capital cost is a flat rate and does not depend on water usage. For the capital and system costs, an amortization period needs to be determined. To convert the values into per household, institutional and commercial customers will need to be assigned a “household equivalent” (Heq). This framework recommends using the ratio between the water consumption of the given institutional or commercial customer and the average household consumption to determine Heq. Averaging the normalized total cost values of all the customer groupings will provide the average total cost per household per month. That value can then be compared against the determined affordability threshold for that population of customers. In the absence of a case-specific affordability threshold, 2% of the province’s median household income (MHI) can be used (Janzen et al., 2016) as an affordability benchmark.
The next step after the economic feasibility assessment is the estimation of key energy and environmental impacts of switching from the existing systems (either trucking in water or drawing from a nearby groundwater well) to the proposed trickle fill system. The DMAT examines the change in three metrics: energy consumed, fossil fuels consumed, and greenhouse gases emitted (EPA, 2018). The “per unit of water delivered” impact metrics are required in order to estimate the change impacts. The difference in energy consumption (MJ/m3), fossil fuel consumption (kg/ m3), and greenhouse gas emissions (kgCO2eq/m3) are estimated. The change in the carbon footprint is soon likely to become a crucially important consideration in public infrastructure projects, as Canada transitions to net zero carbon to meet its obligations to the global Paris Agreement, 2015, ratified by Canada on October 5, 2016. (Canada, 2016).
RESULTS AND DISCUSSION: APPLYING THE DMAT TO A CASE STUDY
Case study area selection
The chosen case study area for this project is in the northeast portion of Rocky View County (RVC), Alberta. This area has been chosen for this project for a few notable reasons. First, the case study area is close to an existing regional water system that has capacity to serve additional customers and is owned by the rural municipality. This existing regional water system includes a surface water treatment plant, water pump stations, high-pressure transmission mains, and treated water reservoirs (MPE Engineering Ltd., 2013). Second, data is available for the determination of the system connection and water treatment cost components. Third, residents of the area could see an improvement in their drinking water quality and quantity if they were to switch from their current groundwater supply to the regional supply. Currently, some water systems and individual residents obtain their water by trucking it from neighbouring municipalities. The remaining residents obtain water from individual or communal wells. The groundwater in the eastern portion of rural case study municipality contains elevated concentrations of Total Dissolved Solids (TDS) (Hydrogeological Consultants Ltd., 2002). Groundwater high in TDS is often high in manganese, iron, sulphur and other undesirable constituents that would not be present in the treated surface water from a regional water treatment plant (Health Canada, 2010, 2016b).
Scenario development
The first step in the development of the case study was to determine where the proposed trickle fill system would tie-in to the existing regional system. A tie-in point at an existing pump station and reservoir that was currently being underutilized was selected. The existing pump station was located in the center of the case study area. Connecting more users would also have the added benefit of improved operational efficiency for the existing station. By increasing the demand on the reservoir, the residence time (and thus the water age risk and associated costs of mitigation) would be reduced.
The second step in the scenario development was to identity the customer groupings to which the new trickle fill system would deliver the water from the regional system. Input was gathered from municipal and regulatory bodies on potential customers within the case study boundary. They identified existing water co-operatives, distribution centers, and other entities that currently truck-in their water or access groundwater wells. These inputs are the starting point for the plan, marking the groupings that they suggested on a map. Then, using Google Maps (satellite view), clusters of homes were identified in the area and are added as groupings to the plan. Future growth or new developments were not incorporated into the DMAT as those would need to be serviced by additional distribution lines. Finally, the scenario assumes a medium-term (about 10 year) planning horizon.
With the groupings and tie-in point identified, the general route for the trickle fill water distribution piping was mapped out. The piping was routed to follow existing roadways and used Google Maps to determine piping lengths. The scenario parameters of population, homes and connections are summarized in Table 1. The proposed trickle fill water distribution network would be installed to deliver water to fifteen discrete customer groupings. There were three distinct customer groupings:
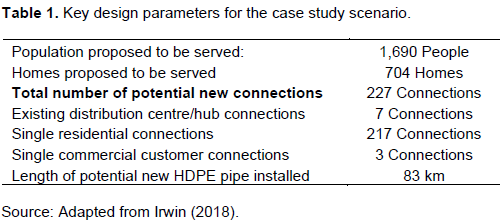
1. Existing distribution hub such as a water cooperative,
2. Large single institutional/commercial customers, such schools, places of worship, or campgrounds, and 3. Clusters of homes in the general vicinity that are not connected to an existing distribution center, mostly at the moment relying on individual groundwater wells.
At this stage, an analysis to determine the required piping diameters for the scenario would require additional engineering data, such as the elevation profile data and hydraulic modelling. In the Langford et al. (2012) case study, the County of Kneehill projects, and the County of Newell projects (MPE Engineering Ltd., 2005), they used mainline piping with internal diameters between 40 mm and 75 mm. Detailed design would require that hydraulic modelling (with topographical and demand data as inputs) be executed to ensure technical feasibility and to refine the parameters, it would be necessary to confirm that these sizes are appropriate for this case study location. It is important to note that elevation differences throughout a trickle fill network can impact its technical feasibility. Given the flat prairie landscape of this particular study area and its similarity to that of other trickle fill developments in Alberta, it turned out that elevation problems were not an issue.
Inputs and assumptions
The following is a summary of the key economic, energy and environmental inputs and assumptions used in the case study analysis.
Economic analysis variables
The key inputs required for the analysis included the number of homes, pipeline lengths, number of road crossings, water consumption data, capital cost data, and system owner charge rates. All costs are in Canadian dollars.
For the water consumption data, the used water co-operative annual reports to determine the annual water consumption of each pre-existing system. For the groupings for which no primary data was available, a default average flow per day of 250 L/person/day and 2.4 persons in each household were assumed (Statistics Canada, 2011; Statistics Canada, 2017a).
To execute the capital cost calculation, a baseline cost rate ($/km) had to be selected and cost escalation rates per pipeline segment needed to be assumed. For the baseline rate, cost data from previously implemented trickle fill projects in Alberta were available. It was assumed that the baseline cost for this scenario would be equal to the average cost of the Kneehill County trickle fill projects that were installed between 2009 and 2011. That average cost was reported to be $58,000/km as of 2011 (Janzen et al., 2017), which is equal to $62,761/km in 2017 dollars (Bank of Canada, 2018). It was assumed that a cost escalation (a percentage of cost addition on top of the baseline rate) for each pipeline segment could be based on the number of road crossings and the expected number of branch connections.
System owner charge rates were taken from the municipality’s Master Rates Bylaw. Additional key variables in the economic analysis included the assumed amortization and the affordability threshold. It was assumed that both the capital cost and the system connection fee would be amortized over the course of 25 years and that a 0% interest rate would apply. The 25 years was selected to align with the standard home mortgage term. The affordability threshold utilized is common in both Canadian and US studies, namely a fraction of the median household income (MHI) of the region in question. As in Janzen et al. (2016), it was assumed that water costs should be less than or equal to 2% of the MHI as the affordability benchmark. In the absence of the actual MHI for the groupings in this case study area, an appropriate proxy was used, namely Alberta’s 2015 MHI of $93,835 (Statistics Canada, 2017a).
For the O&M cost calculations, little primary input data was available. It was assumed that any additional O&M costs associated with the new trickle fill system would be negligible in comparison to the existing operational expenditure for the regional system. At the existing systems, such as at water co-operatives, there may be some costs associated with running the distribution facilities. However, for this analysis, it is reasonable to assume that those costs will be relatively minimal compared to those currently being incurred to operate the existing small groundwater treatment systems. Volunteers presently run many of the systems. With the complexity of operation expected to decrease with a move to a trickle fill system, it is reasonable to expect that more of these systems would be run by volunteers as is the case in many small water systems in Canada. Hence, a decrease in the average operations costs could be expected. Extrapolating from High Point Estates Subdivision Waterworks 2017/2018 budget statement, the operations cost of the High Point water co-operative (excluding operator pay) can be roughly estimated as $2.20/m3 (High Point Estates Ltd., 2016, 2017). For the case study calculations, it was estimated that the average O&M cost per system (in the trickle fill scenario) would be 50% lower than this. Hence, $1.10/m3 was used as the estimated O&M cost.
Energy and environmental impact assessment framing
Lansdowne case: Key energy and environmental impact per cubic meter of water delivered were calculated for this case study. The Lansdowne Estates grouping was selected as the representative case for the comparative analysis between a system that trucks-in water and a projected trickle fill system, which delivers the water by pumping. Currently, the Lansdowne Estates grouping trucks water in from a water-fill station approximately 20 km away (Lansdowne Estates, 2016). The scope of the comparison was bounded to the following:
i) Trucking scenario (Scenario A): the energy required, fossil fuels consumed, and GHG emissions produced in the delivery of the water from the Calgary depot to the Lansdowne treated water reservoir.
ii) Trickle fill scenario (Scenario B): the energy required, fossil fuels consumed, and GHG emissions produced to pump the water from the Conrich station tie-in point to the Lansdowne treated water reservoir.
The trucking scenario inputs were acquired from members of the Lansdowne Estates Waterworks System distribution co-operative. For the calculations, the annual volume of water hauled was assumed to be 3,900 m3 (2017 Lansdowne usage) and the volume of water oved per truck was set at 12 m3/truck (DeVetten, Personal Communication, May 8, 2018). It was assumed that the truck would be a class 8 diesel vehicle with a fuel efficiency of 40 L/100 km which is the average reported in Natural Resources Canada (2016) for trucks in that class. For the trickle fill scenario, the data specifications of the existing Conrich station pumps were used to calculate the specific energy (also known as the Volumetric Energy Consumption) to be 0.27 kWh/m3 of water delivered. Because the calculation was based on total rated head of the pump (rather than actual head required), it is likely that this is a conservative value; however, checking it against the average value for water pumps of 0.2 kWh/m3 reported in Papa et al. (2014), it was concluded that this is within a reasonable margin of acceptable estimates. In order to estimate the GHG emissions for the trickle fill scenario, the electricity was assumed to have a GHG emissions intensity of 790 gCO2eq/kWh (NEB, 2017).
Water jug refill: Due to the poor groundwater quality in the eastern portion of the rural municipality, many homeowners currently elect to obtain their drinking water from bottle or water jug fill-up depots. As such, a portion of this analysis attempts to estimate the avoidance of water jug re-fills and the impacts of the driving associated with the refills.
No primary data was used for this part of the analysis, but rather, a series of informed assumptions were made to deliver a sense of some of the potential environmental benefits of switching to the trickle fill solution. Based on the author’s field observations, all groupings that currently source most of their water from nearby wells were assumed to source their daily drinking water consumption amount (1.5 L per capita per day) from water bottle refill stations located an average distance of 5 km away.
Incorporating economic, energy and environmental impacts
Upfront costs
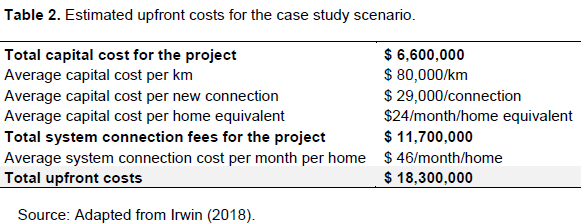
It was determined that it would cost approximately $6.6 million to design and construct the new trickle fill piping network. Table 2 presents the estimated total upfront costs for the case study scenario. Normalization of the total capital cost value gives $24/month per home equivalent. The sum of all the system connection fees is calculated to be an additional $11.7 million. The system connection charges are nearly double the estimated capital cost of the new trickle fill piping network.
End-user cost
The total end-user cost of water was calculated for each grouping. Each grouping total includes its respective allocated capital, connection fee, water purchase, and, if applicable, distribution system O&M costs. For residential groupings, the end-user costs were found to vary, ranging between $110/month/household to $190/month per household.
The cost for institutional/commercial connections varied dramatically based on the water usage. The estimated end-user costs ranged from $690/month for a small elementary school, $3 200/month for a large high school, to $22 000/month at a large year-round RV Campground.
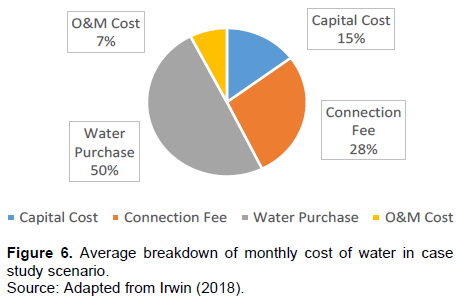
Figure 6 provides an illustration of the breakdown of the total cost of water into four cost categories: capital, O&M, water purchase and connection fees. What becomes immediately apparent when examining this breakdown is the fact that the water purchase (or cost of water treatment) is the dominant component (50%). The system connection component comes in second place (28%); the capital cost (or new pipeline construction cost) comes in third (15%); and the distribution system O&M cost comes in fourth (7%). This breakdown emphasizes the impact of the system owner rate schemes on the end-user monthly cost. In RVC’s case, the variable rate of $3.915/m3 is relatively high compared to baseline variable rates of nearby municipalities such as Calgary ($1.67/m3) and Chestermere ($1.33/m3) (Rocky View County, 2018; City of Calgary, 2018; City of Chestermere Council, 2018). This means that a user’s water consumption from the RVC system can significantly impact the total amount they pay for water.
For the non-single-residential connections, such as the connections to water co-operative distribution systems or institutional/commercial customers, the projected daily consumption has a significant impact on the system connection fee. According to the master rates bylaws, the system connection cost for the non-residential connections is determined by multiplying $18,050 by the expected average daily flow in m3/day. This is different from single residential connections where a fixed rate of $17,150 is charged (Rocky View County, 2018).
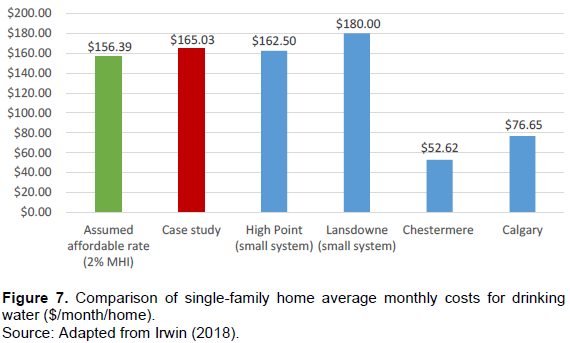
Moving to examine the key indicators set out in the economic feasibility framework, the average monthly per household total cost for water was calculated to be $165/month per household. This value is the result of averaging the normalized total costs for the existing water co-operatives as well as clusters of homes on individual wells. Comparing this average against 2% of the province’s MHI ($156/month), one can conclude that, without any subsidies, the proposed solution may not be economically sustainable.
Based on the calculations and assumptions about what classifies as affordable for homeowners, approximately $1.8 million in capital subsidy would be required for this project to be financially feasible. The finding that a subsidy would be required is consistent with previous similar projects in Alberta, such as the one executed in the County of Newell where a capital subsidy from Alberta’s Water for Life program was essential for its implementation and successful realization (Tiffin, Personal Communication, May 2, 2018).
Looking at the average encumbrance (or charge) rates of a couple of the existing water co-operatives, one can see that the calculated average is within the range of what many households may already be paying for their water. In recent years, homes served via the High Point Estates water co-operative and the Lansdowne Estates distribution water co-operative have been paying, on average, $160/month and $180/month, respectively (Lamb, Personal Communication, July 12, 2018; Kleim, Personal Communication, July 10, 2018). Figure 7 illustrates this comparison and includes estimates for average single-family homes (assuming 250 L/person/ day and 2.4 people per home) for Chestermere and Calgary.
Of course it is possible that the average end-user cost could be higher than calculated due to possible errors or omissions. This suggests that the average cost may be in the upper range of the given population’s current water costs. Interestingly, the current water co-operative rates are also above the defined affordability threshold, indicating either that the assumed affordability threshold is not appropriate for the given population or that homeowners are currently finding it difficult to cover their current water bills. However, this finding does raise the question regarding whether a trickle fill solution is appropriate in less affluent communities if a capital subsidy is not available. This highlights the importance of long term capital planning in water supply projects.
To make a judgment on the relative size of the subsidy required to reach the affordability benchmark, the correct capital cost must be estimated. The required subsidy represents 28% of the cost to design and build the new trickle fill piping network. Comparing this percentage to the typical portion of municipal water infrastructure projects covered by Alberta government funding (that is, 75% of capital costs), the calculated subsidy is significantly less than the typical government grant funding municipal system reasonably receive (Alberta Transportation, 2018; Janzen et al., 2017). Note that a common funding source for regional water infrastructure projects is the Alberta Municipal Water/Wastewater Partnership (AMWWP) Regional Systems Initiative and Water Strategy Initiative (Water for Life). If the case study was found to be eligible for the AMWWP’s “New Pipelines and Treatment Upgrade” grant, then up to 90% of the cost of the new piping (that is, up to $5.9 million) could be covered by government funding (Alberta Transportation, 2017).
Since 63% of the total upfront cost in this case was found to be due to the system connection fees, it is prudent to mention that system connection fees would not be eligible in the majority of government grant programs.
It is not clear in the applicable master rates bylaw whether RVC’s rate scheme aims to recover the subsidy costs. The process used to develop connection cost charges were out of scope of this case study, but it is important to note that provincial grants funds did partially finance the development of the existing RVC regional system. The regional water treatment plant construction project, executed from 2009 to 2011, received approximately $8 million (22% of the total project cost) from Alberta’s Agriculture and Rural Development Department (Bacque, 2011).
Further investigation to confirm how the grant funds were included in the accounting process in setting the cost-recovery connection fee is merited. If the current rate scheme does intend to recover the amount already covered by subsidies, then there is an opportunity for RVC to reduce their fees such that they only recover the remaining debt when existing water systems are looking to amalgamate. A reduction in connection fees would make trickle fill more affordable to more of the existing homeowners and, therefore, increase its viability.
Energy and environment
Lansdowne case (Trucking vs. Trickle fill)
The results of the Lansdowne case comparative analysis are presented in Table 3a and b. Subtracting the trucking scenario results from the trickle fill scenario results gives the key energy and environmental metrics, or “DELTAS”, between the two methods of water delivery (Table 3(b)). The key values were all calculated to be negative which indicates that delivering water to the Lansdowne co-operative via the proposed low-pressure piping system would use less energy, consume less fossil fuels, and emit less GHG’s than the current practice of having it trucked-in from a reservoir that is located 20 km away. In summary, a trickle fill solution would have a lower carbon footprint than the current operation of trucking in potable water.
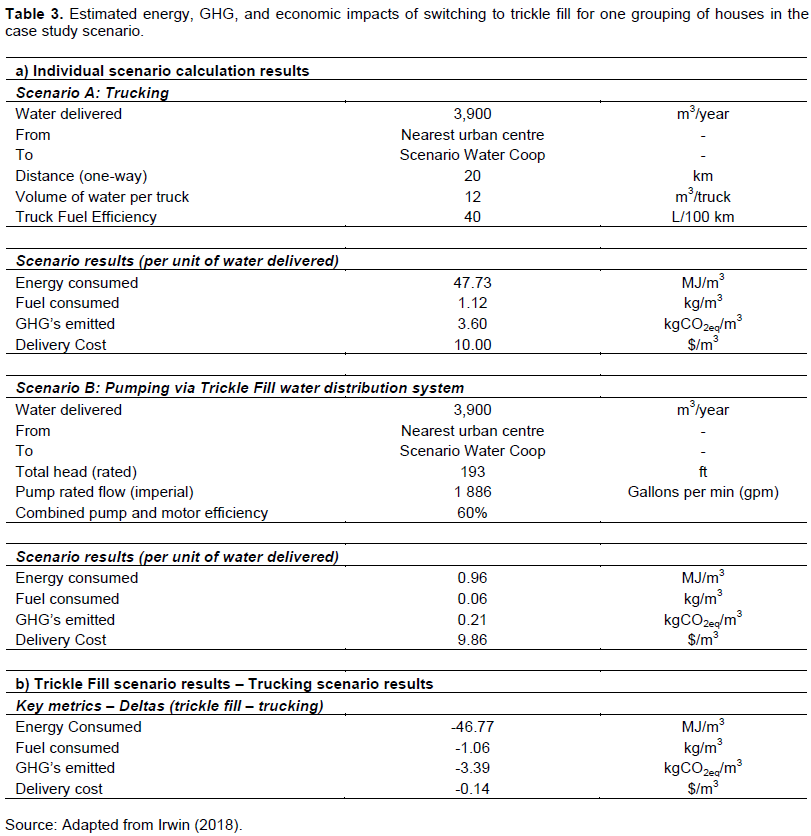
The calculations estimate that, in 2017, Lansdowne could have avoided indirectly consuming approximately 182 GJ of energy if the trickle fill system were in place. This is equivalent to the energy consumed by 1.97 average Canadian households (Statistics Canada, 2017b). When you compare this to the number of properties currently served by the Lansdowne co-operative (24 homes), a ratio of 12:1 emerges, suggesting that the energy associated with hauling water for 12 average Lansdowne homes is equivalent to adding one average Canadian home to the global energy demand. Similar logic applies to the fossil fuel consumption and greenhouse gas emissions. For 2017 year, approximately 13 tonnes of CO2eq and 4 tonnes of fuel consumption could have been avoided if Lansdowne had received its water via the proposed trickle fill piping rather than via trucking. Given that Canada’s per capita emissions was reported to be 20.6 tonnes per person in 2012 (Boothe and Boudreault, 2016), the case’s emissions savings result is equal to approximately 60% of an average Canadian’s carbon footprint. While this may not seem like a lot, the resulting long-term cumulative effect merits consideration.
Another way to represent the results and to highlight the impact per home is to divide the yearly annual savings by the number of homes served by the Lansdowne co-operative. Doing so gives 7.6 GJ/yr/ home, 172 kg/yr/home, and 551 kg CO2eq/yr/home of energy, fossil fuel, and emissions savings, respectively. These Lansdowne case results have implications for any of the other groupings in the case study that also currently truck-in their potable water.
Water jug refill vs. trickle fill
Approximately 69 five-gallon-jug re-fills were estimated to occur each year for every household on a well-water system. This translates to 17 trips to the water fill-up station per household. Through a comparative analysis, switching from water jug refills to the trickle fill option would result in an estimated energy savings and a GHG emissions reduction of ~180 MJ/home/yr and 13 kg/home/year, respectively.
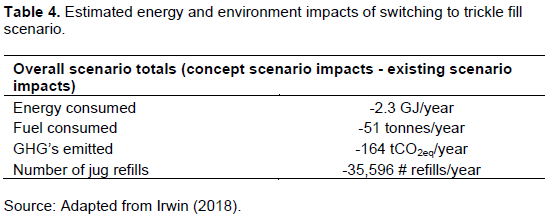
Overall scenario
The key energy and environmental metrics for the overall scenario were estimated by incorporating per unit changes or DELTAS from the Lansdowne case and water jug refill case. The compiled results are presented in Table 4. Approximately, per year, 2.3 GJ of energy consumption, 51 tonnes of fossil fuel consumption, 164 tonnes of CO2eq emissions, and 36 thousand bottle refills could potentially be avoided by implementing the trickle fill scenario. To put a couple of these numbers into perspective, the potential energy savings is equivalent to the energy consumed by 25 average Canadian households (Statistics Canada, 2017b) and the potential emissions savings is equivalent to those produced by 36 average North American vehicles (EPA, 2018).
Drinking water quality improvement
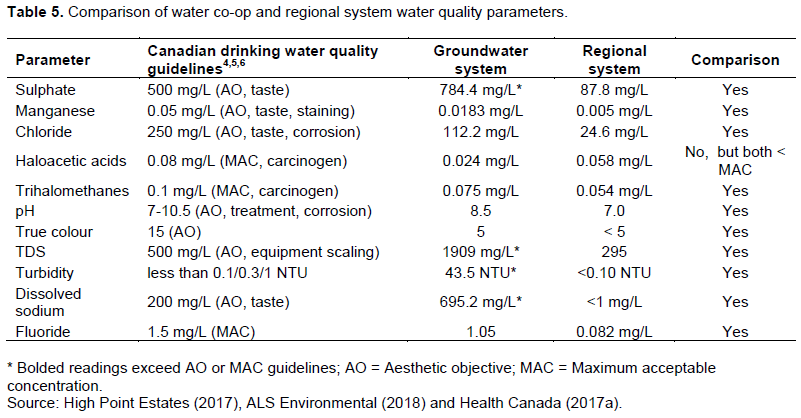
To assess the potential drinking water improvement that the case study area residents could experience if they were to switch to a trickle fill solution, the water quality parameters from one of the annual water co-operative reports was compared to treated water quality parameters from the regional water treatment plant. Both data sets were then compared against the Guidelines for Canadian Drinking Water Quality (Health Canada, 2017a). Sample data from the High Point Estates Subdivision Waterworks System Annual Report (2017) was chosen for the comparative analysis. This High Point water co-operative currently sources their water from nearby wells like many other water co-operatives and individual landowners in the east Rocky View area. The High Point data serves as a reasonable representation of the general potable water quality from any groundwater-sourced small systems in the case study area when compared to the groundwater assessment study by Hydrogeological Consultants Ltd. (2002) and the most recent groundwater quality risk map published in the Agriculture Land Resource Atlas of Alberta (2018).
Table 5 presents some of the parameters examined, and, although it is not an exhaustive list, it does illustrate that an improvement in drinking water quality could be expected if residents on groundwater-sourced systems were to switch to the RVC regional system. Of the thirteen listed in the table, ten of the parameters would likely see improvements. Moreover, the regional water treatment plant potable water output is drastically better across the parameters that have been chronic problems for many of the small systems in the area such as total dissolved solids (TDS), manganese, fluoride, dissolved sodium, and sulphates. According to Health Canada’s Guidelines for Canadian Drinking Water Quality technical documents, the water quality improvements expected in this case offer improved taste, colour, and palatability as well as some potential health benefits (Health Canada, 2016b).
It is relevant to note that those households in the area that currently truck-in their potable water have chosen the water-hauling method primarily due to the poor quality of their well water or lack of a groundwater availability. For them, a move to trickle fill would mean an improvement in the end-user water quality, and, in addition, it would mean an elimination of trucking costs and a reduction in supply complexity.
The DMAT, presented above, takes account of economic, energy, and environmental factors in assessing the feasibility of a proposed trickle fill solution. If and when a proposed solution “passes” the DMAT feasibility threshold, then perhaps a full engineering design and study can be commissioned.
CONCLUSIONS
The DMAT presents a low cost, user-friendly method of evaluating an innovative solution that could enable reliable access to high quality drinking water that meets the Canada Drinking water Quality Guidelines for rural water users. The template takes account of economic, energy and environmental factors in assessing whether a trickle fill solution for those water users is viable. If the DMAT makes more than a prima facie case for a trickle fill solution, a full-scale engineering study can then be undertaken.
The application of the DMAT would take into account all the relevant local factors. Not all locations and contexts are suitable for a trickle fill solution. In the case study reported here, it was determined that, while trickle fill is technically feasible, its economic viability depends on the scale of provincial subsidy that could be obtained.
The case study finds that trickle fill solution would bring about the average cost of water to be $165 per month per household. Comparing this average against 2% of the province’s Median household Income (MHI) of about $156 per month, one can conclude that, without any subsidy, the water users may not support the proposed solution. However, $165 per month per household is within the range of what many households may already be paying for their water in this rural municipality. Hence for this particular case study, it may not be surprising if there is little enthusiasm for a trickle fill solution, without a subsidy. If it is assumed that water bills should not be much higher than about 2% of MHI, a subsidy of approximately $1.8 million would be needed to keep the water cost within the affordable range.
Another way to get maximum social value of the existing investment in a regional water supply network may be to provide the required capital funding for the trickle fill solution by the rural municipality that owns and operates the existing water treatment plant and then cover the cost through an increased property tax on the new households that will now receive treated water; such that increase in tax can then be amortized over the next 20 to 25 years. The financial implications of this option, including projected interest rates, merit further study.
Those considering trickle fill solution should investigate the extent that it would reduce the operational complexity and costs at existing water co-operatives as well as at rural institutional/commercial properties.
Trickle fill water supply is also likely to reduce energy consumption and have a smaller carbon footprint. The trickle fill water supply solution is a rural specific approach that shows promise in providing safe, secure and sustainable drinking water supplies to households and other rural institutional water users.
ACKNOWLEDGMENTS
This research was made possible by an NSERC research grant to Gopal Achari. All authors would like to thank the numerous system operators, managers and owners, and operators who assisted in the development of the case study scenario. Additionally, all authors would like to thank two anonymous referees of this journal for helpful comments. However the Authors alone are responsible for any remaining deficiencies.
CONFLICT OF INTERESTS
The authors have not declared any conflict of interests.
REFERENCES
ALS Environmental (2018). Balzac Water System 2018 Annual Report. (Lab Work Order #: L2062835). Retrieved from Rocky View County Utility Services. Rocky View County, Alberta | |
Agriculture Land Resource Atlas of Alberta (2018). Aquifer Vulnerability Index for the Agricultural Area of Alberta. Government of Alberta. | |
Albetis L, Lenehan AM (2003). An Assessment of the Trickle Feed System as a Tool for Implementing the Free Basic Water Policy. | |
Alberta Municipal Affairs (2017). 2017 Municipal Codes. Government of Alberta. | |
Alberta Transportation (2017). AMWWP Regional Systems Initiative and Water Strategy Initiative (Water for Life) - Grant Procedures Manual. | |
Alberta Transportation (2018). Alberta Municipal Water/Wastewater Partnership (AMWWP)/ Water for Life. | |
Alberta Environment and Parks (2022a). Regional Water Transmission lines (Large Diameter) in Alberta [MAP]. Created Feb 3, 2022 by Jaclyn Roulston. Government of Alberta. | |
Alberta Environment and Parks. (2022b). Overview of Regional Water Transmission lines (Large Diameter) in Alberta and Small Diameter Low Pressure Water Distribution Lines in Alberta [MAP]. Created Feb 3, 2022 by Jaclyn Roulston. Government of Alberta. | |
AUMA (2018). List of Regional Water and Wastewater Systems in Alberta. Alberta Urban Municipalities Association. | |
Bacque T (2011). Official opening held for Balzac water plant. Airdrie City View. | |
Boothe P. Boudreault FA (2016). By the numbers: Canadian GHG Emissions. Lawrence National Centre for Policy and Management, Ivey Business School at Western University. | |
Bank of Canada (2018). Inflation Calculator. | |
Canada (2016). The Paris Agreement, 2015. | |
City of Calgary (2018). Water Utility Bylaw, (Bylaw number 40M2006). | |
City of Chestermere Council (2018). 2018 Water Rates - per month. | |
Dore MH (2015). Water Policy in Canada: Problems and Possible Solutions. Switzerland: Springer International. | |
Environment and Climate Change Canada (2018). Canadian Environmental Sustainability Indicators: Drinking water advisories. | |
Environmental Protection Agency (EPA) (2018). Green Vehicle Guide, Greenhouse Gas Emissions from a Typical Passenger Vehicle. U.S. Environmental Protection Agency. | |
Environmental Protection Agency (EPA) (2012). Basic Information on Small Systems and Capacity Development | |
Ford T, Rupp G, Butterfield P, Camper A (2005). Protecting public health in small water systems. Report of an international colloquium. Bozeman, Montana, USA. Montana Water Center and Montana State University. | |
Health Canada (2017a). Guidelines for Canadian Drinking Water Quality-Summary Table. Water and Air Quality Bureau, Healthy Environments and Consumer Safety Branch, Health Canada, Ottawa, Ontario. | |
Health Canada (2017b). Sodium in Canada. Food and Nutrition, Health Canada. | |
Health Canada (2016a). Water Quality - Reports and Publications. Government of Canada. | |
Health Canada (2016b). Manganese in Drinking Water [proposed guideline for public consultation]. Water and Air Quality Bureau, Health Canada, Ottawa, Ontario. | |
Health Canada (2010). Guidelines for Canadian Drinking Water Quality: Guideline Technical Document -Fluoride. Water, Air and Climate Change Bureau, Healthy Environments and Consumer Safety Branch, Health Canada, Ottawa, Ontario. (Catalogue No. H128-1/11-647E-PDF). | |
High Point Estates Subdivision Waterworks System (2017). High Point Estates Annual Waterworks Report for High Point Estates, 2017. Alberta, Canada. Retrieved from Alberta Environment and Parks. | |
High Point Estates Subdivision Waterworks System (2016). High Point Estates Annual Waterworks Report for High Point Estates, 2016. Alberta, Canada. Retrieved from Alberta Environment and Parks. | |
Hydrogeological Consultants Ltd. (2002). Regional Groundwater Assessment, Tp 021 to 029, R 25 to 29, W4M & Tp 023 to 029, R 01 to 06, W5M. M.D. of Rocky View No. 44, Alberta, Canada. | |
Infrastructure Policy Group (2014). Carlsbad Trickle Feed System Capacity Assessment. Ottawa: | |
Irwin S (2018). Development of A Feasibility Framework For Trickle Fill Water Distribution Projects (Unpublished report). University of Calgary, Calgary, AB. | |
Janzen A, Achari G, Dore MH, Langford C (2017). Projecting Financial Capability in Small Canadian Drinking Water Treatment Systems. Journal AWWA 109:10: E440 | |
Janzen A, Achari G, Dore MH, Langford CH (2016). Cost Recovery and Affordability in Small Drinking Water Treatment Plants in Alberta, Canada. Journal AWWA 108:5:E290. | |
Langford M, Daviau JL, Zhu DZ (2012). Design of a centralized regional water distribution system: a case study in the County of Paintearth No. 18, Alberta, Canada. Canadian Journal of Civil Engineering 39(7):801+. | |
Lansdowne Estates (2016). Annual report, 2016. Alberta, Canada. Retrieved from Alberta Environment and Parks. | |
MPE Engineering Ltd (2005). Regional Water Services Feasibility Study Update 2005 for County of Newell (1760-004-00). County of Newell No. 4. | |
MPE Engineering Ltd (2013). Conrich Transmission Main and Feed Main Operation and Maintenance Manual. Rocky View County, Alberta. | |
NEB (2017). Canada's Renewable Power Landscape 2017 - Energy Market Analysis. | |
Papa F, Radulj D, Karney B, Robertson M (2014). Pump energy efficiency field testing and benchmarking in Canada. Journal of Water Supply: Research and Technology-Aqua 63(7):570-577. | |
Rocky View County (2018). Master Rates Bylaw, [BYLAW C7751-2018]. | |
Roulston J (2017). Regional Drinking Water Systems 2017 [map]. Calgary, Alberta, Canada: Alberta Environment and Parks, September 27, 2017. | |
Scott RE, Tipping J (2001). Piloting Trickle-Feed Distribution in Rural Africa. People and Systems for Water, Sanitation and Health. Lusaka, Zambia: | |
Statistics Canada. (2017a). Alberta [Province] and Canada [Country] (table). Census Profile. 2016 Census. Statistics Canada Catalogue no. 98-316-X2016001. Ottawa. Released November 29, 2017. | |
Statistics Canada (2017b). Households and the Environment Survey: Energy use, 2015. The Daily. | |
Statistics Canada (2011). Residential water use. | |
University of Saskatchewan, SK Association for Rural Water Pipelines and PFRA, Agriculture and Agri-Food Canada (2002). Rural Pipeline Flow and Water Quality Study. | |