Temporal and spatial change in the relationship between sea-ice motion and wind in the Arctic


Опубликована Ноя. 26, 2020
Последнее обновление статьи Авг. 3, 2023
Abstract
This paper examines the temporal and spatial change in the characteristics of sea-ice motion in the Arctic. Ice motion is generally expressed by a motion at a constant ratio (wind factor) of wind speed, with a certain angle (turning angle) from the wind direction, and ocean currents. This study aimed to reveal the recent changes of the wind factor and turning angle using satellite observation data. We first prepared a daily ice-velocity data set from data for 2003–2017 collected by the satellite microwave sensor Advanced Microwave Scanning Radiometer for the Earth Observing System (AMSR-E) and its successor, AMSR2. Monthly values of the wind factor and turning angle were calculated by a least squares technique, based on the linear relationship between sea-ice velocity and geostrophic wind velocity. The daily variation of sea-ice motion was strongly correlated with that of the wind. The wind factor and turning angle changed regionally, seasonally and interannually. With regard to long-term trends, the wind factor has increased in almost all areas of the Arctic. However, the trend of increase stopped around 2010, especially around the central Arctic.
Ключевые слова
Seasonal change, wind factor, interannual change
Introduction
Sea-ice extent in the Arctic has been on a downward trend since the 1980s (e.g., Cavalieri & Parkinson 2008). However, some have reported that the downward trend in the ice thickness has disappeared in recent years (Kwok 2018). We need to know the processes controlling variations in sea ice to understand the present state of Arctic sea ice and predict its future. One of the important issues is the relationship between the sea-ice motion and wind.
Thorndike & Colony (1982) investigated the linear relationship between drifting buoy velocity and geostrophic wind velocity under free-drift conditions. The relationship is calculated by the following formula using ice velocity (U, V) and wind velocity (u, v):

where A is a scalar quantity called wind factor, θ is the turning angle and (Cu, Cv) represents the average ocean currents during the calculation period. Thorndike & Colony (1982) showed that most of the temporal and spatial change of ice motion could be explained by the geostrophic wind conditions.
Thomas (1999) extended the work of Thorndike & Colony (1982) using in situ data of daily buoy positions for a 15-year period (1979–1993). He looked at the seasonal variability in the relationship and found that the wind factor and turning angle reached their maximum in summer. In his study, there was no significant long-term trend in the wind factor and turning angle over the 15 years.
Although sea-ice motion has been observed by drifting buoys (e.g., Rigor et al. 2002), these instruments are not able to capture sea-ice motion over a wide area. Kimura & Wakatsuchi (2000) used satellite microwave sensor data to show the spatial variation of the wind factor. Kwok et al. (2013) investigated the spatial and seasonal variability of the wind factor over 28 years (1982–2009). They found distinct seasonal, decadal and spatial variability in the ice-to-wind response. Over the regions where they found increases in ice drift speed, the wind factor had an increasing trend during both the winter and summer. They concluded that ice cover is now more responsive to geostrophic wind.
Recently, numerical modelling has been employed to examine the temporal and spatial variation of the wind factor and turning angle. Park & Stewart (2016) revealed the relationship between the turning angle and sea-ice concentration.
The study reported here aimed to clarify the characteristics of seasonal and interannual changes in the wind factor and turning angle to reveal the change of the Arctic sea-ice conditions. We focused especially on the wind factor because its temporal and spatial variations clearly inform us about the changes in the coupling between the wind and ice.
Data
Sea-ice velocity
Daily sea-ice velocity was derived from satellite remote-sensing data. Data from January 2003 to August 2011 were gathered by the AMSR-E. The AMSR-E observations stopped in October 2011, but data from AMSR2 were available from July 2012. This study used AMSR-E data from January 2003 to August 2011 and AMSR2 data from August 2012 to December 2017.
Ice velocity was computed from the gridded brightness temperature of both the horizontal and vertical polarization channels, which were binned to square pixels of 10 × 10 km by the Japan Aerospace Exploration Agency. The calculation uses the 36 GHz channel data for winter (December–April) and 18 GHz channel data for summer (May–November). The 36 GHz channel image is suitable for the ice-motion tracking because of its finer resolution compared with 18 GHz. However, in the summer season, the 18 GHz channel performs better. This is probably due to the influence of changing ice-surface conditions on short timescales in summer. The calculation of the ice drifting speed was based on a pattern matching method called the maximum cross correlation technique (Kimura et al. 2013). This method determined the spatial offset that maximized the cross-correlation coefficient between two brightness temperature arrays in consecutive images separated by 24 hours. After applying filtering and interpolation processes, we constructed a daily ice-velocity data set without missing data over the sea-ice area on a 60 × 60 km grid.
Wind velocity
Geostrophic wind velocity was calculated from the mean sea level pressure (0.75° × 0.75°) from the ERA-Interim reanalysis data (Dee et al. 2011) provided by the European Centre for Medium-Range Weather Forecasts. It was calculated by the following equation:

where f is the Coriolis parameter, ρ is the air density (1.301 kg/m3 as a value of a typical cold air) and P is the pressure.
Methods
On the basis of Eqn. 1, the wind factor A, turning angle (measured clockwise from the geostrophic wind direction to the ice drifting direction) θ and mean ocean current (Cu, Cv) were calculated by a least squares technique. Including A in Eqn. 1 in the rotation matrix and replacing the characters yielded the following expression:

Each parameter was defined by
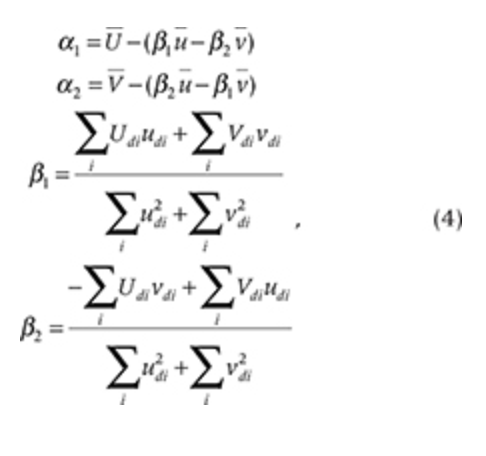
where
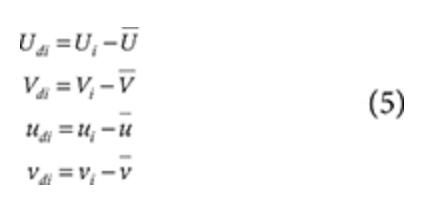
Therefore, the regressed parameters were written as follows:

The squared correlation coefficient can be calculated as follows:
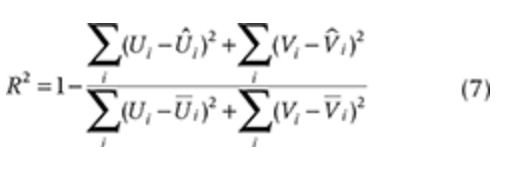
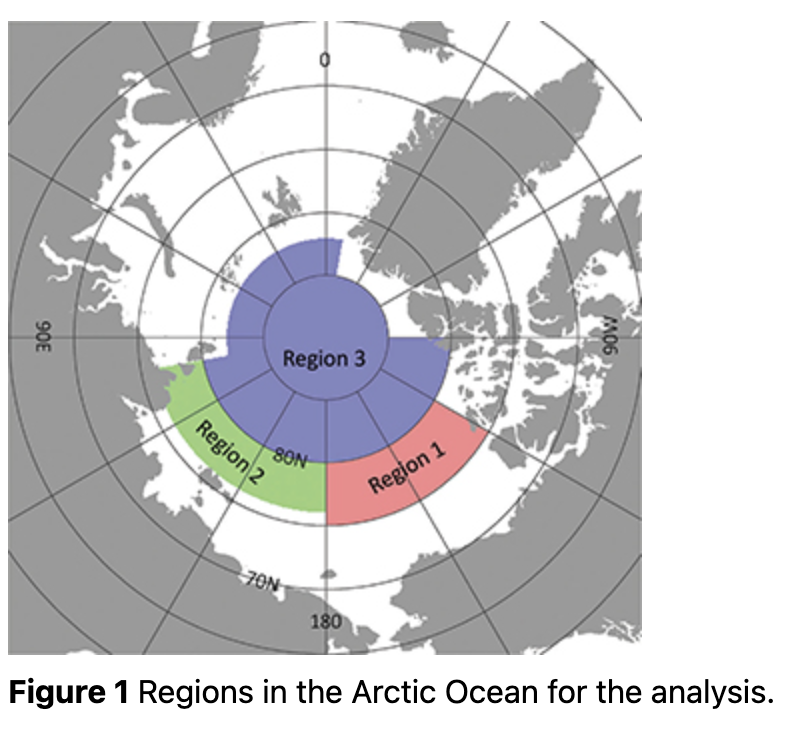
The analysis period of this study was from January 2003 to December 2017, except for September 2011 to July 2012, when there was an observation gap between AMSR-E and AMSR2. The calculation was conducted for the regions shown in Fig. 1.
Seasonal variability of parameters relating ice motion to the wind
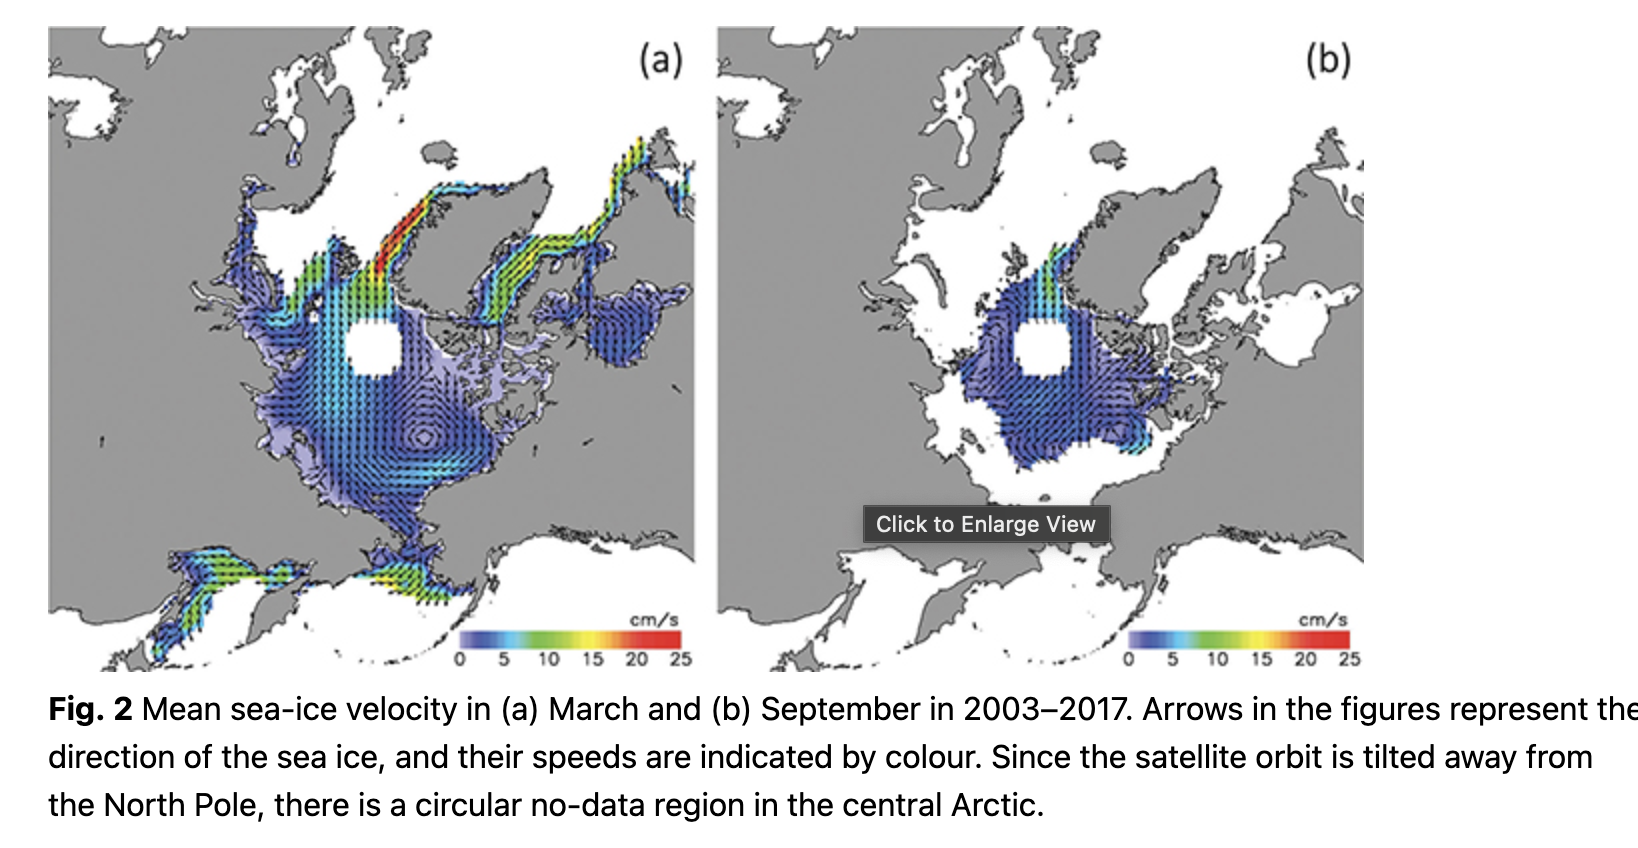
There are two well-known dynamic flows: a transpolar flow from the Chukchi Sea across central Arctic toward the Fram Strait (Transpolar Drift Stream) and a clockwise gyre in the Beaufort Sea (Beaufort Gyre) with a westward flow along the north coast of Alaska. Another feature is the southward ice drift along the coast in seasonal sea-ice areas. Our calculations (Fig. 2) show that in winter during the period being examined, there were strong southward motions up to 20 cm/s along the western coastal areas of the Okhotsk Sea, Labrador Sea and Greenland. However, the ice velocity only ranged 2–4 cm/s around the polar region. These features in the derived sea-ice motion are consistent with that obtained from buoy data by Thorndike & Colony (1982) and other researchers. Kimura & Wakatsuchi (2000) showed that the ice velocity in the central Arctic in winter was less than 2 or 3 cm/s, which is roughly in agreement with this study. In the summer Arctic, the ice drifting speed near the coast increased, and transpolar drift became more pronounced, with a speed of up to 5–7 cm/s.
In March, the correlation between ice velocity and geostrophic wind velocity in March and September is high (Fig. 3), with a range of 0.6–0.8 in almost all of the Arctic, suggesting that temporal changes of the ice motion can be largely explained by those of the wind field. In September (Fig. 3), the squared correlation coefficient becomes higher in the high-latitude region. However, it is smaller near the coastal area. A wide low correlation region was also observed within a radius of about 1000 km from the Canadian Arctic Archipelago. This spatial difference is consistent with the result of Thorndike & Colony (1982), who observed a low correlation within 400 km of the coast. This is because these areas are covered by thick perennial ice (e.g., Bourke & Garrett 1987). Low correlations are also found in the Greenland Sea and the west coastal regions of the Labrador Sea, where the surface ocean current is relatively strong by the East Greenland Current and Labrador Current (e.g., Aagaard & Coachman 1968). The low correlation in these areas is possibly due to time-dependent ocean current fluctuations (Kimura & Wakatsuchi 2000). The squared correlation coefficient is slightly larger (about 0.05%) in summer than in winter, as reported by Thorndike & Colony (1982) and Kwok et al. (2013).

In March and September, there was a clear difference in wind factor between the seasonal ice areas and the central Arctic (Fig. 4). In the seasonal ice areas, which are covered with first-year ice with a low ice concentration, the wind factor was relatively large, since the internal stress caused by the ice-floe interaction and deformation was smaller than it is at higher latitudes with multi-year sea-ice cover. According to Thorndike & Colony (1982), the wind factor decreases near the coast because the sea-ice motion is restricted by geographical factors near the coasts of continents and islands, and the variance in ice motion that can be explained by wind becomes small. The wind factor in the Canadian Arctic Archipelago, which is covered by thick multi-year ice, is extremely small throughout the year, because the internal stress increases as the sea ice gets thicker.
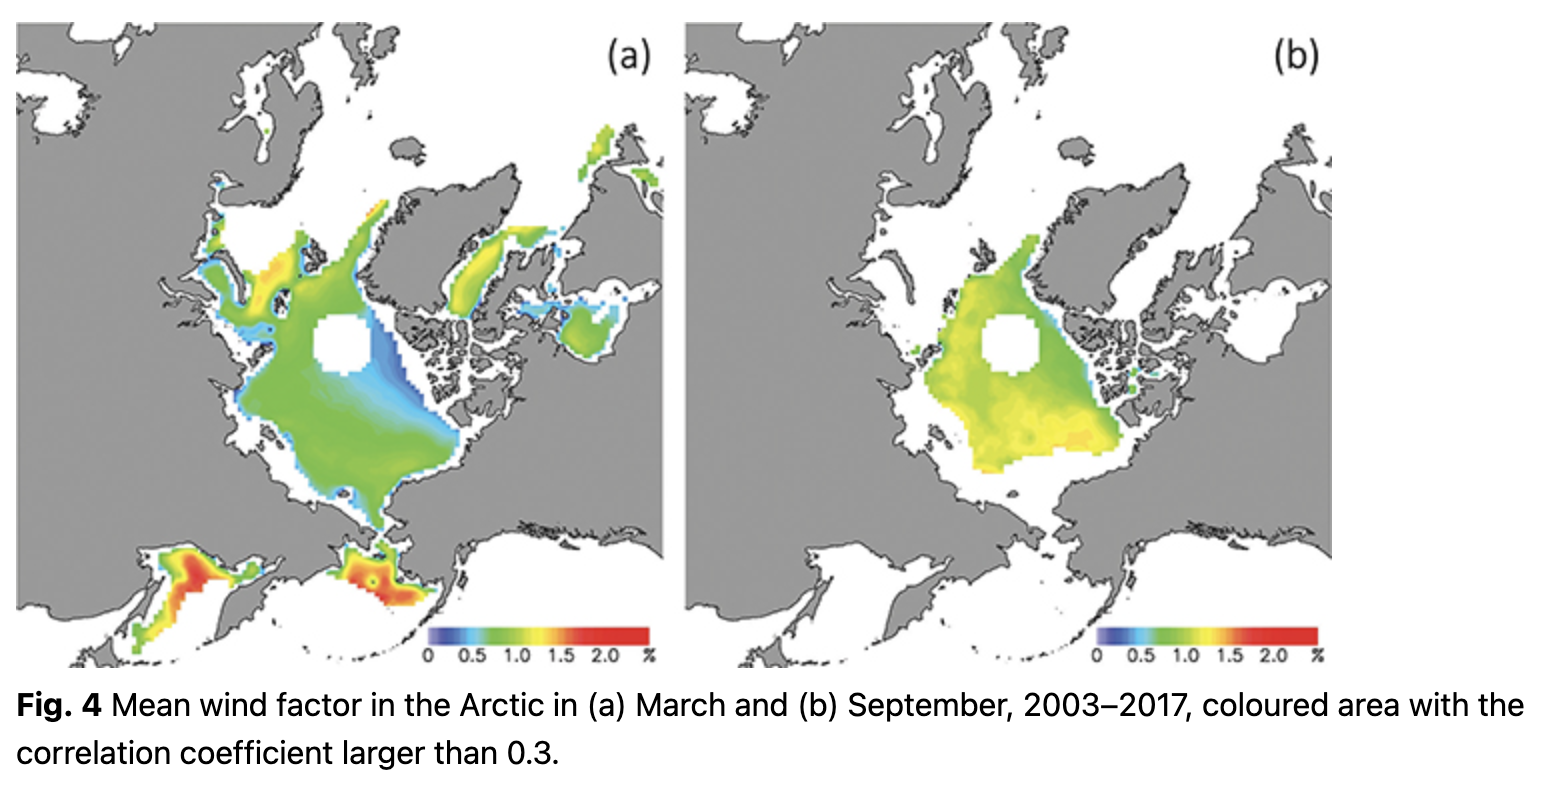
In March, in the time period under investigation, the wind factor in the Bering Sea and the Sea of Okhotsk reached up to about 2%, but in the central Arctic, it dropped to about 0.7%. The wind factor in the Bering Sea and northern part of the Barents Sea exceeded 1.3%. In the Beaufort Sea, East Siberian Sea and Chukchi area, the wind factor ranged 0.8–0.18%. These results suggest that in the absence of ocean currents, sea ice moves about 2% and less than 0.7% of the geostrophic wind speed in the seasonal ice area and the interior of the Arctic, respectively. Simizu et al. (2014) analysed ice motion observed by moored ice-profiling sonar and gave a value of 1.7% of the wind factor in the Sea of Okhotsk in March. Pease & Salo (1987) gave 2.0–3.0% of the factor in the winter in the north-eastern Bering Sea. The results of this study are consistent with these studies. This regional difference is thought to be caused by the difference of the internal stress of sea ice, acting to limit its movement and decreasing the wind factor. The internal stress of sea ice depends on ice thickness and concentration (Thorndike & Colony 1982; Overland & Pease 1988) and plays an important role in mechanical equilibrium in winter in the Arctic Ocean (Hibler 1986; Steele et al. 1997). The wind factor in September is larger than that in March, contributing 1–1.5% in the Arctic (Fig. 4b).
The turning angle (measured clockwise from the geostrophic wind direction to the ice drifting direction) in March and September was restricted to within about ±10° in March (Fig. 5). This means that the sea ice was drifting almost parallel to the geostrophic wind. In September, by contrast, it moved 0–30° right from the wind across the whole Arctic. This pattern matches those from previous research (e.g., Thorndike & Colony 1982). Park & Stewart (2016) investigated the relationship between the turning angle and sea-ice condition using an ice–ocean model and showed that the turning becomes larger as ice concentration decreases.

The turning angle varied from approximately 10° to 20° in summer during 2003–2015 in the three regions of interest (Fig. 6). In winter, it ranged -10° to 5°. The maximum wind factor occurred in all regions in August–September, with the minimum in February and March (Fig. 7).
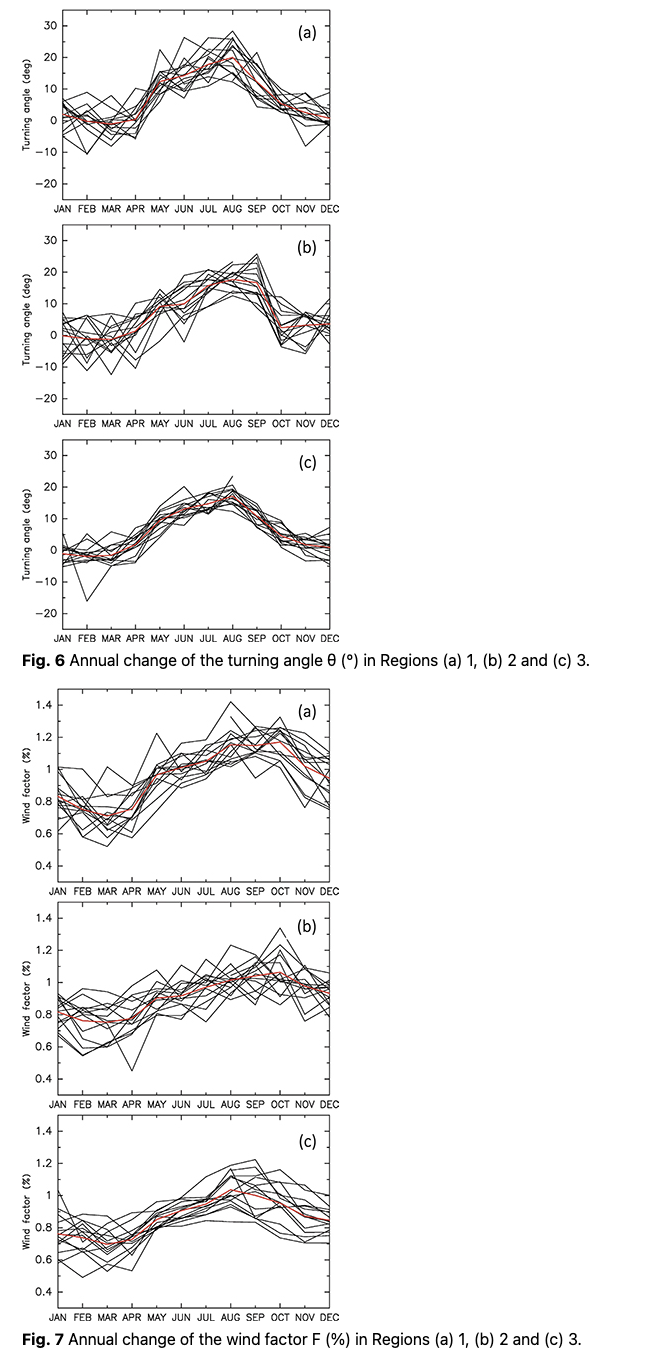
According to Serreze et al. (1989), the wind factor and turning angle in the Canada Basin, which corresponds to Region 1 of this study, were 0.7% and near 0° in winter, and 1.1% and 19° in summer, respectively. Thorndike & Colony (1982) showed that the wind factor and turning angle were 0.77% and 5° for winter and spring, 1.05% and 18° for summer and 0.8% and 6° for fall, respectively. These seasonal trends fit well with our results. Comparing the three regions, Regions 1 and 2 had higher wind factors than Region 3, especially in summer.
Long-team trend of parameters relating ice motion to the wind
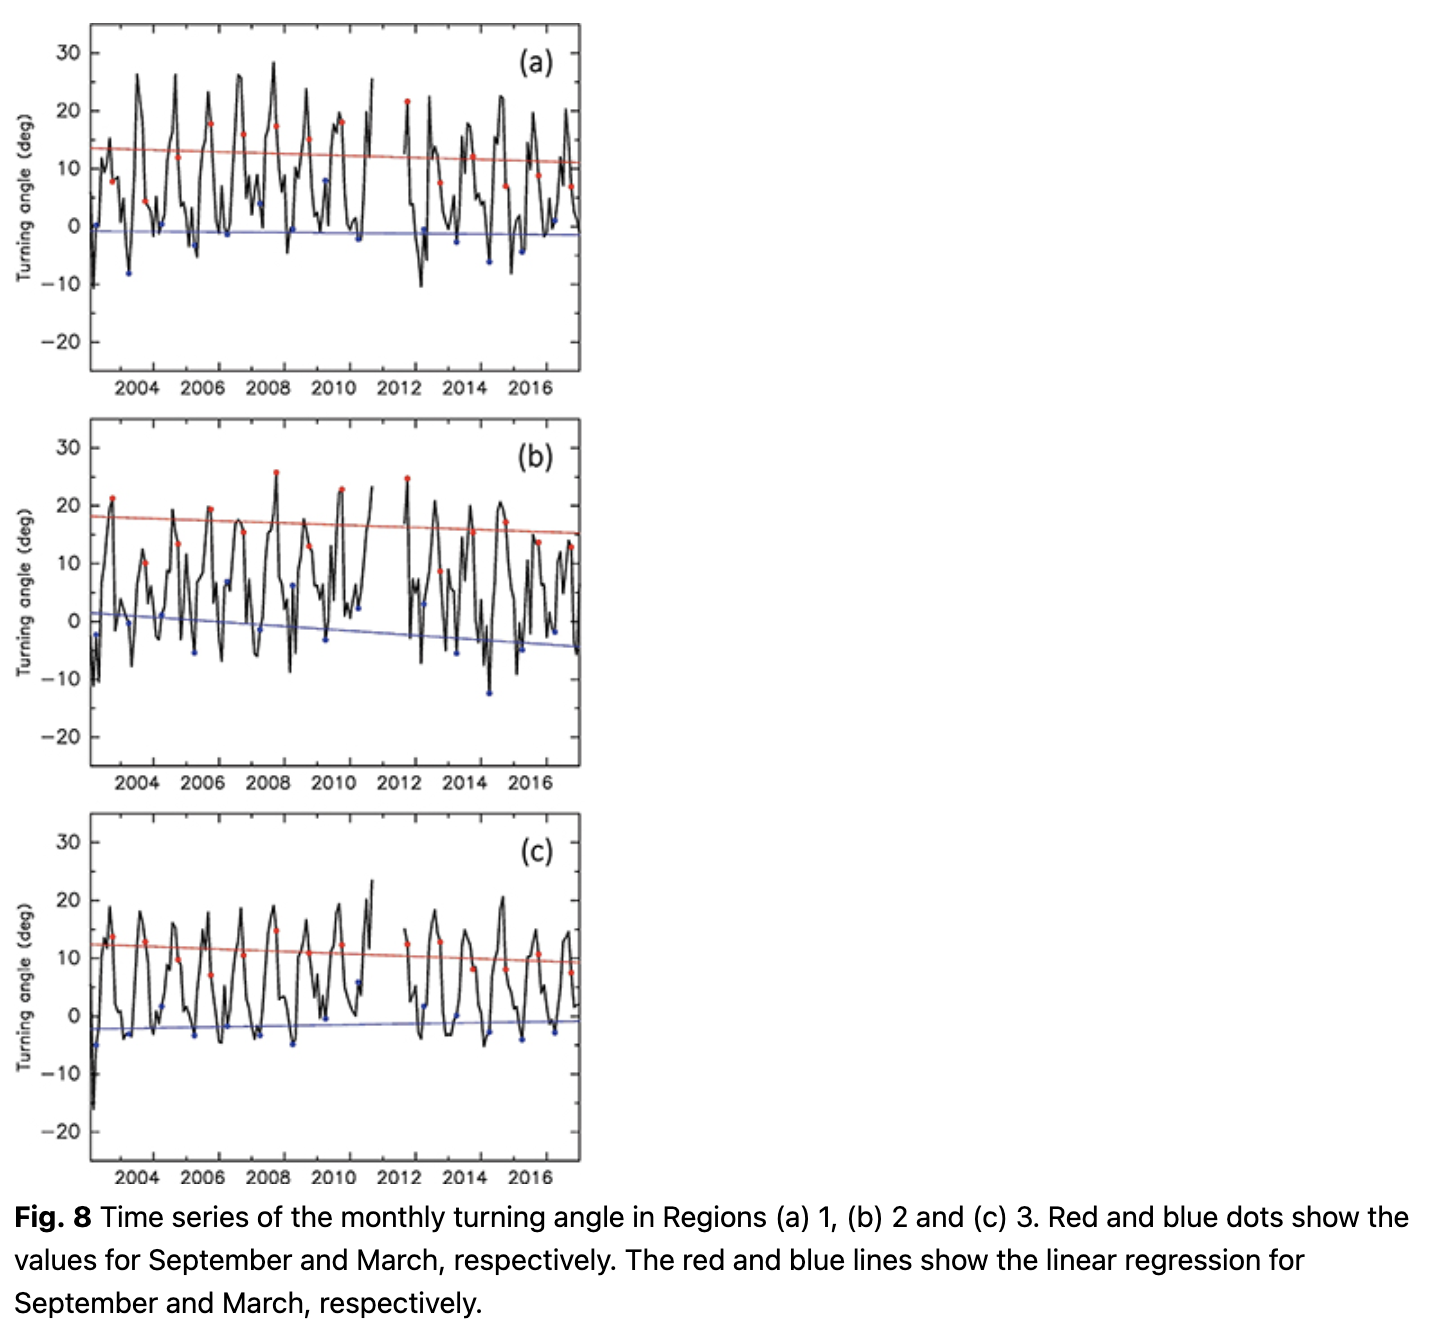
The long-term trend in the turning angle was not significant in all regions (Fig. 8). Interannual variability in the turning angle was large in Regions 1 and 2 in both winter and summer, respectively. The interannual difference in Region 3 was not significant probably because of the more stable ice condition in the high-latitude area compared with Regions 1 and 2.
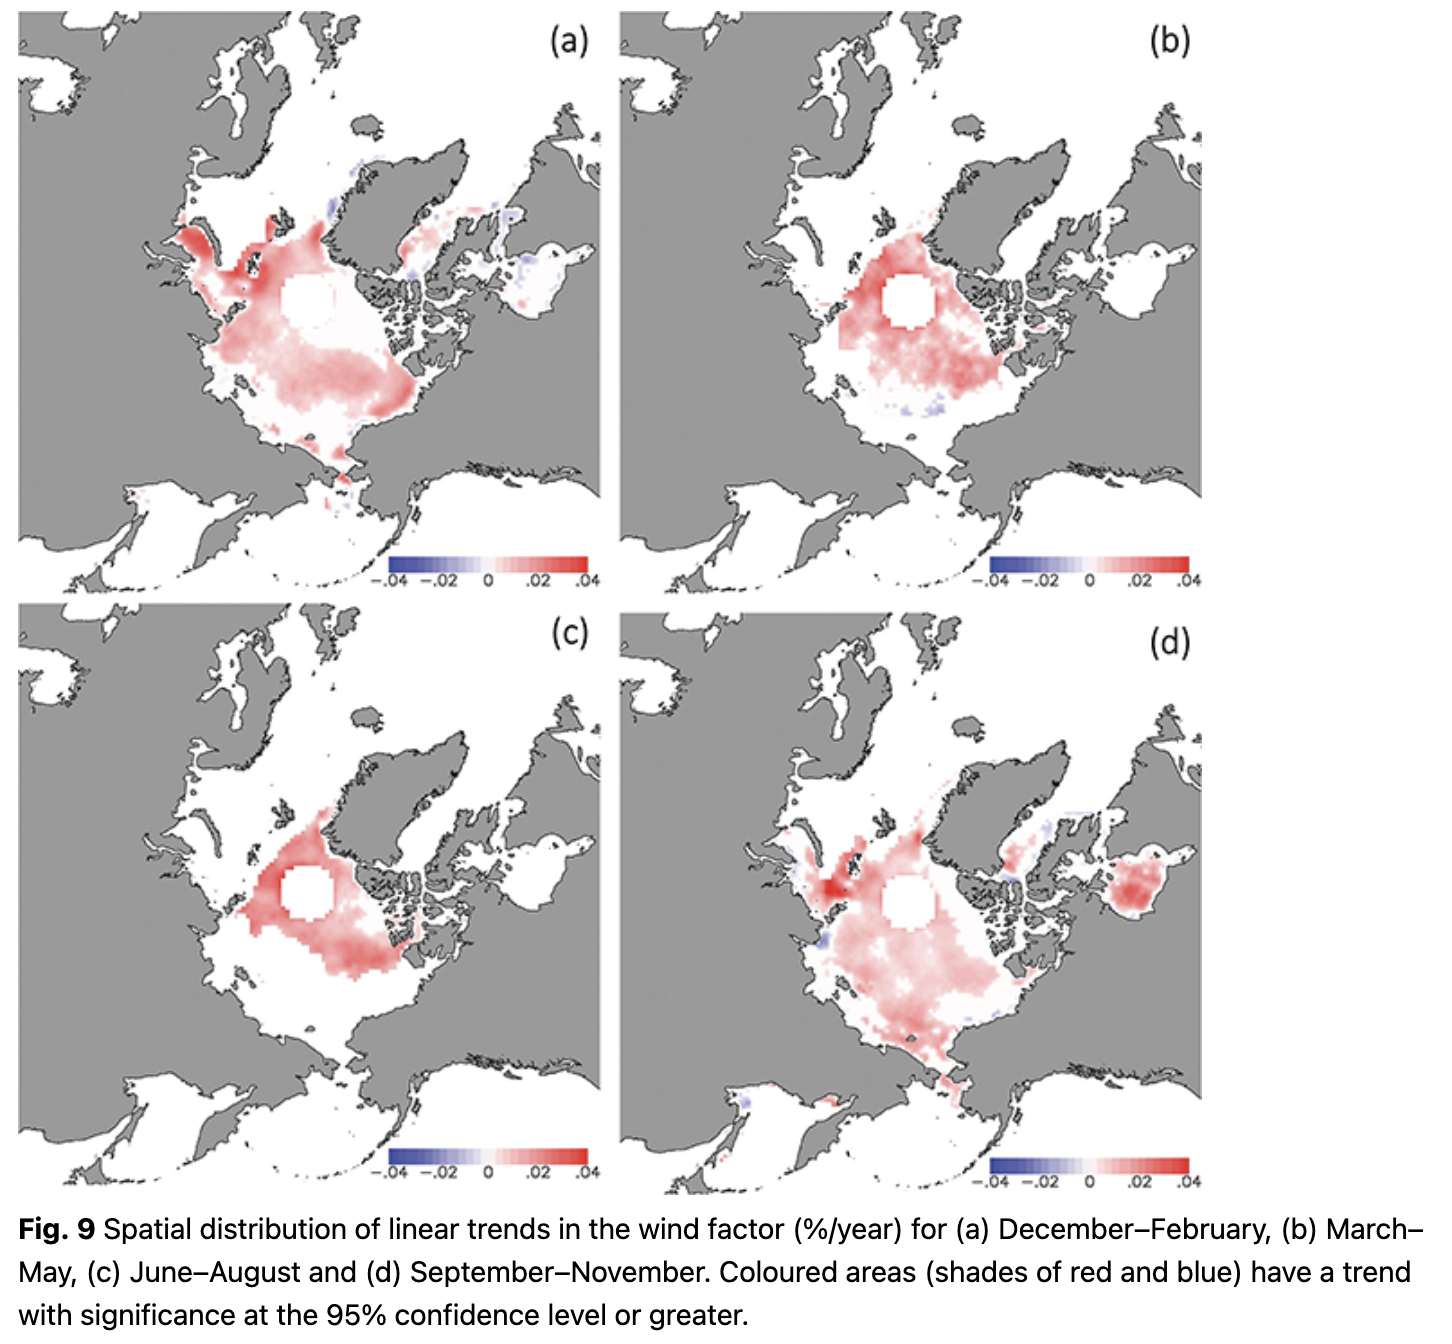
The wind factor increased from 0.01 to 0.05% per year in a large part of the Arctic in all seasons (Fig. 9). In some areas of Hudson Bay, the western Labrador Sea, Denmark Strait, part of the East Siberian Sea, and the southern Bering Strait, the factor showed a small decrease. In these areas, the decrease rates ranged -0.01 to -0.03% per year. In the Canadian Arctic Archipelago and a large part of the Kara Sea, the wind factor in winter (Fig. 9a) showed no long-term trend over the last decade. In spring (Fig. 9b), the wind factor decreased in Region 2 (the Laptev and East Siberian seas). The trend was larger in summer (Fig. 9c) than in winter. Our derived increase trends largely are consistent with the result of Kwok et al. (2013), who showed that the areas with a wind factor larger than 0.01% shrank over 1982–2009, while the basin-averaged wind factor increased during that time.
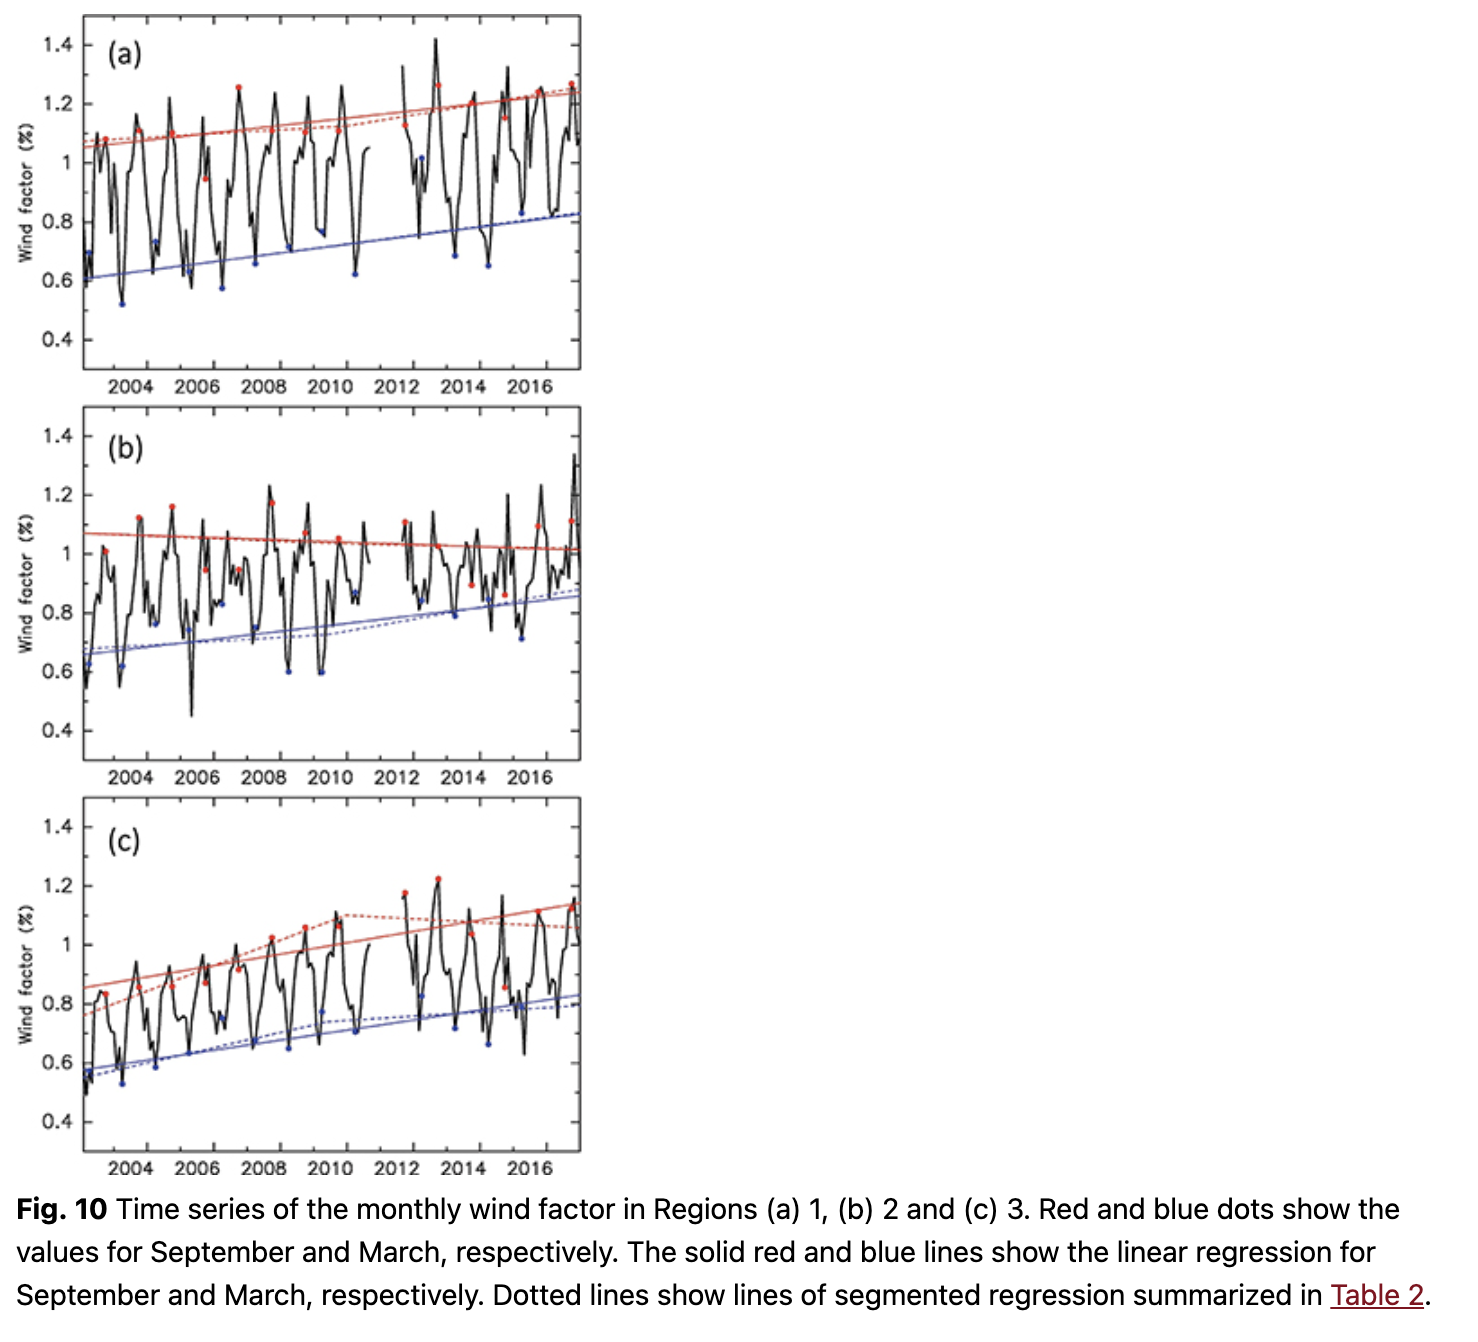
Each monthly wind factor value was calculated from data with a squared correlation coefficient larger than 0.36 (Fig. 10, Table 1). The trend in the wind factor had a significant positive value in March in all three regions: 0.147%/decade, 0.134%/decade and 0.171%/decade for Regions 1, 2 and 3, respectively. Though the positive trend in September is seen in Regions 1 and 3, it is not clear in Region 2 (Laptev and East Siberian seas). In Region 1, the trend in both winter and summer increased steadily from 2003 to 2011 and remained almost flat thereafter until 2017. Region 2 was characterized by a large interannual variability of the wind factor. The wintertime wind factor changed particularly from year to year. The wind factor in Region 3 generally increased, although the trend became less clear after 2010. To find the break point of the trend line, we applied segmented regression to the wind factor (Fig. 10, Table 2). Stopping of the increase trend of the wind factor is significant only in Region 3. The break points of the trend lines are estimated to have occurred in about 2010. In March in Region 3, the trend before the change was about three times that after the change. The change of the long-term trend in the region is more obvious in summer. Before the break point, the increase rate was 0.0425% per year, but after the change, the wind factor showed a negative trend at a rate of -0.0118% per year.
Table 1 Linear trend of the wind factor in each region by a simple linear regression (%/year) in March and September, with the 95% confidence interval given. | ||||
Month | Region |
| ||
1 | 2 | 3 |
| |
March | 0.0147 ± 0.0059 | 0.0134 ± 0.0051 | 0.0171 ± 0.0035 |
|
September | 0.0125 ± 0.0038 | -0.0039 ± 0.0054 | 0.0193± 0.0055 |
|
Table 2 Increase rates in the wind factor in three regions by segmented regression (%/year) for March and September. | ||||
Region | Month | Break point | Trend before break point | Trend after break point |
1 | March | 2010 | 0.0079 | 0.0171 |
September | 2010 | 0.0150 | 0.0151 | |
2 | March | 2010 | 0.0087 | 0.0187 |
September | 2010 | -0.0030 | -0.0048 | |
3 | March | 2010 | 0.0251 | 0.0091 |
September | 2010 | 0.0425 | -0.0118 | |
Summary and discussion
In this study, seasonal and interannual changes in factors relating sea-ice motion to wind were investigated. The seasonal variability of the wind factor, the turning angle and the correlation coefficient were examined using satellite-derived daily sea-ice motion. The general characteristics of these values are consistent with previous researches. In summer, the wind factor becomes larger in the Beaufort Sea, East Siberian Sea and central Arctic Ocean. Generally, the factor decreases in the winter season. This change is probably due to the seasonal change of the internal stress of sea ice (e.g., Steele et al. 1997), which is related to the sea-ice concentration and thickness. The turning angle in all seasons differs regionally, probably because of the difference in the mobility of sea ice due to variations in its thickness (e.g., Park & Stewart 2016). The turning angle moves from a direction parallel to the geostrophic wind to the right with respect to the wind. The correlation coefficient between the ice motion and wind shows the same seasonal pattern as the wind factor, tending to be larger in summer than in winter.
Kimura et al. (2013) estimated the root mean square error in the daily ice velocity of our data at about 1.4 cm/s. There should be some uncertainties in the derived wind factor and turning angle, especially due to the error in the ice velocity data. However, quantifying the uncertainties is very difficult. As for the interannual change focused in this study, we consider the year-to-year bias to be negligible, because the ice velocity is calculated using the same method based on the data observed by almost the same sensors throughout the study period.
Across almost the whole Arctic, the wind factor has a clear increasing long-term trend in all seasons. Increase of the wind factor leads to the increase of sea-ice outflow from the Arctic Ocean (Rampal et al. 2011) and results in the ice thinning (Langehaug et al. 2013). However, the increasing trend of the wind factor slowed or stopped around 2010. This slowdown is evident especially at high latitudes, in other words, areas of thick multi-year ice. Kwok (2018) analysed the Arctic ice thickness observed from satellite altimeters and showed that the declining trend in ice thickness stopped around 2012. Tilling et al. (2018) analysed the satellite altimeter data and showed that the Arctic sea-ice thickness has not decreased since 2011. These studies show that the stopping of the decreasing trend of the ice thickness is significant in the multi-year ice area. The slowdown or cessation of the increasing trend in the wind factor is probably caused by the stopping of the trend in the multi-year ice thickness because it is significant only in the high-latitude region (Region 3).
Acknowledgements
The authors thank the Arctic Data Archive system for the gridded AMSR-E and AMSR2 data. Some parts of the regression calculation were conducted by a package in R, and the figures were produced by GFD Dennou Library. The authors also thank Leonie Seabrook, PhD, from Edanz Group (www.edanzediting.com/ac) for editing a draft of this manuscript.
References
- Aagaard K. & Coachman L.K. 1968. The East Greenland Current north of Denmark Strait: part I. Arctic 21, 181–200, doi: 10.14430/arctic3262
- Bourke R.H. & Garrett R.P. 1987. Sea ice thickness distribution in the Arctic Ocean. Cold Regions Science and Technology 13, 259–280, doi: 10.1016/0165-232X(87)90007-3.
- Cavalieri D.J. & Parkinson C.L. 2008. Arctic sea ice variability and trends, 1979–2006. Journal of Geophysical Research—Oceans 113, C07003, doi: 10.1029/2007JC004558.
- Dee D.P., Uppala S.M., Simmons A.J., Berrisford P., Poli P., Kobayashi S., Andrae U., Balmaseda M.A., Balsamo G., Bauer P., Bechtold P., Beljaars A.C.M., van de Berg L., Bidlot J., Bormann N., Delsol C., Dragani R., Fuentes M., Geer A.J., Haimberger L., Healy S.B., Hersbach H., Hólm E.V., Isaksen L., Kållberg P., Köhler M., Matricardi M., McNally A.P., Monge-Sanz B.M., Morcrette J.J., Park B.K., Peubey C., de Rosnay P., Tavolato C., Thépaut J.N. & Vitart F. 2011. The ERA-Interim reanalysis: configuration and performance of the data assimilation system. Quarterly Journal of the Royal Meteorological Society 137, 553–597, doi: 10.1002/qj.828.
- Hibler W.D. III. 1986. Ice dynamics. In N. Untersteiner (ed.): The geophysics of sea ice. Pp. 577–640. New York: Springer.
- Kimura N., Nishimura A., Tanaka Y. & Yamaguchi H. 2013. Influence of winter sea ice motion on summer ice cover in the Arctic. Polar Research 32, article no. 20193, doi: 10.3402/polar.v32i0.20193.
- Kimura N. & Wakatsuchi M. 2000. Relationship between sea-ice motion and geostrophic wind in the Northern Hemisphere. Geophysical Research Letters 27, 3735–3738, doi: 10.1029/2000GL011495.
- Kwok R. 2018. Arctic sea ice thickness, volume, and multiyear ice coverage: losses and coupled variability (1958–2018). Environmental Research Letters 13, article no. 105005, doi: 10.1088/1748-9326/aae3ec.
- Kwok R., Spreen G. & Pang S. 2013. Arctic sea ice circulation and drift speed: decadal trends and ocean currents. Journal of Geophysical Research—Oceans 118, 2408–2425, doi: 10.1002/jgrc.20191.
- Langehaug H., Geyer F., Smedsrud L. & Gao Y. 2013. Arctic sea ice decline and ice export in the CMIP5 historical simulations. Ocean Modelling 71, 114–126, doi: 10.1016/j.ocemod.2012.12.006.
- Overland J.E. & Pease C.H. 1988. Modeling ice dynamics of coastal seas. Journal of Geophysical Research—Oceans 93, 15619–15637, doi: 10.1029/JC093iC12p15619.
- Park H.-S. & Stewart A.L. 2016. An analytical model for wind-driven Arctic summer sea ice drift. The Cryosphere 10, 227–244, doi: 10.5194/tc-10-227-2016.
- Pease C.H. & Salo S.A. 1987. Sea ice drift near Bering Strait during 1982. Journal of Geophysical Research—Oceans 92, 7017–7126, doi: 10.1029/JC092iC07p07107.
- Rampal P., Weiss J., Dubois C. & Campin J.M. 2011. IPCC climate models do not capture Arctic sea ice drift acceleration: consequences in terms of projected sea ice thinning and decline. Journal of Geophysical Research—Oceans 116, C00D07, doi: 10.1029/2011JC007110.
- Rigor I.G., Wallace J.M. & Colony R.L. 2002. Response of sea ice to the Arctic Oscillation. Journal of Climate 15, 2648–2668, doi:10.1175/1520-0442(2002)015<2648:ROSITT>2.0.CO;2.
- Serreze M.C., Barry R.G. & McLaren A.S. 1989. Seasonal variations in sea ice motion and effects on sea ice concentration in the Canada Basin. Journal of Geophysical Research—Oceans 94, 10955–10970, doi: 10.1029/JC094iC08p10955.
- Simizu D., Oshima K.I., Ono J., Fukamachi Y. & Mizuta G. 2014. What derives the southward drift of sea ice in the Sea of Okhotsk? Progress in Oceanography 126, 33–43, doi: 10.1016/j.pocean.2014.05.013.
- Steele M., Zhang J., Rothrock D. & Stern H. 1997. The force balance of sea ice in a numerical model of the Arctic Ocean. Journal of Geophysical Research—Oceans 102, 21061–21079, doi: 10.1029/97JC01454.
- Thomas D. 1999. The quality of sea ice velocity estimates. Journal of Geophysical Research—Oceans 104, 13627–13652, doi: 10.1029/1999JC900086.
- Thorndike A.S. & Colony R. 1982. Sea ice motion in response to geostrophic winds. Journal of Geophysical Research—Oceans 87, 5845–5852, doi: 10.1029/JC087iC08p05845.
- Tilling R.L., Ridout A. & Shepherd A. 2018. Estimating Arctic sea ice thickness and volume using CryoSat-2 radar altimeter data. Advances in Space Research 62, 1203–1225, doi: 10.1016/j.asr.2017.10.051.


