The economic and social drivers of renewable energy development in OECD countries


Опубликована Окт. 9, 2020
Последнее обновление статьи Дек. 12, 2022
Abstract
There are continuous research and practical interest to combine different renewable sources within one Smart Grid network. The paper aims to estimate the influence of key economic and social drivers of renewable energy and Smart Grid promotion in OECD member countries. The random effect of the generalized least squares method was used to estimate the empirical model based on the World Bank, OECD, Heritage Foundation, and World Energy Council datasets for a panel of 36 OECD counties. For the empirical estimation, the dependent variables considered are energy renewable electricity output and energy trilemma index, taken as two proxies for Smart Grid development. The results suggest that an increase in GDP p. c. in national economies by 10,000 USD leads on average to a 3.9% decrease in renewable electricity output during 2001–2015. The richer the society, the less renewable energy sources were used for power generation in a group of OECD countries. The last is also supported by the fact that gross fixed capital formation treated as a percentage value of GDP is negatively correlated with structural changes in renewable energy output. The empirical conclusion is that during the study period, OECD countries were mainly oriented to economic growth, which was achieved by consuming non-renewable energy resources, and limited attention was paid to sustainability and Millennium Development Goals. T he paper provides policy recommendations for Smart Grid development and points in the future research within OECD countries
Ключевые слова
Sustainability, development, Smart Grid, energy efficiency, renewable electricity, energy trilemma, OECD
INTRODUCTION
The challenges of contemporary social and economic development require energy and related services on growing scales. All national economies are developing renewable and non-renewable energy sectors to meet the social needs (lighting, cooking, spatial comfort, movement, communication, etc.) and serve production processes. Simultaneously, the important thing is to ensure the balance of maintaining economic stability and safe operation of the energy supply system. The promotion of the renewable energy sector is a key priority of long-run sustainability and economic prosperity. The creation of a solid energy system based on many small renewable energy sources, is impossible without reliable Smart Grid networks. Unsettled energy markets and the growing share of renewable energy sources (RES) determine the need for structured metering of electricity flows. The electricity power network currently adopts the traditional methods, which are to be changed by the Smart Grid (SG). As a real-time interactive architecture of a more sustainable and efficient nature, the SG ensures both operation of the system and the relationship between customers and network operators through automation and information technologies (IT) use.
As today’s world’s most developed technologies are wind and solar energy, which are completely dependent on the sunlight and the movement of air masses, a problem of time balancing for renewable and convenient energy capacities is emerging. Given the environmental benefits and inexhaustible potential of wind and solar energy, progressive humanity’s focus on sustainable development makes re-use an unconditional priority over the energy generated with fossil fuel combustion.
However, the discreteness of green energy generation raises the issue of reliable energy supply to consumers by the instantaneous connection of convenient power objects in times of lack of sufficient sunlight and wind for RE plants. For this purpose, the balancing should be carried out in real-time and requires a concerted effort of RE and convenient power capacities of individual regions and the whole country and even national energy grids of several states united into a single energy system. This issue can be solved by introducing and operating IT in the power sector, which allow monitoring the real-time volume of electricity generation in the united energy system and its consumers’ needs, as well as ensuring their compliance by balancing the capacities of renewable and convenient energy through the formation of local, national or international Smart Grids. Besides, Smart Grid systems allow the accumulation of energy surpluses generated by RE objects but not consumed. They provide the creation of powerful energy conservation systems and direct power surpluses to consumers at peak load moments to maximize energy output from RES and minimize energy losses during its storage.
Another aspect of the close relationship between the RE development and Smart Grid is the gradual reorientation of national energy systems to decentralized energy supply. It results in the development of small local objects on RES and the need to integrate them into the Smart Grids to provide high-quality and reliable electricity supplies for both household and industrial consumers. Such Smart Grids are particularly relevant for remote mountainous and rural areas where RE can form a local grid basis. Thus, the RE development in the countries leads to the deployment of national and local Smart Grids. In this regard, the dynamics of the share of RE in the country’s total energy mix can serve as an indicator of the SG development.
1. LITERATURE REVIEW
The United Nation’s 2030 Agenda for Sustainable Development identified 17 different Sustainable Development Goals (SDGs), representing important references for the current global community in facing different international complex challenges (United Nations, 2015). One of these global challenges is energy, which plays a vital and fundamental role in achieving the primary needs regarding the socio-economic development of different countries and international security and the protection of the environment. To solve the global environmental issues, renewable energy sources have to be used in extended scales while reducing fossil fuel energies. The discreteness of green energy generation necessitates the promotion of Smart Grid components. Smart Grid becomes important while deploying the renewable energy (RE) sector. The development of green energy leads to replacing traditional power facilities with their alternatives, which often depend on natural conditions. According to Kolokotsa (2016), the Smart Grid components’ real-time interactive infrastructure allows combining technologies and adapting them in digital form for the ever-changing energy demand of users.
Substantial scholarly interest in sustainability has continued to grow as greater interest in this topic is stemming from policymakers and businesses across countries (Balefcentis & Streimikiene, 2019; Galväo et al., 2017; Zhao et al., 2017; Chodakowska & Nazarko, 2017; Simionescu et al., 2017). According to the U.S.A. Energy Department (EAC, 2008), the operation of the Smart Grid is based on the use of digital technologies in order to increase the safety and efficiency of electrical systems. Thus, it ensures that the electricity flow comes from its large generation sources to transmission systems, and finally to end-users. In general, the Smart Grid promotes an increase in amounts of energy to be distributed more efficiently and with smaller losses. Jenkins et al. (2015) define an SG as “an electricity/energy network that smartly links all stakeholders to deliver sustainable, cost-efficient, and technically secure electricity supplies.” Generators that transfer electricity to end consumers should aim to provide sustainable, economic, and safe electricity supplies. Pront-van Bommel (2011) points out that SG systems target all three- core objectives (sustainable, economic, and safe electricity supplies) by promotion integration of centralized and decentralized (e.g., RES wind, solar, thermal) power generation stations into united electricity networks. The SG is to equalize both energy supplies and demand through automatic networking with power generations and consumers. The last one would reduce the electricity load, and Smart Grids should avoid expensive network costs.
Sanchez-Hidalgo and Cano (2018) have conducted a comprehensive analysis of Smart Grid applications to available technologies, tools, and techniques and proposed that SG operation is more economical and technically sound and machine-autonomous to the progress of artificial intelligence. Kolokotsa (2016) has investigated that SG can unite RES, storage systems (SS), construction sector, and energy distribution into the single network based on the demand/consumer response. Besides, consumers can take part as responsible agents in the electricity market, enabling them to influence electricity/energy bills. Therefore, the SG can “create a revolution in the construction sector.”
In the early literature (the end of the last century, e.g., Hughes, 1983), the Smart Grid ideas were used as a computerization concept of electricity generation systems to promote more environmentally friendly cooperation. The SG included smart metering, smart energy management systems by consumers, interactive demand response, and integrating electro cars to the energy system. Other authors like Bale et al. (2015) and Shindina et al. (2018) concluded that the SG changes for the energy system have to consider technological factors and deep interactions between social, institutional, and technological factors that have to be considered. Other approaches are focusing on climate change and CO2 emissions. For example, Kylili and Fokaides (2015) proposed zero energy buildings as material constructions with zero greenhouse gas balance. Thus, the promotion of RES is important for zero energy buildings. It is also stated that smart energy operation is only possible through smart appliances with sophisticated energy storage sub-systems. According to Kolokotsa (2016), the zero energy buildings mentioned above must work in synergy with the SG to reduce the electricity infrastructural pressure. Farhangi (2017) relates Smart Grid to capacities, which poses new abilities, including peak smoothing, electricity conservation, and integration of RES. Lund (2007) has empirically estimated that the demand for RE has increased drastically since the beginning of the 21st century, and RE takes 19% of the world electricity out of which hydroelectric power made 83% in 2006 and 58% in 2017, according to IRENA (2019). Hepbasli (2008) indicates that the shift to Smart Grid technology is necessary for green security since RE and distributed generation are not related to fossil fuels’ export. The growing RE generation is the key challenge for promoting SG systems, and the distributed generation promotion is a key factor of green security growth. That is the main benefits related to Smart Grid are as follows (El-Hawary, 2014; Park et al., 2017; Bari et al., 2014; Daki et al., 2017; Amin, 2011):
- more economical transmission of electricity;
- peak demand leveling and reduction in overall electrical rates;
- integration of all RES as micro-grids to large- scale systems;
- faster addressing to interruptions in electrical services through rerouting;
- increased economic and environmental security through better grids adaptability to disasters and/or attacks;
- creations of new markets, products, and services.
Furthermore, the formation of an operational framework is needed to control Smart Grid projects by creating sufficient economic returns for the electricity generation. To shift Smart Grid to an environmental base, the constant flow of investment to proper technologies related to the Smart Grid should be guaranteed. A review of scientific literature on measuring the Smart Grid progress has shown no direct indicators, which could measure the Smart Grid achievements of a specific country or region. Ideally, the digital grid infrastructure share could measure the Smart grid expanding; however, there is no such data available. A smart meter spread as an energy metering device could be considered an indirect indicator of Smart Grid achievements; however, its application is not thoroughly discovered. Researchers estimate the customers’ expectations and perception of smart meters (for example, Chou et al., 2015). Noussan et al. (2018) have proposed to use several indicators to measure the performance of electricity generation based on Smart Grid, such as primary energy consumption, percentage of RE generation, and carbon dioxide emissions. Leiva et al. (2016) proposed the specific policies for smart metering infrastructure promotion in Europe and worldwide. Hossain et al. (2016) have stated that the RE sector could efficiently exist under the Smart Grids operation. It is Smart Grids development that it is a necessary condition for RE sector growth. Considering that smart meters are often synonymous with energy efficiency and sustainable development, as stated by Chou et al. (2015), it was chosen two sustainable development indicators to measure the Smart Grid progress for this study: 1) energy trilemma index (TI, which is calculated by World Energy Council), 2) renewable electricity output (REO). Using these proxies, it is expected to find solid factors, which could explain the progress in Smart Grid achievements. One of our research hypotheses is that the energy efficiency of economic development and structural change towards a more service-based economy could be a significant source of Smart Grid accomplishments. Everett et al. (2010), Kasperowicz and Streimikiene (2016) as well as Sotnyk and Kulyk (2014) have linked economic growth and environment, pointing at environmental policy in natural resources management. The authors have found that the relationships between gross domestic product and the environment are complex. Therefore, it is expected that economic prosperity is a factor that could contribute the positive Smart Grid achievements. Common EU energy policy and EU-20 Energy Strategy can be considered strong policy instruments for Smart Grid improvements. Thus, according to EU-20 Energy Strategy (EC, 2010), European Union needs to reduce the CO2 emissions by 20% by 2020 and increase the share of RE generation to at least 20%, having achieved energy savings of at least 20%, in particular, by developing Smart Grids. Kahraman et al. (2015) investigated that the Smart Grid’s modernization includes upgrading the transmission infrastructure provides electricity for the wider public and develops higher operational efficiency.
There are several institutional indicators, which could influence the Smart Grid achievements. The Index of Economic Freedom, published by the Heritage Foundation, provides information on institutional factors such as property rights, government integrity, tax burden, government spending, business, and labor freedom (Miller et al., 2019). It is expected that institutional progress and economic freedom are factors positively influencing Smart Grid development. One of the relevant issues related to Smart Grids is the development of standards to enhance their technological improvement and estimate their promotion’s economic stimulus.
Summarizing the literature review, it should be concluded that the Smart Grids are modernized global systems that enable the integration of technologies, equipment/ data services to promote more efficient, secure, and sustainable energy generation, distribution, and consumption.
2. AIMS
The research aims to determine the key drivers of renewable energy sector development and Smart Grid promotion for the OECD counties. Concerning the aim of the research, it stated the following tasks:
- to estimate the influence of GDP per capita in national economies and energy efficiency improvements on promotion RE integration into Smart Grid-Energy Storage;
- to estimate the influence of gross fixed capital formation, high technological export on the RE sector and Smart Grid development;
- to determine the oil price influence of RE sector improvement and Smart Grid development.
3.METHODOLOGY AND DATA DESCRIPTION
The research data include 36 OECD countries, except Columbia, which became a member state only on 28 April 2020 (OECD countries, 2020). One of the Smart Grid definitions is the multisource collection of energy within one system (Zame et al., 2018). To our mind, the REO indicator could be used as a proxy of Smart Grid achievements as it was explained in section 1. According to the World Bank statistics, the REO is measured as the percentage of total electricity output. As described in section 2, two indicators measure the Smart Grid improvements: energy trilemma index and renewable electricity output. TI ranks all countries relating to the three dimensions of energy sustainability, such as energy security/equity and environmental sustainability (WEC, 2019). According to the World Energy Council, TI encompasses the public’s multiple stakeholder relations, private sector, government, environmental indicators, consumer concerns, etc. (WEC, 2019). All mentioned characteristics of TI (energy security/equity, and environmental sustainability) are related to Smart Grid technologies. From the methodological point of view, the panel data structure is normally could be presented as follows:
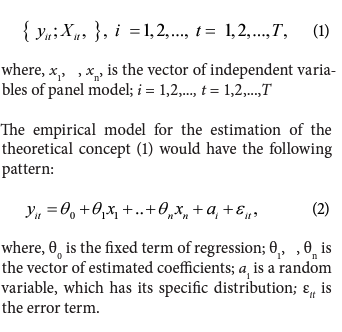
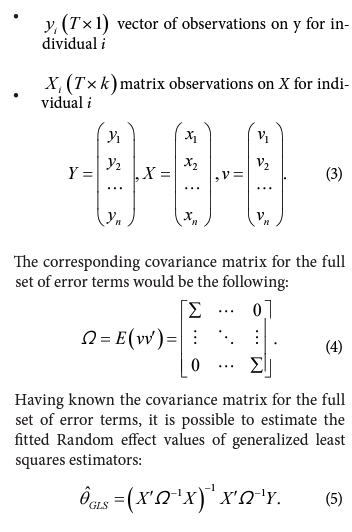
Given the above concept of random effect values of generalized least squares estimators (5) and using the World Bank, OECD, and Heritage Foundations datasets (World Bank, 2020; OECD, 2020; Miller et al., 2019), it is built regression models to estimate the influence of key drivers on the renewable energy sector and Smart Grid development for a list of 36 OECD counties. Having TI and REO as two proxies for Smart Grid development, one is limited in the time period for both indicators. For example, according to the World Energy Council (WEC, 2019), TI data is available only starting in 2014. On the other hand, the relative information from the World Bank is available only up to 2015. For that reason, it is considered a panel of 36 counties during the two years (2014-2015) for TI being an indicator of Smart Grid. When REO is used as a proxy for Smart Grid development, a more extended model is used with many influencing factors, and the data set is limited by 2001-2014. The extended model, which is built for the REO and TI indicators, is as follows:

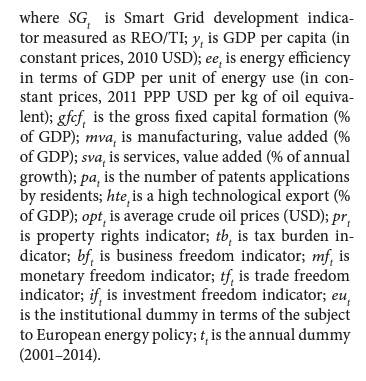
To identify key drivers of Smart Grid development that should be included in the economic models, it was analyzed the main determinants that influence REO according to the research results described in the literature review section. Therefore, GDP per capita, GDP per 1 kilogram of oil as a proxy for energy efficiency, manufacturing, value-added and services, value-added and property rights, government integrity, tax burden, government spending, business freedom, and labor freedom are used in the models. European energy policy dummy was added for EU members; this indicator should serve as a proxy to control for the variability of 36 OECD member states. The EU energy policy indicator is zero for all non-EU states, and unity for all EU members. Gross fixed capital formation as a proxy for fixed investment is included in the model, having expected that the last one influences the RE sector and Smart Grid enhancing. High technological export and patent applications by residents (taken as proxies for innovations) are also expected to be drivers for the RE sector and Smart Grid improvements.
4. RESULTS AND DISCUSSION
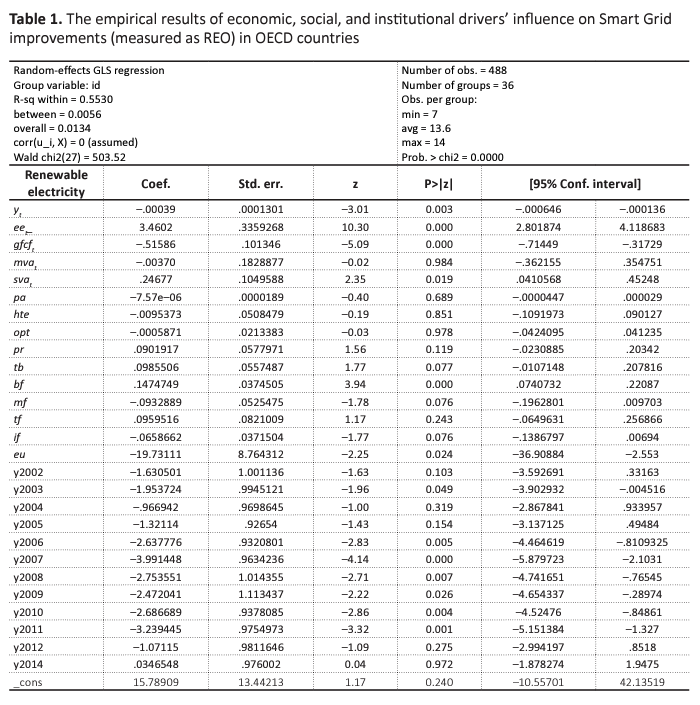
Having described the data sample and methodology, let us proceed with the empirical estimation. The first model built is for REO as a dependent variable with the estimated influence of discussed dependent variables. The model results describing the influence of economic, social, and institutional indicators on REO as a proxy of Smart Grid development are presented in Table 1.
It is seen from Table 1 that using REO as a proxy for Smart Grid achievements, there is a small and negative influence of GDP per capita on the dependent variable. Thus, an increase in GDP per capita by 10,000 US$ leads on average (in a group of OECD countries) to a 3.9% decrease in REO. That is the richer the society, the less RES were used for power generation in a group of OECD countries. One of the possible explanations is that richer societies can afford themselves to pay less attention to present environmental concerns and raise prices on non-renewable energy resources.
Considering the indicator of energy efficiency, it is seen that the more energy-efficient the economy, the higher level of REO it has. Thus, an increase in GDP per unit of energy use by 1 USD leads on average (in a group of OECD countries) to a 3.4% increase in REO. The last one means that more energy-efficient economies are also more environmentally friendly.
The relative indicator of gross fixed capital formation is negatively correlated with structural changes in REO. An increase in gross fixed capital formation by one percentage point reduces REO by 0.5%. This could be explained by the fact that gross fixed capital formation (initially known as a gross domestic fixed investment at the World Bank data) covers a wide range of investment directions, including land improvements; machinery, and/ or equipment purchases/construction, the activities of the building (roads, railways, schools/kin- dergartens, offices, hospitals, private houses, and commercial and industrial constructions. Among the mentioned investment directions, there are no directly related to REO.
Raise in services, value added (% of annual growth) is associated with an increase in REO. The business freedom indicator appeared to be statistically significant, being positively correlated with REO increase.
Improvements in institutional factors of property rights, tax burden, monetary freedom, trade freedom, investment freedom appeared to be not statistically correlated with RE development. Besides, among the insignificant factors are manufacturing, value added (% of GDP), patent applications by residents, high-technology exports (as % of GDP), and oil prices. The EU institutional dummy appeared to be negatively correlated with REO for the OECD economies.
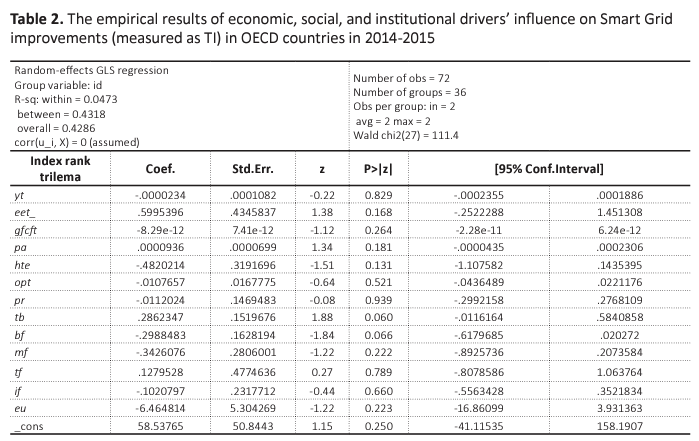
TI data are available only starting 2014 since when two data sets were merged (World Bank and WEG Energy Trilemma data), the balanced data appeared to be only for the period 2014- 2015. Table 2 presents the results for model 6, describing the influence of economic, social, and institutional indicators on TI as a proxy of Smart Grid development.
It is seen from Table 2 that while using TI as a proxy for Smart Grid achievements, there is a positive influence of the tax burden indicator on TI improvement. Progress in patent applications has a positive but insignificant influence on TI growth. The other factors are not appeared to be statistically relevant. These few statistically significant results could be explained by the small data sample and a limited time period. Therefore, several additional years are needed to receive more statistically sound results to provide policy recommendations.
In order to complete the analysis of the drivers encouraging RE generation, which is associated with Smart Grid in the study, it was considered how the similar indicators (independent variables in the model (6) influence the electricity generation from non-renewable energy using the indicator of electricity production from oil, gas, and coal. The empirical results are presented in Table 3.
It is seen from Table 3 that using electricity production from oil, gas, and coal sources (% of total) as a dependent variable, and there is a small and positive influence of GDP per capita on non-renewable electricity output. Hence, an increase in GDP per capita by 10,000 USD leads on average (in a group of OECD countries) to a 3.2% increase in non-renewable electricity output. The richer the society, the more non-renewable energy generation sources were used during 2001-2014 in a group of OECD countries. One possible explanation is that during the analyzed period, the OECD countries were not sufficiently motivated to invest in renewable electricity generation and used the available convenient power plants more intensively.
The relative indicator of gross fixed capital formation measured is positively correlated with structural changes in non-renewable electricity output. An increase in gross fixed capital formation by one percentage point leads to an increment of non-renewable electricity output by 0.41%. This could be explained by the fact that investment in machinery, equipment purchases/ construction were mainly in the non-renewable energy sector.
Improvements in manufacturing, value added (% of GDP) are associated with an increase in non-renewable electricity output. High technological export as the percentage of GDP has a positive influence on electricity generation from oil, gas, and coal sources increase, and 10% structural growth in high technological export leads to a 1.7% increase in non-renewable electricity output. The last could be explained by the fact that during the studied period of 2001-2014, OECD economies were mainly oriented at traditional economic growth indicators paying insufficient attention to sustainability and Millennium Development Goals achievements. An improvement in property rights’ institutional factors increases the non-renewable electricity output, while progress in monetary and trade freedom decreases it. These results also support our hypothesis about the OECD country’s orientation to the traditional economic growth providing. Moreover, the results indirectly suggest that the easiest way to achieve economic growth is to consume non-renewable energy resources. Having this hypothesis, it is understandable that property rights progress indirectly promotes economic growth and, finally, the consumption of non-renewable energy resources. On the contrary, the progress in monetary and trade freedom promotes the development of the economy’s service sector, which is less resource dependent. For that reason, the non-renewable electricity output decreases.
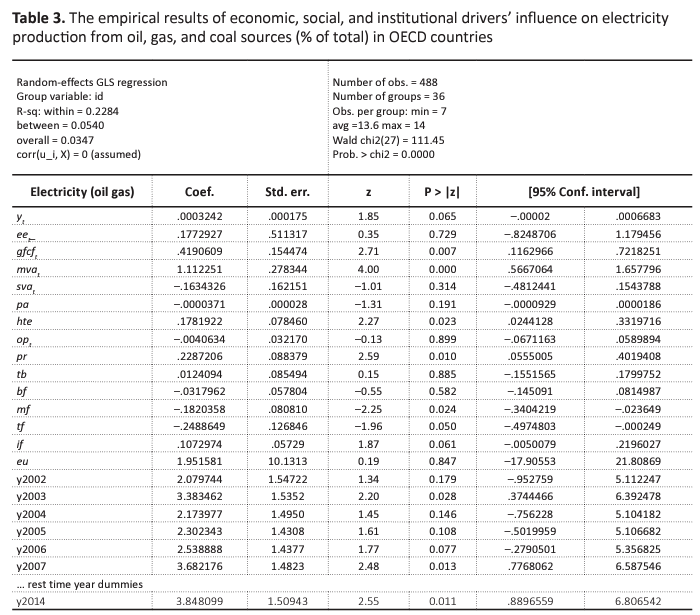
Energy efficiency, services, value-added (annual % growth), patent applications by residents, oil prices, tax burden, business freedom, investment freedom, and the EU institutional dummy appeared not statistically correlated with non-renewable energy development. A more comprehensive analysis is needed to explain the insignificance of the parameters mentioned above, which could be a field for future research and discussions.
5. POLICY RECOMMENDATIONS
The energy trilemma concept’s main policy direction is to promote the fast energy generation/consumption transition to decentralized, decarbonized, and digitalized energy systems. According to the World Energy Council’s last available report, in 2018, many countries were managing the three-dimensional tasks efficiently and achieving top scores. The top ten TI nations were Denmark, Switzerland, Sweden, the Netherlands, the United Kingdom, Slovenia, Germany, New Zealand, Norway, and France (WEC, 2019). All mentioned leading countries belong to the Organization for Economic Co-operation and Development (OECD). For that reason, the whole OECD sample was taken into consideration to analyze the key drivers of Smart Grid achievements by a specific country or region.
Therefore, based on the results of the study, it is reasonable to formulate the following policy recommendations:
- the energy efficiency policy should continue to be developed and strengthened as it contributes to increasing the use of RE and Smart Grids deployment while reducing fossil fuel combustion. At the same time, it would be advisable to strengthen the energy efficiency requirements for energy generation, making them a key component of European and other OECD countries energy policy;
- taking into account the requirements of achieving sustainable development, governments need to regulate economic growth and the increment of nations’ energy needs in such a way as to avoid rebound effects, which can be provided under the state support of RE and Smart Grids deployment;
- it is advisable to revise the investment policy of the real sector of national economies and reorient it to encourage the investment in high-tech ecologically friendly and energy-efficient industries with an emphasis on the rational use of energy resources and the transition to RES as well as on the development of a service economy, dematerialization of production and consumption;
- it is expedient to increase the influence of institutional factors in a particular business, trade, and monetary freedom on economic processes, facilitating the gradual transition from conventional energy generation to the preferential use of green energy.
CONCLUSION
The research results proved the negative effect of GDP per capita growth on the deployment of RE and Smart Grid (measured as REO). Instead, it has been found that GDP per capita positively influences the development of non-renewable energy and constrains the RE sector expansion. It is possible to conclude that the richer societies are, the less motivated they are to develop and apply green energy technologies since they can afford to use limited fossil fuels and spend money on eliminating the negative environmental consequences of fuel combustion. The research has added new knowledge on OECD country’s renewable sector promotion and related policy recommendations. Besides, the research proved no positive impact of gross fixed capital formation on the deployment of RE and Smart Grid, while this indicator has a negative impact on REO. It is worth to summarize that the RE sector’s share in the selected OECD countries is still small. Therefore, investments are mainly directed to the conventional energy sector and new technologies preferably developed for this sector. The main conclusion is that the development of the service economy contributes to the dematerialization of economic systems, stimulates the energy use reduction and energy efficiency growth through the RE development. Simultaneously, the increase in industrial production scale leads to an increment of the consumption of conventional energy, which is generated with the predominance of traditional energy technologies.
AUTHOR CONTRIBUTIONS
Conceptualization: Leonid Melnyk, Hanna Sommer.
Data curation: Oleksandra Kubatko, Svitlana Fedyna.
Formal analysis: Leonid Melnyk, Oleksandra Kubatko.
Funding acquisition: Leonid Melnyk, Hanna Sommer, Oleksandra Kubatko, Marcin Rabe, Svitlana Fedyna.
Investigation: Leonid Melnyk, Marcin Rabe.
Methodology: Hanna Sommer, Oleksandra Kubatko, Svitlana Fedyna.
Project administration: Oleksandra Kubatko.
Resources: Marcin Rabe.
Software: Svitlana Fedyna.
Supervision: Leonid Melnyk.
Validation: Svitlana Fedyna.
Visualization: Svitlana Fedyna.
Writing - original draft: Leonid Melnyk, Hanna Sommer, Svitlana Fedyna.
Writing - review & editing: Leonid Melnyk, Oleksandra Kubatko, Marcin Rabe, Svitlana Fedyna.
ACKNOWLEDGMENTS
Comments from the Editor and anonymous referees have been gratefully acknowledged. Leonid Melnyk gratefully acknowledges financial support from the Ministry of Education and Science of Ukraine (0118U003578). Oleksandra Kubatko gratefully acknowledges financial support from the Ministry of Education and Science of Ukraine (0119U100766) and National Research Foundation of Ukraine (2020.01/0135).
REFERENCES
- Amin, S. M. (2011). Smart grid Overview issues and opportunities. Advances and challenges in sensing modeling simulation optimization and control. European Journal of Control, 17(5-6), 547-567.
- Bale, C. S. E., Varga, L., & Foxon, T. J. (2015). Energy and complexity: new ways forward. Applied Energy, 138, 150-159.
- Baležentis, T., & Štreimikienė, D. (2019). Sustainability in the Electricity Sector through Advanced Technologies: Energy Mix Transition and Smart Grid Technology in China. Energies, 12(6), 1142.
- Bari, A., Jiang, J., Saad, W., & Jaekel, A. (2014). Challenges in the Smart Grid Applications: An Overview. International Journal of Distributed Sensor Networks, 10(2), 1-11.
- Chodakowska, E., & Nazarko, J. (2017). Environmental DEA method for assessing the productivity of European countries. Technological and Economic Development of Economy, 23(4), 589-607.
- Chou, J.-S., Kim, C., Ung, T.-K., Yutami, I G. A. N., Lin, G.-T., & Son, H. (2015). Cross-country review of smart grid adoption in residential buildings. Renewable and Sustainable Energy Reviews, 48, 192-213.
- Daki, H., El Hannani, A., Aqqal, A., Haidine, A., & Dahbi, A. (2010). Big Data management in smart grid: concepts, requirements, and implementation. Journal of Big Data, 4(1), 1-19.
- Electricity Advisory Committee (EAC). (2008). Smart Grid: Enabler of the New Energy Economy (Report) (38 p.).
- El-Hawary, M. E. (2014). The Smart Grid – State-of-the-art and Future Trends. Electric Power Components and Systems, 42(3-4), 239-250.
- European Commission (EC). (2010). Energy 2020: A strategy for competitive, sustainable, and secure energy (Communication from the Commission to the European Parliament, the Council, the European Economic, and Social Committee and the Committee of the Regions). Brussels.
- Everett, T., Ishwaran, M., Ansaloni, G. P., & Rubin, A. (2010). Economic growth and the environment (MPRA Paper No. 23585). University Library of Munich, Germany.
- Farhangi, H. (2017). Smart Grid. In Martin A. Abraham (Ed.), Encyclopedia of Sustainable Technologies (pp. 195-203). Elsevier.
- Galvão, J. R., Moreira, L., Gaspar, G., Vindeirinho, S., & Leitão, S. (2017). Energy system retrofit in a public services building. Management of Environmental Quality, 28(3), 302-314.
- Hansen, C. B. (2007). Generalized Least Squares Inference in Panel and Multilevel Models with Serial Correlation and Fixed Effects. Journal of Econometrics, 140(2), 670-694.
- Hepbasli, A. (2008) A Key Review on Exergetic Analysis and Assessment of Renewable Energy Resources for a Sustainable Future. Renewable and Sustainable Energy Reviews, 12(3), 593-661.
- Hossain, M. S., Madlool, N. A., Rahim, N. A., Selvaraj, J., Pandey, A. K., & Khan, A. F. (2016). Role of smart grid in renewable energy: An overview. Renewable and Sustainable Energy Reviews, 60(C), 1168-1184.
- Hughes, T. P. (1983). Networks of power: electrification in western society, 1880–1930 (483 p.). Baltimore: The Johns Hopkins University Press.
- International Renewable Energy Agency (IRENA). (2019). Renewable Energy Statistics 2019. Abu Dhabi.
- Jenkins, N., Long, C., & Wu, J. (2015). An Overview of the Smart Grid in Great Britain. Engineering, 1(4), 413-421.
- Kahraman, C., Kaya, I., & Cebi, S. (2009) A Comparative Analysis for Multiattribute Selection among Renewable Energy Alternatives Using Fuzzy Axiomatic Design and Fuzzy Analytic Hierarchy Process. Energy, 34(10), 1603-1616.
- Kasperowicz, R., & Štreimikienė, D. (2016). Economic growth and energy consumption: comparative analysis of V4 and the “old” EU countries. Journal of International Studies, 9(2), 181-194.
- Kolokotsa, D. (2016). The role of smart grids in the building sector. Energy and Buildings, 116, 703-708.
- Kylili, A., & Fokaides, P. A. (2015). European smart cities: The role of zero energy buildings. Sustainable Cities and Society, 15, 86-95.
- Leiva, J., Palacios, A., & Aguado, J. A. (2016). Smart metering trends, implications, and necessities: A policy review. Renewable, and Sustainable Energy Reviews, 55, 227-233.
- Lund, H. (2007). Renewable Energy Strategies for Sustainable Development. Energy, 32(6), 912-919.
- Miller, T., Kim, A. B., & Roberts, J. M. (2019). 2019 Index of Economic Freedom. The Heritage Foundation.
- Noussan, M., Roberto, R., & Nastasi, B. (2018). Performance indicators of electricity generation at the country level – The case of Italy. Energies, 11(3), 650.
- OECD. (2019). Member countries.
- Park, C., Kim, H., & Yong, T. (2017). Dynamic characteristics of smart grid technology acceptance. Energy Procedia, 128, 187-193.
- Pront-van Bommel, S. (2011). Smart energy grids within the framework of the third energy package. European Energy and Environmental Law Review, 20(2), 32-44.
- Sanchez-Hidalgo, M.-A., & Cano, M.-D. (2018). A survey on visual data representation for smart grids control and monitoring. Sustainable Energy Grids, and Networks, 16, 351-369.
- Shindina, T., Streimikis, J., Sukhareva, Y., & Nawrot, Ł. (2018). Social and Economic Properties of the Energy Markets. Economics & Sociology, 11(2), 334-344.
- Simionescu, M., Albu, L.-L., Szeles, M. R., & Bilan, Y. (2017). The impact of biofuels utilization in transport on sustainable development in the European Union. Technological and Economic Development of Economy, 23(4), 667-686.
- Sotnyk, I., & Kulyk, L., (2014). Decoupling analysis of economic growth and environmental impact in the regions of Ukraine. Economic Annals – XXI, 7-8(2), 60-64.
- United Nations (UN). (2015). Transforming our world: the 2030 Agenda for Sustainable Development.
- World Bank. (2019). Renewable electricity output (% of total electricity output).
- World Energy Council (WEC). (2019). World Energy Trilemma Index.
- Zame, K. K., Brehm, C. A., Nitica, A. T., Richard, C. L., & Schweitzer III, G. D. (2018). Smart grid and energy storage: Policy recommendations. Renewable and Sustainable Energy Reviews, 82(1), 1646-1654.
- Zhao, Q. R., Chen, Q. H., Xiao, Y. T., Tian, G. Q., Chu, X. L., Liu, Q. M. et al. (2017). Saving forests through development? Fuelwood consumption and the energy-ladder hypothesis in rural Southern China. Transformations in Business and Economics, 16, 199-219.


