Эта статья опубликована под лицензией Creative Commons и не автором статьи. Поэтому если вы найдете какие-либо неточности, вы можете исправить их, обновив статью.

The predictive power of comprehensive income and its individual components under IFRS


Paul Pronobis
Henning Zülch
Опубликована Фев. 14, 2011
Последнее обновление статьи Дек. 7, 2022
Эта статья опубликована под лицензией
")


Abstract
This study examines the predictive power of comprehensive income and its individual components within the homogenous institutional setting of German IFRS firms. First of all, the predictive power of income numbers is an attribute of high relevance for analysts as it reduces their forecast risks. Second, the standard setters are prominently referring to the importance of financial statements to assist their users in predicting the entity’s future cash flows and, in particular, their timing and certainty. Third, the examination of predictive power provides direct evidence on the relation between accounting information and future firm operating performance. The authors find no evidence that comprehensive income has a superior predictive power for future firm operating performance than net income. Further, the authors fail to find significant incremental predictive power of aggregated or individual components of other comprehensive income for subsequent periods of firm operating performance. The actuarial gains and losses on defined benefit pension obligations seem to merely add noise for the prediction of subsequent period’s net income and comprehensive income. In contrast, our analyses indicate that other comprehensive income components seem to have incremental predictive power beyond one period. Finally, the paper finds that the predictive power of net income and comprehensive income for future firm operating performance has deteriorated as a consequence of the IASB’s recent initiatives and actions
Ключевые слова
Other comprehensive income, predictability, earnings quality, Germany, operating cash flows
Introduction
Under current IFRS regulation, companies have to book certain transactions directly into equity instead of the income statement. These transactions are often referred to as ‘dirty surplus (non-all-inclusive) components of income for the period’. They mainly represent fair value changes in balance sheet accounts, and therefore, are transitory in nature. The dirty surplus components of income for the period are better known as other comprehensive income (OCI) and include such items as foreign currency translation adjustments (IAS 21.39[c]), unrealized gains (losses) on re-measuring available-for-sale (AfS) financial assets (IAS 39.55[b]), effective portion of gains and losses on hedging instruments in a cash flow hedge (IAS 39.95[a]), effective portion of gains or losses on hedging instruments of a net investment in a foreign operation (IAS 39.102), revaluation of property, plant and equipment (IAS 16.39), revaluation of intangible assets (IAS 38.85), actuarial gains (losses) on defined benefit pension obligations (IAS 19.938), and deferred tax effects on all items reported in OCI (IAS 12.61).
Other comprehensive income items are currently presented in the statement of changes in equity. However, the IASB is conducting a joint project with the FASB called “Financial Statement Presentation” which already resulted in a revised IAS 1 ‘Presentation of Financial Statements’ and has altered the location of other comprehensive income presentation as follows: For annual periods from 2009 onwards, other comprehensive income should be presented as part of a new ‘bottom line’ within the income statement. Thus, the other comprehensive income items are added and subtracted, respectively, from net income. The resulting balance is labeled comprehensive income and represents an ‘all- inclusive number of income for the period’. Alternatively, the reconciliation from net income to comprehensive income can be presented in the notes.
From the point of view of economic research, the format of presentation of accounting information is irrelevant as long as the same items are included. However, empirical and experimental accounting research does show that presentation format might influence investors’ decisions (e.g., Hirst and Hopkins, 1998; Maines and McDaniel, 2000). Based on this evidence, the usefulness of presenting comprehensive income instead of net income as the bottom line of the income statement has been the research focus of many empirical studies, especially in the US territory (e.g., Dhaliwal, Subramanyan, and Trezevant, 1999). In the US a similar change with regard to the presentation of (other) comprehensive was caused by the issuance of SFAS No. 130, Reporting Comprehensive Income, in 1997. These empirical research studies examine the claim that income measured on a comprehensive basis is a better measure of firm performance than other summary income measures (e.g., net income). The above claim is primarily investigated by testing whether comprehensive in come or net income better summarizes firm performance as reflected in stock prices (so called association study). The evidence is mixed.
The current study wants to add empirical evidence to the usefulness of (other) comprehensive income disclosures by investigating a less researched field of study within the homogeneous institutional background of German IFRS firms: the predictive power of comprehensive income and its individual components, namely, net income and other comprehensive income. The predictive power of income numbers is an attribute of high relevance for analysts as it reduces their forecast risks. In addition, the IASB and FASB are prominently referring to the importance of financial statements to assist their users in predicting the entity’s future cash flows and, in particular, their timing and certainty. Finally, the examination of predictive power provides direct evidence on the relation between accounting information and future firm operating performance.
Thus, at first, we evaluate the predictive power of the different income numbers with regard to future operating cash flows. Second, we evaluate the predictability of comprehensive income items for future net income and future comprehensive income. Over and above, we examine the predictive power of the different income numbers beyond one period. Finally, the results are segmented by time period in order to analyze the stability of predictive power over time. A sound analysis of various criteria of the different income numbers is necessary due to the lack of a conclusive theoretical standard of evaluation (Dechow and Schrand, 2004).
We hand-collected (other) comprehensive income data for all companies listed in the HDAX in the period of 1998 to 2007. A hand-collection was required due to the fact that common databases such as Worldscope and Hoppenstedt lack detail and quality with regard to (other) comprehensive income reporting. Since for some of the measures examined in this research it is necessary to use information of the previous or the following period, data of the years 1997 and 2008 is also included.
Our results indicate no superior predictive power of comprehensive income over net income for future firm operating performance. In addition, we fail to find significant incremental predictive power of aggregated or individual components of OCI for subsequent period’s firm operating performance. The actuarial gains and losses on defined benefit pension obligations even seem to merely add noise for the prediction of subsequent period’s net income and of subsequent period’s comprehensive income, respectively. This might be driven by the fact that under current regulation future plan amendments and future years of service are not anticipated regardless of the probability of occurrence. In contrast, OCI components seem to have incremental predictive power beyond one period. In conclusion, the incremental predictive power of OCI components depends on the specific prediction period under examination.
Further, we find that the predictive power of net income and comprehensive income for future firm operating performance seems to have deteriorated as a consequence of the IASB’s recent initiatives and actions. Structural breaks of the over time patterns indicate that the worsening of predictive power seems to be driven by main changes of the standards.
1. Background
1.1. Current reporting requirements. Under current IFRS regulation, companies have to book certain transactions directly into equity. An overview of items leading to such a presentation within the financial statements is given in Table 1 below.
The first position that is of relevance for most companies with foreign operations is dealing with gains and losses arising from translating the financial statements of these operations. Translation differences arise if foreign subsidiaries use another functional currency than the functional currency of the group. In case of similar functional currencies, translation differences are booked into the income statement rather than directly into equity. The next position which can directly be booked into equity are gains and losses on the re-measuring of availa- ble-for-sale (AfS) securities. This category comprises all non-derivative financial instruments that are not classified as either held-to-maturity investments, loans and receivables or those securities noted as fair value through profit or loss (FVTPL).
The following two OCI items refer to derivative financial instruments. Out of the three categories of derivatives, which are fair value hedges, cash flow hedges and hedges in foreign currency exposures of net investment in foreign operations, the effective portions of gains and losses of the last two categories are booked directly into equity.
Following IAS 16.31-42 and IAS 38.75-87, companies are given the option to apply a revaluation model for subsequent measurement of property, plant and equipment and intangible assets, respectively. Within these revaluation models, those value increases above book value that do not equalize impairments of booked income statement in previous periods have to be booked directly into equity.
Next, actuarial gains and losses on defined benefit pension obligations are components of other comprehensive income. Since 2004 the IASB allows companies to book these actuarial gains and losses directly into equity for the period the specific gains and losses are incurred.
Finally, the deferred tax effects corresponding to the OCI items presented before have to be displayed in one aggregate position within equity. In the further course of this study the deferred tax effects will not be considered, as it is not possible to allocate them to the underlying transaction.
Table 1. Overview of OCI items under IFRS
Position | Standard |
Foreign currency translation adjustments | IAS 21.39(c) |
Unrealized gains (losses) on re-measuring аѵаііаЫе-fbr-sale (AfS) financial assets | IAS 39.55(b) |
Effective portion of gains and losses on hedging instruments in a cash flow hedge | IAS 39.95(a) |
Effective portion of gains or losses on hedging instruments of a net investment in a foreign operation | IAS 39.102 |
Revaluation of property, plant and equipment | IAS 16.39 |
Revaluation of intangible assets | IAS 38.85 |
Actuarial gains (losses) on defined benefit pension obligations | IAS 19.938 |
1.2. The financial statement presentation project of IASB and FASB. Aiming at developing a ‘conceptually robust’ accounting standard which addresses disclosure issues in the statement of comprehensive income the IASC, predecessor of the IASB, initiated the project “Reporting Financial Performance” which was re-named “Reporting Comprehensive Income” in 2003 and “Financial Statement Presentation” in 2006, respectively. This project is now being conducted in cooperation with the FASB in order to align the two accounting systems.
Two driving forces for this project have been the increasing significance of OCI items as well as the growing use of pro-forma figures in performance reporting of companies (Thinggaard, Wagenhofer, Evans, Gebhardt, Hoogendom, Marton, di Pietro, Mora, and Peasnell, 2006).
The IASB’s objectives with regard to the Financial Statement Presentation project can be summed up in one main objective: to further increase the decision usefulness of financial statements by improving the predictive power of income numbers. The predictive power/predictability of income numbers is often referred to as an attribute of the so called “earnings quality” (Dechow and Schrand, 2004).
In order to realize this objective, the IASB divided its project into three phases. Phase A was dealing with general questions regarding the income statement presentation under IFRS. It was completed with the issuance of IAS 1 (rev. 2007). This revised standard has to be applied by companies for business years beginning on or after January 2009 (earlier adoption permitted). While regulations for valuation of income components remained unchanged, the presentation requirements were altered significantly. The revised IAS 1 standard requires IFRS adopters either to report other comprehensive income together with components of profit or loss in a joint comprehensive income statement (= single statement approach) or to remain with a two statement approach (IAS 1.81 [rev. 2007]). However, in case users are not following the one statement solution, they have to report a statement of comprehensive income (beginning with profit or loss of the period and comprising all OCI items) in equal prominence to the separate income statement. This increased prominence of comprehensive income marks a step towards clean surplus accounting.
In Phase В of the project, the standard setters currently propose a single statement of comprehensive income as the sole presentation format (DP Financial Statement Presentation 3.24-41). This step should enhance the decision usefulness of performance reporting. Again, this change in presentation should lead to an improvement of the predictive power of income numbers. Phase C shall align the interim financial statements to the proposed changes in performance reporting.
2. Literature review
Most academic studies dealing with (other) comprehensive income are investigating the relevance of comprehensive income compared to net income for the prediction of future stock prices. This aspect under examination is often referred to as “value relevance” and also represents an attribute of earnings quality (Dechow and Schrand, 2004). A comprehensive overview of these value relevance studies is given by Thinggaard, Wagenhofer, Evans, Gebhardt, Hoogendom, Marton, di Pietro, Mora, and Peasnell (2006) who are listing studies performed worldwide until 2006. More recently conducted studies are mentioned by Goncharov and Hodgson (2011). Although the results in this field of research are varied, the overall indication is that net income is often a more useful measure in terms of value relevance than comprehensive income.
As outlined in the previous section, there are only few empirical studies on the predictive power of comprehensive income and its individual components, especially with regard to IFRS. This is surprising as the predictive power of income numbers also represents a highly important attribute of earnings quality (e.g., Francis, LaFond, Olsson, and Schipper, 2004). First, predictive power is prominently mentioned within the frameworks of IFRS and US GAAP. For example, according to F.15 “the economic decisions that are taken by users of financial statements require an evaluation of the ability of an enterprise to generate cash and cash equivalents and of the timing and certainty of their generation”. Second, analysts need to predict future (operating) cash flows or income for their valuation models. A high accuracy in predi ction and low risk of revision, respectively, greatly reduces the forecast risks of their models. Third, examining the predictive power of income numbers directly informs about the relation between accounting information and future firm operating performance. The results may serve as a robustness test for the value relevance studies.
Table 2 presents previous studies on the predictive power of comprehensive income and its individual components. As can be seen, seven studies dealt with this issue within the recent past. Two of these studies have analyzed European firms, so far. Only one of the studies has considered IFRS income numbers.
Table 2. Previous studies on the predictive power of comprehensive income and its individual components
Study (year of publication) | Country | Sample period | Conclusions |
Dhaliwal, Subramanyan, and Trezevant (1999) | USA | 1994-1995 | Net income predicts future operating cash flows and income better than comprehensive income. |
Biddle and Choi (2006) | USA | 1994-1998 | No income definition clearly dominates in decision usefulness for the prediction of future operating income. |
Kanagaretnam, Mathieu, and Shehata (2009) | Canada | 1998-2003 | Net income is a better predictor of future net income/comprehensive income/cash flows from operations than comprehensive income. |
Choi and Zang (2006) | USA | 1998-2003 | Comprehensive income is incrementally useful in predicting subsequent period changes in net income. |
Wang (2006) | 14 European countries | 1993-2002 | Net income always outperforms clean surplus income in predicting future firm performance, except in Belgium. |
Choi, Das, and Zang (2007) | USA | 1994-2003 | Comprehensive income can predict subsequent period net income, over and above current period income. |
Goncharov and Hodgson (2011) | 16 European countries | 1991-2005 | Net income dominates aggregated comprehensive income in predicting cash flows. |
As can be seen above, the study conducted by Dhaliwal, Subramanyan, and Trezevant (1999) concludes that net income predicts future operating cash flows and income better than comprehensive income. Biddle and Choi (2006) find that no income definition dominates clearly with regard to its respective predictive power, while Kanagaretnam, Mathieu, and Shehata (2009) observe a better predictive power of comprehensive income over net income for future net income, future comprehensive income and future operating cash flows in the current period. Choi and Zang (2006) as well as Choi, Das, and Zang (2007) confirm this superiority of comprehensive income as a predictor for future net income. Although they do not find statistically significant implications of one specific OCI component for the prediction of future net income, Choi and Zang (2006) find out that the prefix of the OCI values is exerting predictive power. They detect a significant association between large positive OCI values and an increase in next period’s net income, and vice versa. They explain this association with the accessed discretion of managers in choosing the timing of recognizing OCI components depending upon the companies’ underlying performances. The studies of Wang (2006) and Goncharov and Hodgson (2011) which focus on European firms both also confirm the stronger predictive power of net income over comprehensive income. While Wang (2006) focuses on local GAAP numbers only, Goncharov and Hodgson (2011) replicate their main tests by differentiating between local GAAP, IFRS and US GAAP. They find that under all accounting frameworks net income is a better predictor of future operating cash flows than comprehensive income calculated from all accounting bases.
In summary, it becomes clear that the examination of predictive power needs further clarification. In particular, research on the predictive power of IFRS income numbers in a homogeneous institutional setting is necessary. To control for differences in institutional factors (e.g., regulatory requirements and the enforcement system) is important due to the fact that otherwise results might be biased by country-specific properties. Thus, the current study addresses the existing research gap by focusing on the homogeneous institutional background of German IFRS firms.
3. Hypotheses development
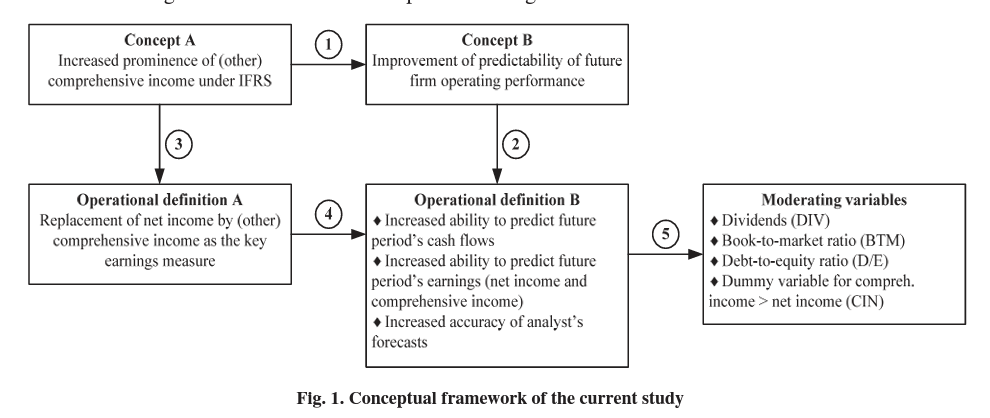
3.1. Conceptual framework. Following an approach introduced by Libby (1981) a conceptual framework is used to transfer the assumed theoretical relationship into operational definitions. The results are pictured in Figure 1.
According to the arguments of the standard setters (see above) and as represented by link 1 in Figure 1, the increased prominence of (other) comprehensive income will improve the predictability of future firm operating performance. Due to the fact that the concept of future firm operating performance cannot be measured directly, an operational definition is derived to be the ability to predict future period’s operating cash flows and earnings (e.g., net income and comprehensive income) as prominent variables of firm performance (expressed by link 2).
The theoretical claim about an increased prominence of (other) comprehensive income in reporting is transformed (via link 3) into an operational definition which assumes that financial statement users replace net income by (other) comprehensive income as the key earnings measure in their analyses. Now an empirical analysis can be performed in order to assess whether the independent variable comprehensive income and its separate OCI components can explain the dependent variables future period’s operating cash flows and earnings (link 4). If this link between the two defined operational definitions is confirmed by empirical evidence, then inferences about the usefulness of the different income numbers for predicting future period’s operating cash flows and earnings can be drawn. In other words, the relation between accounting information and future firm operating performance becomes directly observable.
Note that the predictability could also be analyzed by examining the forecast accuracy of analysts before and after the introduction of IAS 1.81 (rev. 2007). However, besides the fact that analysts are likely to use information from multiple sources, not enough data was available to conduct such a study, yet.
In addition to the assumed validity of links 2 and 3, other factors might also influence the dependent variables as defined in operational definition B. For this reason, moderating variables are considered. The moderating variables used in this study comprise dividends (DIV), a book-to-market ratio (BTM), a debt-to-equity ratio (D/E), and a dummy variable for comprehensive income > net income (LIN). Dividends are included as a control variable due to the prior empirical evidence that they contain information about expected earnings because firms target dividends to the permanent component of earnings (Miller and Modigliani, 1961). Since the market value of a firm represents the current value of estimated future cash flows, we use a book-to- market ratio to control for any variation in expected earnings missed by the dividend variable (Fama and French, 2000). A debt-to-equity ratio is included to control for the financial leverage of the firm which might affect future operating performance through the level of cost of capital, investment restrictions caused by covenants, etc. (e.g., Dhaliwal, Subrama- nyam, and Trezevant, 1999). Finally, a dummy variable for comprehensive income > net income will control for manager’s discretion to choose the timing of recognition of components of comprehensive income depending upon the underlying economic performance of the firm. According to Choi and Zang (2006) managers delay the recognition of unrecognized OCI losses until they become gains or until the amount of losses reduces in order to avoid the negative impact of the loss recognition on net income. This may result in higher predictability of positive OCI items for future earnings than negative OCI items.
3.2. Hypotheses. In order to provide a starting point for an empirical analysis the relation among independent and dependent variables (described as link 4 in Figure 1) is concretized in hypotheses. As the Financial Statement Presentation Project “shift[s] focus from net income to total compre-hensive income” (McClain and McLelland, 2008, p. 64) it is hypothesized that this is done due to the superiority of comprehensive income over net income in predicting the future operating performance of a firm. Accordingly, we state the folio-wing first three hypotheses:
Hl: Comprehensive income has a superior predictive power for future operating cashflows than net income. H2: Comprehensive income has a superior predictive power for future net income than net income.
H3: Comprehensive income has a superior predictive power for future comprehensive income than net income.
In order to also allow for drawing more specific inferences about the relevance of individual OCI components the following second three hypotheses deal with each OCI component’s predictive power. In turn, the individual OCI components are analyzed with regard to their incremental predictive power for future operating cash flows, future net income and future comprehensive income:
H4: Each individual component of other comprehensive income has incremental predictive power for future operating cashflows.
H5: Each individual component of other comprehensive income has incremental predictive power for future net income.
H6: Each individual component of other comprehensive income has incremental predictive power for future comprehensive income.
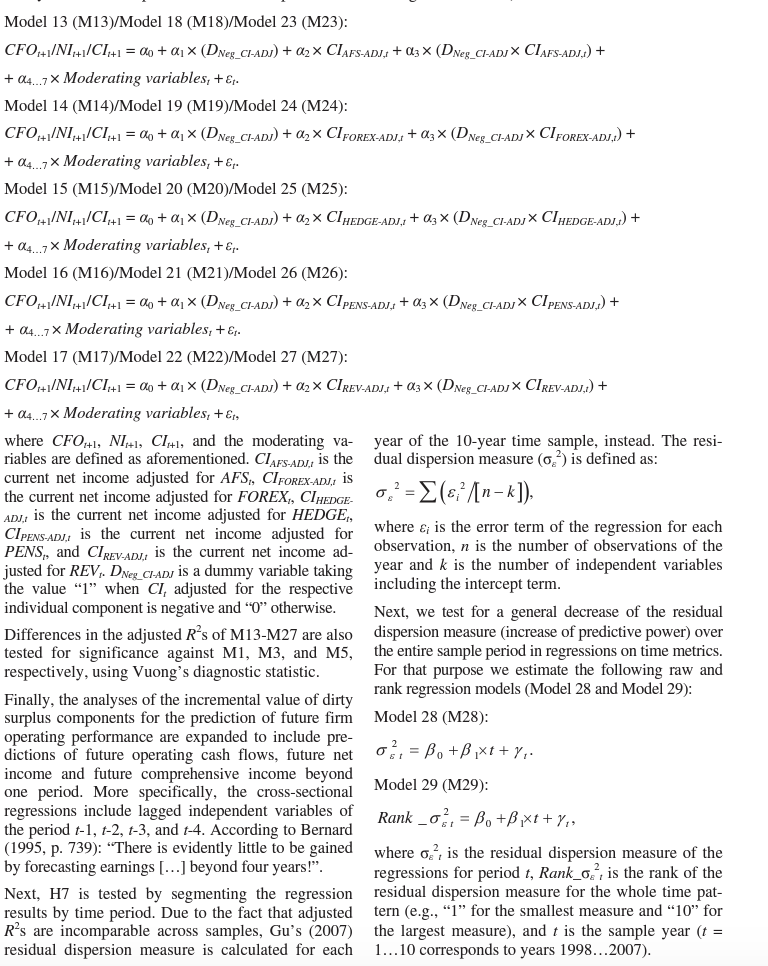
Finally, we assume that the recent developments in the international accounting standards have led to where CFOt+1 is the operating cash flow in the period t+1, NIt is the current (period - t) net income as reported in the income statement and CIt represents current net income adjusted for the components referred to as current other comprehensive income and as reported in the statement of changes in equity. DNegNI and DNegCI are dummy variables taking the value “1” when NIt is negative or CIt is negative, respectively, and “0” otherwise. The use of the dummy variable and the multiplicative interaction term (e.g., Braumoeller, 2004) controls for the timelier recognition of losses in comparison to gains which is often referred to as conditional conservatism (Basu, 1997). As a result, the accuracy of our estimation is improved. The moderating variables were described in section 3.1. All monetary variables are standardized with total assets at the beginning of the year to avoid that rechanges in the usefulness of the different income numbers for predicting future period’s operating cash flows and earnings. Therefore, the question remains whether the predictive power of income numbers has increased or decreased as a result of the IASB’s initiatives and actions. As the IASB reduces the allowable alternative accounting methods and choices and provides a more consistent approach to accounting measurement for the goal of developing a single set of high quality international accounting standards, we predict that these changes in recent years have improved the predictive power of income numbers (Paananen and Lin, 2009). Thus, we formulate the following last hypothesis:
H7: The predictive power of income numbers has increased as a consequence of the IASB’s initiatives and actions.
Having formulated the hypotheses to be tested in the empirical analysis, the following chapter will present the research design of this study.
4. Research design
4.1. Methodology. In order to test the hypotheses defined in the previous section, regression analyses are performed. For testing hypotheses H1 the adjusted R2s of the following two cross-sectional models (Model 1 and Model 2) are compared:
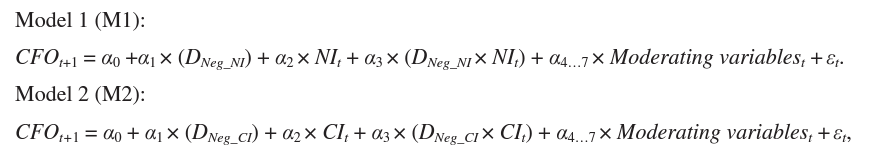
Due to the fact that the comparison of adjusted R2s of non-nested models is associated with several econometric problems (e.g., Greene, 2003, pp. 152-159; and Kennedy, 2008, pp. 87-88) a Vuong (1989) test is performed to investigate whether the difference in adjusted R2s is significant at conventional levels
H2 is tested by regressing future period’s net income against current period’s net income plus moderating variables (Model 3) and against current period’s comprehensive income plus moderating variables (Model 4), respectively. Again, the adjusted R2s of the models are compared and the difference in coefficients belonging to the different regressions investigated using the Vuong test. The following two cross-sectional models are estimated:
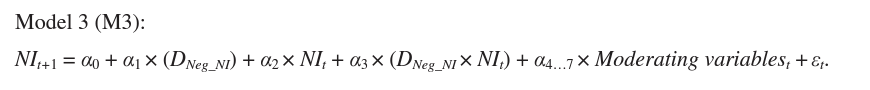
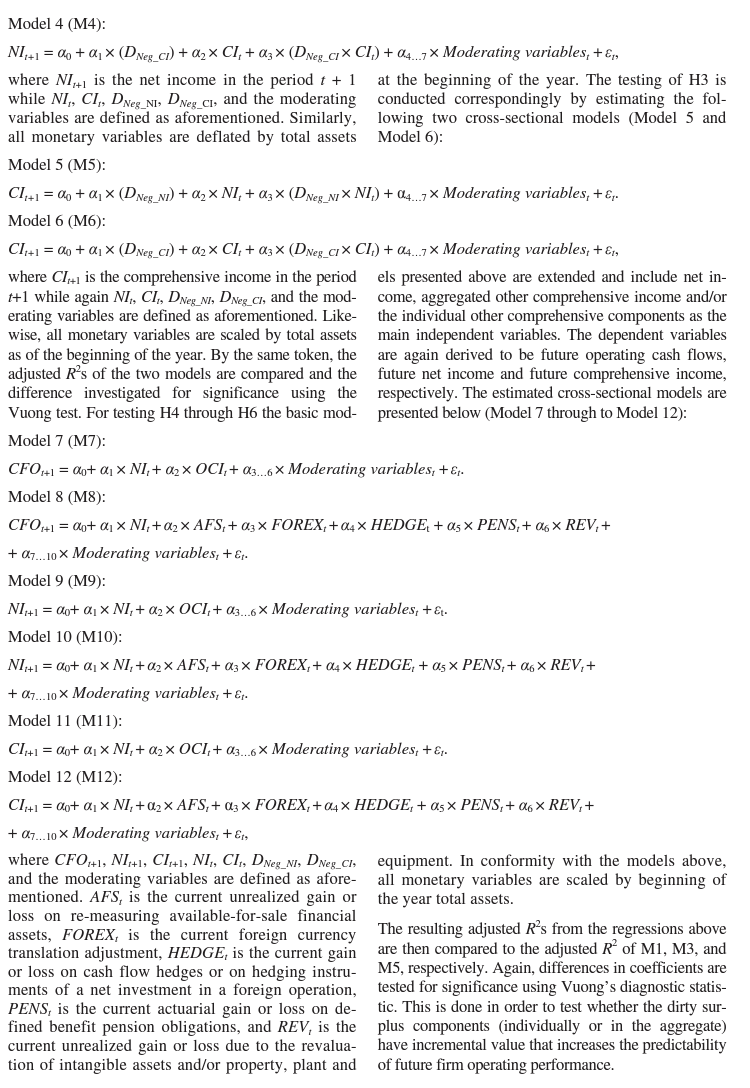
The resulting adjusted R2s from the regressions above are then compared to the adjusted R2 of Ml, М3, and M5, respectively. Again, differences in coefficients are tested for significance using Vuong’s diagnostic statistic. This is done in order to test whether the dirty surplus components (individually or in the aggregate) have incremental value that increases the predictability of future firm operating performance.
Subsequently, in order to evaluate the appropriateness of current individual components of other comprehensive income more specifically, we examine all individual components on an item-by-item basis. This is done by adjusting net income individually for each component of other comprehensive
Model 13 (M13)/Model 18 (M18)/Model 23 (M23): income and then comparing the association between each of the resulting measures of adjusted income and future firm operating performance with the results of the basic models. The following cross- sectional regression models are estimated (Model 13 through to Model 27):
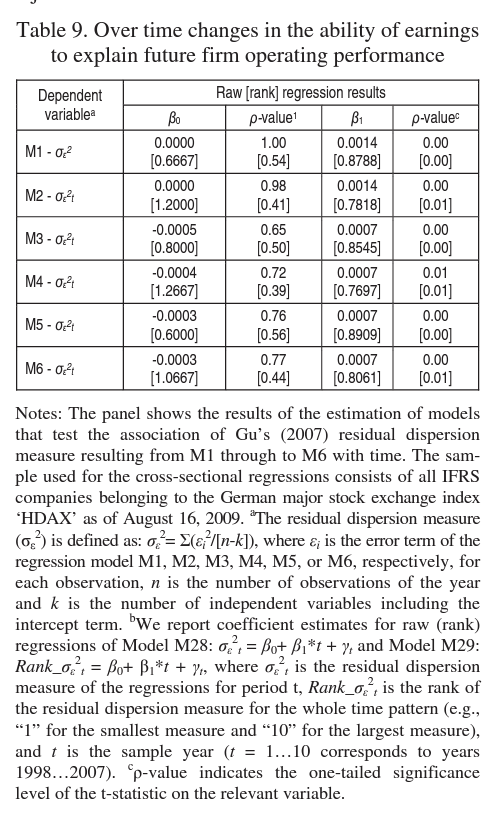
While M28 imposes a linear relation of the residual dispersion metric to time, M29 imposes no particular functional form. As we have no conceptual or other basis for favoring one functional form over another, the rank regression approach provides a reasonable compromise between power and the risk of imposing a misspecified functional form (Francis and Schipper, 1999, pp. 327-328). In fact, M29 greatly serves as a backup for the raw regression results of M28.
4.2. The analyses use data from German companies belonging to the German major stock exchange index ‘HDAX’ as of August 16, 2009. All accounting data had to be hand-collected due to the fact that common databases such as Worldscope and Hoppenstedt lack detail and quality with regard to (other) comprehensive income reporting. Only, the market value of common equity used to calculate the book-to-market ratio is obtained from Thomson Financial Analytics - Worldscope.
The HD AX index includes the largest (in terms of market capitalization) and most actively traded capital market-oriented German firms which are closely monitored by analysts and often serve as a benchmark for many smaller firms with regard to the application of IFRS accounting.
The focus on one capital market allows controlling for institutional factors such as regulatory and listing requirements or the enforcement system (Emstberger, 2008, p. 14). In addition, Germany is a country where a sufficient sample size for IFRS accounting data is available beginning from the late 1990s. Since 1998 many listed companies have exercised an option provided by law (Kapitalaufnahmeerleichterungsgesetz - Capital Raising Act) to prepare consolidated financial statements according to IFRS.
The initial sample consists of the 12-month period firm-year observations between 1998 and 2007 from all 110 companies which were listed in the major segments of the German Stock Exchange. In order to be able to include reporting periods which do not equal the calendar year, ‘year’ was defined as the year in which the fiscal period ends when the end of the fiscal period is between and including June 30 and December 31 and the previous year otherwise. All companies under examination had to apply full IFRS accounting in a period and not only provide reconciliations. In accordance with previous studies, we eliminate banks, insurance companies and other financial firms from the sample reducing our sample size to 98 companies. This is done due to the fact that the balance sheet structures of these firms are fundamentally different to those of non-financial firms and would not allow for comparison. Finally, we exclude all observations representing a short financial year.
The final sample consists of 96 companies or 463 firm-year observations. Unfortunately, some missing values of the market value of common equity further reduces our sample size for the regression analyses including moderating variables to 71 companies or 370 firm-year observations. We test for the robustness of results of the reduced sample by re-running all regressions without moderating variables in section 5.6. To reduce the bias created by outliers, the top and bottom 1% of the data is winso- rized (Field, 2005).
5. Empirical results
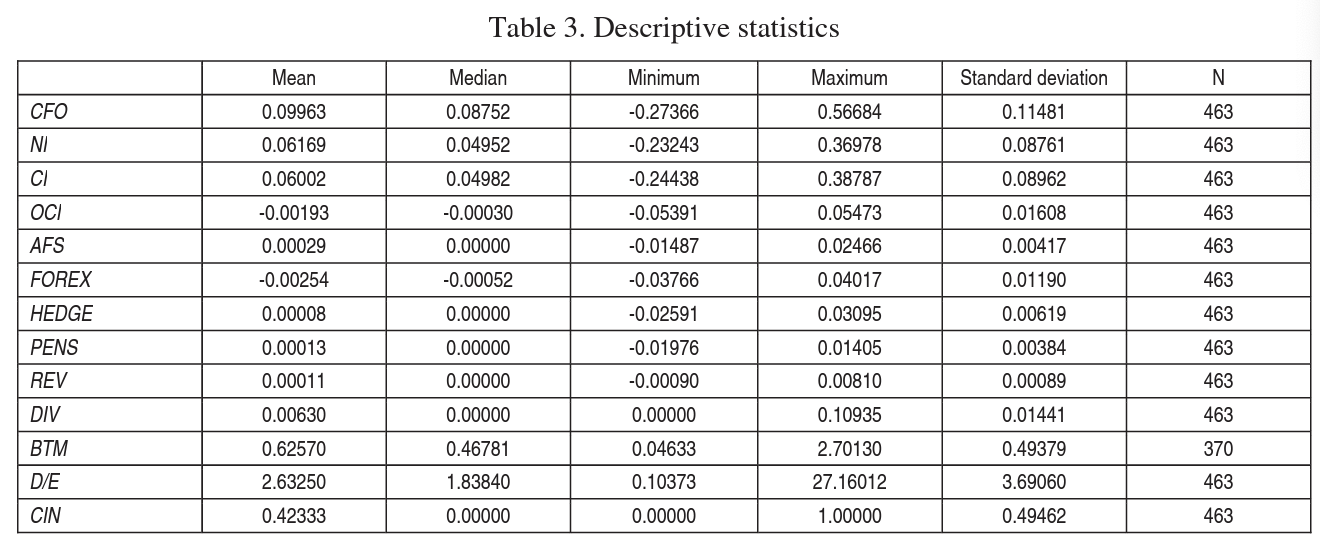
5.1. Descriptive statistics. The descriptive statistics of the deflated variables used in the analyses are presented in Table 3. As can be seen, the overview documents that the majority of companies have positive operating cash flows, a positive net income, and a positive comprehensive income. In contrast, other comprehensive income is mainly negative which causes comprehensive income to be lower than net income on average. This is also documented by a mean value of 0.42333 for the dummy variable CIN. Correspondingly to the results of Emstberger (2008) and in contrast to prior studies, the mean and median of FOREX mostly have a negative sign and drive the results of other comprehensive income. This might be due to the fact that many German companies have subsidiaries in other countries and the Euro appreciated against other major currencies in the period examined.
The mean of AFS, HEDGE, PENS, and REV is positive while the median, respectively, is equal to “0”. This is consistent with prior studies for IFRS OCI data (Emstberger, 2008) as well as US OCI data (e.g., Kanagaretnam, Mathieu, and Shehata, 2009; Dhaliwal, Subramanyan, and Trezevant, 1999). Reasons for the positive mean values might be the increase in stock prices and for the median values of “0” that many companies do not report such items.
Further, the BTM mean value of 0.62750 shows no signs of overvaluation, on average. Finally, the D/E mean of 2.63250 indicates that companies are mainly financed by debt in order to reduce their cost of capital (e.g., D’Mello and Farhat, 2008).
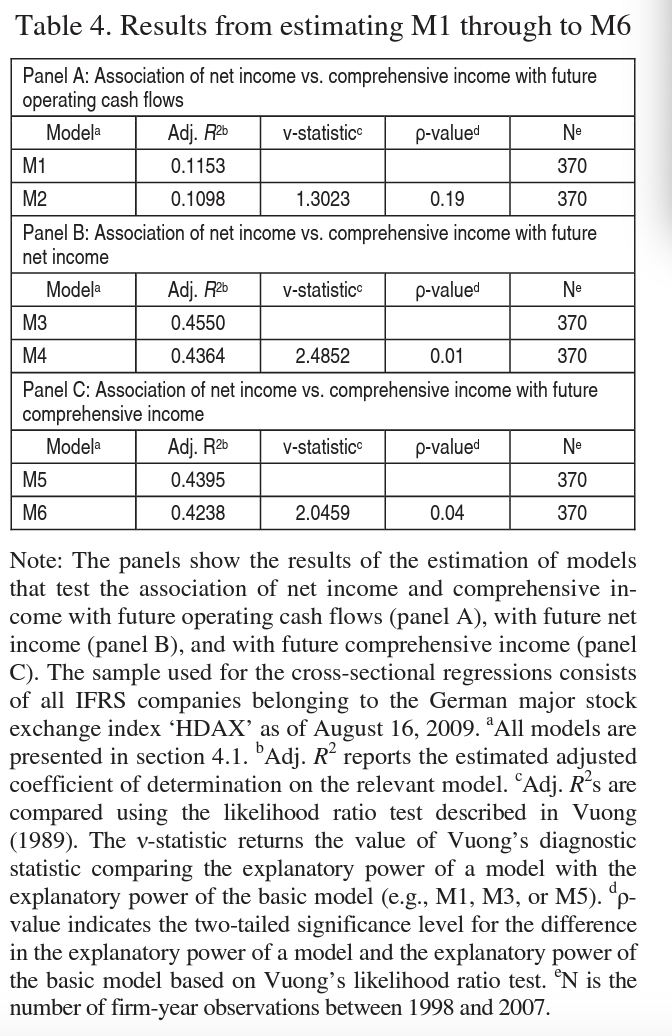
5.2. Regression results for basic models. The adjusted R2s from estimating Ml through to M6 are presented in Table 4, panel A to panel C. As can be seen in panel A of Table 4, we find no superior predictive power of comprehensive income for future operating cash flows than net income. In fact, the adjusted R2 of 0.1158 for Ml is higher than the adjusted R2 of 0.1098 for М2. However, the Vuong test indicates that the difference in adjusted R2s is not significant at conventional levels. Nevertheless, Hl has to be rejected as a consequence of the results.
Table 4, panel В reports the results of the estimation of models that test the association of net income vs. comprehensive income with future net income. Again, the adjusted R2 of 0.4550 for the net income model (М3) is higher than the adjusted R2 of 0.4364 for the comprehensive income model (M4). This time Vuong’s (v) diagnostic statistic confirms that the difference is statistically significant at the 0.01 two- tailed level. Therefore, H2 also has to be rejected.
Table 4, panel C shows the results of the examination of the association of net income vs. comprehensive income with future comprehensive income. In conformance with the results above, the adjusted R2 of 0.4395 for the net income model (M5) is higher than the adjusted R2 of 0.4238 for the comprehensive income model (M6). The v-statistic indicates that the difference is significant at the 4% level. Thus, we find no superior predictive power of comprehensive income for future comprehensive income than net income. H3 also has to be rejected.
In line with prior studies, the adjusted R2s for the models using future operating cash flows as the independent variable are higher than for the models using net income or comprehensive income as the independent variable. These results indicate a better overall predictability of future net income and future comprehensive income in comparison to future operating cash flows.
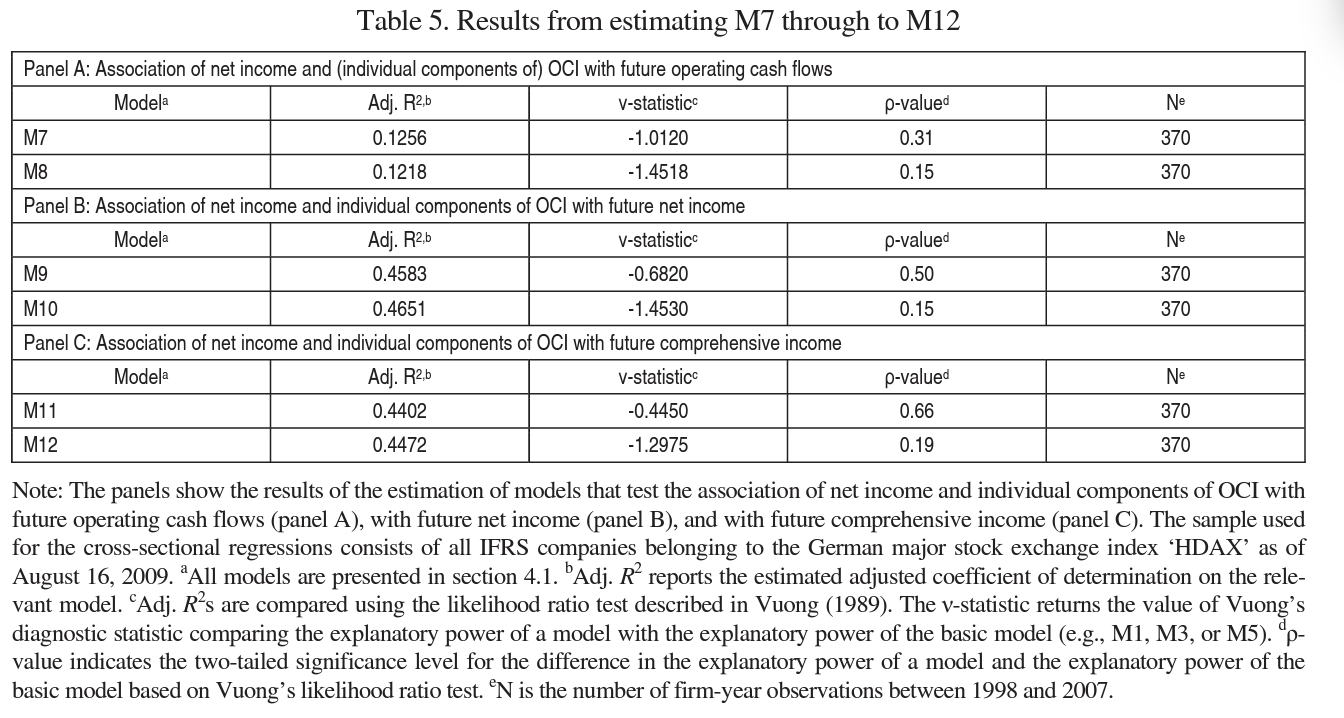
5.3. Regression results for extended models. The results of estimating M7 through to M12 are reported in Table 5, panel A to panel C. The adjusted R2s of these models are compared to the basic models (e.g., Ml, М3, or M5) in order to test whether the OCI components (individually or in the aggregate) have incremental value that enhances the predictability of future firm operating performance. This examination marks a first step towards testing H4 through to H6.
The regression results in panel A of 0.1256 for M7 and of 0.1218 for M8 suggest that the inclusion of both aggregated and individual OCI components improve the predictability of future operating cash flows as these adjusted R2s are higher than the adjusted R2 of 0.1153 for the basic model Ml. Meanwhile, the v- statistics show that the differences in adjusted R2s are not statistically significant. Panel В of Table 5 confirms these results with regard to predicting future net income. Though the adjusted R2s of 0.4583 for M9 and of 0.4651 for M10 are higher than the adjusted R2 of 0.4550 for М3, the Vuong diagnostic statistic indicates that the results are not significant at conventional levels. The adjusted R2s for the association of net income and (individual components of) OCI are reported in panel C of Table 5. As can be seen there, the adjusted R2s of 0.4402 for Mil and of 0.4651 for M12 are higher than the adjusted R2 of 0.4395 for the basic model M5. However, the v-statistics again present that the differences in adjusted R2s are not significant at conventional levels. Overall, the insignificant results support a rejection of H4 through to H6.
Next, to evaluate the appropriateness of current individual components of OCI more specifically M13 through to M27 are estimated. As described above, net income is adjusted individually for each OCI component and then tested for its association with future firm operating performance. The regression results are then compared to the basic models Ml, М3, or M5 as reported in Table 6 (panel A to panel C).
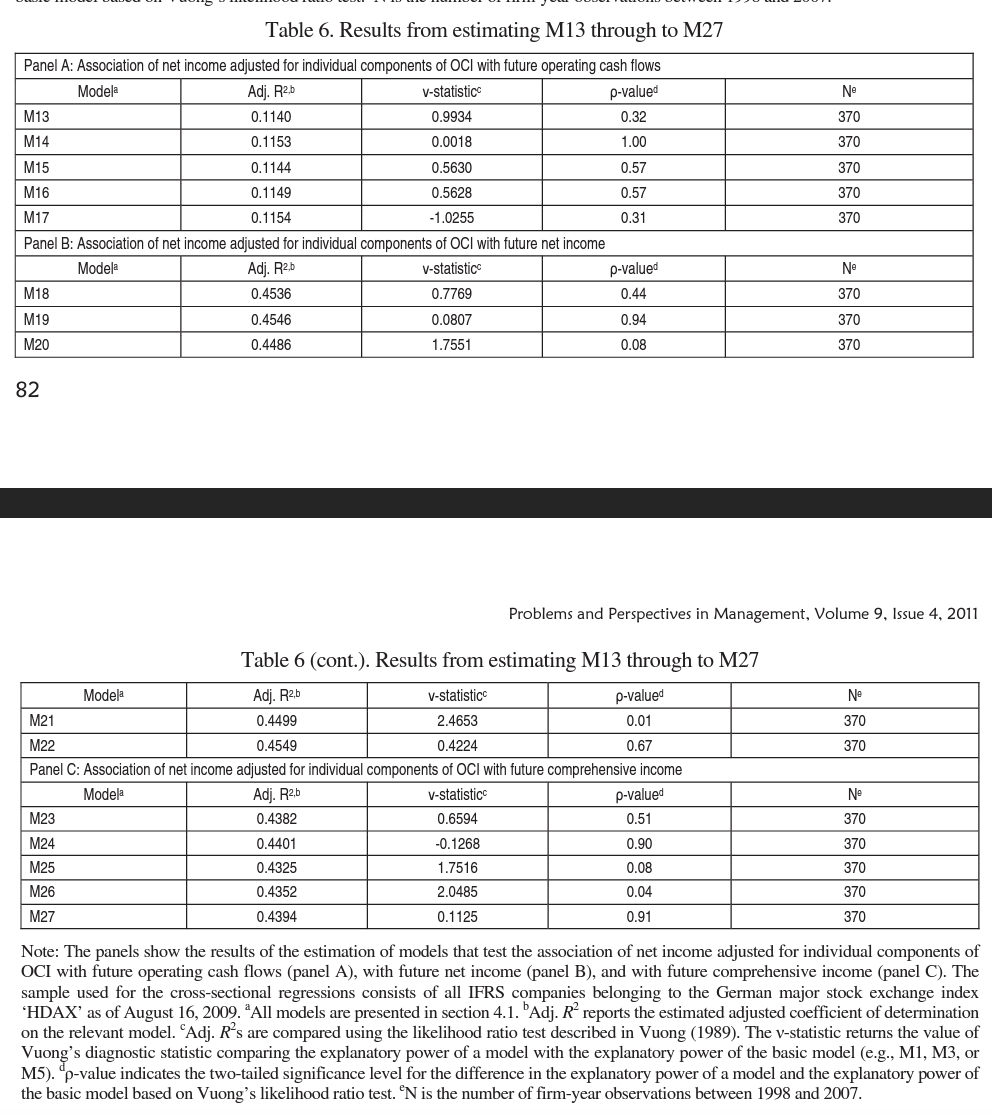
The results of estimating M18 through to M22 are presented in panel В of Table 6. These models test the association of net income adjusted for individual components of OCI with future net income. The adjusted R2s of the regression models are all lower than the adjusted R2 of 0.4550 for the basic model М3. However, the Vuong tests show that all differences in adjusted R2s are not statistically significant except for the PENS-adjustment which is significant at the 0.01 two-tailed level. A reason for the “noise” added by the PENS-adjustment could be the following. The actuarial gains and losses on defined benefit pension obligations include the effects of some future events, while others are excluded. For example, mortality and salary progression are estimated, while future plan amendments and future years of service are not anticipated regardless of the probability of occurrence (Beaver, 1991). Again, H5 has to be rejected as a consequence of the estimation results.
Table 6, panel C reports the regression results for the association of net income adjusted for individual components of OCI with comprehensive income (M23 through to M27). Similar to the results of panel B, the adjusted R2s of the regression models are all not significant at conventional levels except for the PENS-adjustment (M26) which is significant at the 4% level. Thus, the problem of excluding some future events from the estimation process of actuarial gains and losses on defined benefit pension obligations can also be confirmed for the comprehensive level of future income. In conclusion, H6 has to be rejected accordingly.
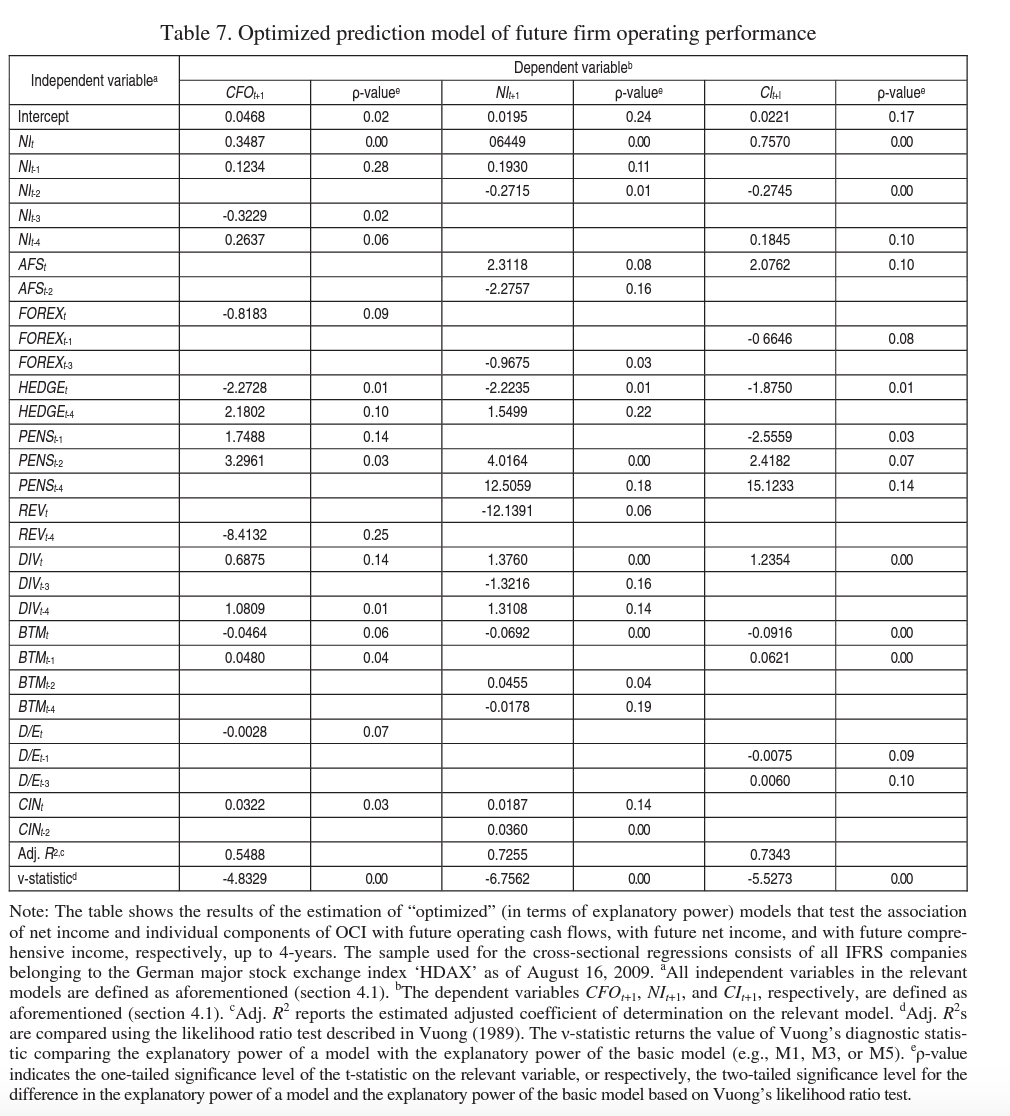
Finally, after showing that not any individual component of OCI has (significant) incremental predictive power for subsequent period’s firm operating performance, we expand our analyses of M8, M10, and M12 to include lagged independent variables of the period t-l, t-2, t-3, and t-4. In other words, we specifically examine the predictive power of all OCI components beyond one period. After estimating the regression models a high number of coefficients are found to have no statistically significant impact on the regression. Hence, a step-wise elimination process is carried out where the variable with the highest p-value is eliminated before the regression model is estimated again. In case of an increased explanatory power of the “new” model the left out variable remains eliminated and the procedure is continued with the next variable until all remaining variables of the equation have significant incremental explanatory power. We have not included a table picturing the elimination process performed due to space limitation. However, the “statistically optimized” (lagged) prediction models for future operating cash flows, future net income and future comprehensive income are presented in Table 7.
As can be seen there, the adjusted R2s of the optimized prediction models (0.5488 for CFOt+1, 0.7255 for NIt+1, and 0.7343 for C7t+i) are higher than for M8, M10, or M12, respectively. In addition, the differences in adjusted R2s are significant at conventional levels (v-statistic at lower than the 0.01 two-tailed level). Thus, some individual OCI components seem to have incremental predictive power beyond net income when longer time periods are considered. In particular, we find predictive power beyond one period for HEDGE, PENS and REV with regard to future operating cash flows; for AFS, FOREX, HEDGE, PENS, and REV with regard to future net income; and for AFS, FOREX, HEDGE, and PENS with regard to future comprehensive income. This adds empirical evidence to the theoretical framework of Ohlson (1999) which concludes “that transitory earnings have no effect on next-period expected earnings if and only if they are ‘passed on’ as dividends”.
In summary, the acceptance or rejection of H4 through to H6 depends on the specific prediction period under examination. While we fail to find significant incremental predictive power of OCI components for subsequent periods of firm operating performance, we are able to confirm the incremental predictive power of OCI components beyond one period.
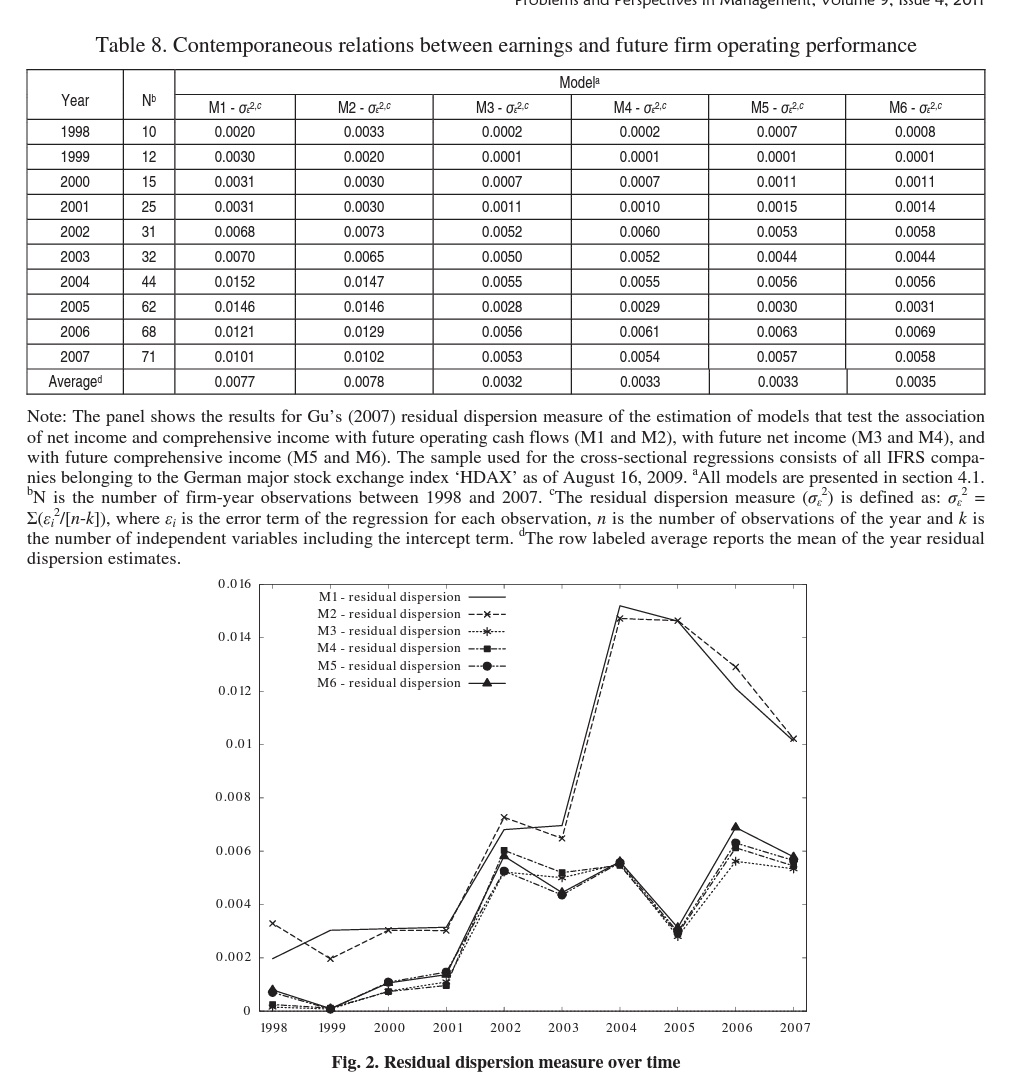
5.4. Time-series regressions. Table 8 reports the results for Gu’s (2007) residual dispersion measure from estimating Ml through to M6. The results are segmented by time period in order to analyze changes in the predictive power of net income and comprehensive income for future firm operating performance. The number of observations in the annual regressions ranges from 10 in 1998 to 71 in 2007. On average, the residual dispersion measure is lowest for predicting future net income, followed by future comprehensive income and future operating cash flows.
Figure 2 displays the over time patterns of the residual dispersion measures of the relevant models. The graphs show a distinct increase for all models for the time period under examination. Thus, the predictive power of net income and comprehensive for future firm operating performance seems to have deteriorated as a consequence of the IASB’s recent initiatives and actions (rejection of H7).
We test the significance of these patterns over time by estimating raw and rank regressions as defined in M28 and M29 above. Turning to the results of the regressions (Table 9), we see that the time coefficient B1 is always positive at conventional levels. Thus, we find a significant increase in the residual dispersions measure over time. This trend is also confirmed by the results of the rank regressions. The estimated magnitude of the decline of predictive power of net income and comprehensive income for future firm operating performance (as indicated by the raw regression results) lies in between 18.18% and 21.88% per year with respect to the average.
Next, Chow (1960) tests on structural change are conducted to see if parameters have changed during the time period. Pinpointing the exact timing of a structural change is a difficult task and tests of this nature typically have low powers (Greene, 2003, Ch. 7). As visually indicated by Figure 2, a structural brake could be possible at year 2004 for future operating income, and at year 2002 for future net income and future comprehensive income, respectively. The Chow test reliably rejects (at less than the 0.01 level) the null hypothesis that the trend for the predictability of future operating cash flows in 1998-2003 is the same as the trend in 2004-2007. A significant structural brake (at less than the 0.05 level) can also be verified for the predictability of future net income at year 2002. Thus, for future net income the trend in predictive power in 1998-2001 is different than the trend in 2002-2007. However, we find no structural brake for the predictability of future comprehensive income over time.
These results correspond to the results of Paananen and Lin (2009) who find a worsening of accounting quality over time, especially for the period after 2004. Further analysis show that this development is less likely to be driven by new adopters of IFRS but is driven by the changes of the standards. The structural breaks identified in this study correspond to the shifts from the IAS period to the IFRS voluntary period in 2002 and from the IFRS voluntary period to the IFRS mandatory period in 2004.
Please note that we have tested the sample for hete- roscedasticity using White’s (1980) test and for autocorrelation using the Durbin-Watson (1950/1951) test as well as the Breusch-Godfrey LM (1978) test. The null hypotheses of “heteroscedasticity not present” and “no autocorrelation”, respectively, could not be rejected at conventional levels.
5.5. Sensitivity analyses. To examine the sensitivity of the results, several tests were conducted. The tests were performed in order to increase the confidence in our main empirical findings. Firstly, all regression models presented above were run without the use of the dummy variable and the multiplicative interaction term which controls for the timelier recognition of losses in comparison to gains. Secondly, we excluded all moderating variables from our analyses. Though the adjusted models have less explanatory power, the results do not change qualitatively.
We also assessed the sensitivity of results with regard to econometric issues. For that purposes, we calculated Ramsey’s (1969) Regression Specification Error Test (RESET) which resulted in no rejection with regard to the linear relationship of our models. Next, we calculated Jarque-Bera (1987) tests for all regression models to see whether the errors are distributed normally. These tests showed the kurtosis of the errors to be higher than “3” and/or the skewness of the errors to be different from “0” for some models. However, we find these results not to cause main econometric problems due to central limit theorem (CLT) which states that the errors will converge to normality when more random observations are included. Thus, the errors of our regression models are regarded to be approximately normally distributed (Rice, 1995).
Furthermore, we have re-run all regression models by the application of robust standard errors (White, 1980) in order to control for heteroscedasticity within our sample. Again, this proceeding resulted in similar qualitative results.
Conclusion
The current study examines the predictive power of comprehensive income and its individual components within the homogenous institutional setting of German IFRS firms. Specifically, this study wants to add empirical evidence to the usefulness of (other) comprehensive income disclosures in comparison to net income as the hitherto existing bottom-line of the income statement. Such an examination is of relevance as the IASB is currently conducting a joint regulation project together with the FASB in order to enhance the presentation of financial statements. One of the main proposals of this project is to present a single statement of comprehensive income instead of allowing to report by means of the traditional income statement and a reconciliation of net income to comprehensive income within the notes. We aim to analyze whether such a change in the presentation of the income numbers has the ability to improve investor’s predictions (based on accounting information) of future firm operating performance as represented by future operating cash flows, future net income and future comprehensive income.
This study’s major findings are as follows. We find no evidence that comprehensive income has a superior predictive power for future firm operating performance than net income. Further, we fail to find significant incremental predictive power of aggregated or individual components of OCI for subsequent period’s firm operating performance. The actuarial gains and losses on defined benefit pension obligations even seem to merely add noise for the prediction of subsequent period’s net income and of subsequent period’s comprehensive income, respectively. A possible reason is found to be that for the actuarial gains and losses on defined benefit pension obligations mortality and salary progression are estimated, while future plan amendments and future years of service are not anticipated regardless of the probability of occurrence. In contrast to these findings, we are able to confirm the incremental predictive power of OCI components beyond one period. In summary, the incremental predictive power of OCI components seems to be dependent on the specific prediction period under examination. Finally, our analyses show that the predictive power of net income and comprehensive income for future firm operating performance seems to have deteriorated as a consequence of the IASB’s recent initiatives and actions. Structural breaks of the patterns over time correspond to the shifts from the IAS period to the IFRS voluntary period in 2002 and from the IFRS voluntary period to the IFRS mandatory period in 2004 (Paananen and Lin, 2009). Thus, the worsening of predictive power seems to be driven by main changes of the standards.
The results of this study are subject to limitations. Firstly, the study is conducted for German companies only, and therefore, may not be representative for other countries. Secondly, the sample of IFRS companies belonging to the German major stock exchange index ‘HDAX’ as of August 16, 2009 is relatively small which might influence the inferences. Thirdly, our analyses should be taken with care as ‘real-world’ investors might consider additional sources beyond accounting information to predict future firm operating performance. Finally, we are not able to draw any conclusions whether it matters if the OCI components are included in comprehensive income or disclosed elsewhere in the financial statements (e.g., as a direct adjustment to equity). All these aspects call for future research on this field of study.
References
- Basu, Sudipta (1997). ‘The Conservatism Principle and the Asymmetric Timeliness of Earnings’, Journal of Accounting and Economics, 24 (1), pp. 3-37.
- Beaver, William H. (1991). ‘Commentary on Problems and Paradoxes in the Financial Reporting of Future Events’, Accounting Horizons, December, pp. 122-134.
- Bernard, Victor L. (1995). ‘The Feltham-Ohlson Framework: Implications for Empiricists’, Contemporary Accounting Research, 11 (2), pp. 733-747.
- Biddle, Gary C. and Choi, Jong-Hag (2006). Is Comprehensive Income Useful?’ Journal of Contemporary Accounting & Economics, 2 (I), pp. 1-32.
- Braumoeller, Bear F. (2004). ‘Hypothesis Testing and Multiplicative Interaction Terms’, International Organization, 58 (4), pp. 807-820.
- Breusch, T.S. (1978). ‘Testing for Autocorrelation in Dynamic Linear Models’, Australian Economic Papers, 17, pp. 334-355.
- Choi, Jong-Hag, Das, S. and Zang, Yoonseok (2007). ‘Comprehensive Income, Future Earnings and Market Mispricing’, Working Paper, March.
- Choi, Jong-Hag and Zang, Yoonseok (2006). ‘Implications of Comprehensive Income Disclosure for Future Earning and Analysts’ Forecasts’, Seoul Journal of Business, 12 (2), pp. 77-109.
- Chow, G.C. (I960). ‘Tests of Equality between Sets of Coefficients in Two Linear Regressions’, Econometrica, 28, pp. 591-605.
- Dechow, Patricia M. and Schrand, Catherine M. (2004), Earnings Quality,
- Dhaliwal, Dan, Subramanyan, K.R. and Trezevant, Robert (1999). Is comprehensive income superior to net income as a measure of firm performance?’ Journal of Accounting and Economics, 26 (26), pp. 43-67.
- D’Mello, Ranjan and Farhat, Joseph. (2008). ‘A comparative analysis of proxies for an optimal leverage ratio’, Review of Financial Economics, 17, pp. 213-227.
- Durbin, J. and Watson, G.S. (1950). ‘Testing for Serial Correlation in Least Squares Regression I’, Biometrika, 37, pp. 409-428.
- Durbin, J. and Watson, G. (1951). ‘Testing for Serial Correlation in Least Squares Regression П’, Biometrika, 38, pp. 159-178.
- Emstberger, Jürgen. (2008). ‘The value relevance of comprehensive income under IFRS and US GAAP: empirical evidence from Germany \ International Journal of Accounting, Auditing and Performance Evaluation, 5 (I), pp. 1-29.
- Fama, Eugene F. and French, Kenneth R. (2000). ‘Forecasting Profitability and Earnings’, Journal of Business, 73 (2), pp. 161-175.
- Feltham, Gerald A. and Ohlson, James A. (1995). ‘Valuation and clean surplus accounting for operating and financial activities’, Contemporary Accounting Research, 11 (2), pp. 689-731.
- Field, Andy (2005). Discovering Statistics Using SPSS. 2nd, London.
- Francis, Jennifer, LaFond, Ryan, Olsson, Per M. and Schipper, Katherine (2004). ‘Costs of Equity and Earnings Attributes’, Accounting Review, 79 (4), pp. 967-1010.
- Francis, J. and Schipper, К. (1999). ‘Have Financial Statements Lost Their Relevance?’ Journal of Accounting Research, 37 (2), pp. 319-352.
- Godfrey, L.G. (1978). ‘Testing Against General Autoregressive and Moving Average Error Models when the Regressors Include Lagged Dependent Variables’, Econometrica, 46 (6), pp. 1293-1302.
- Goncharov, Igor and Hodgson, Allan C. (2011). ‘Measuring and Reporting Income in Europe’, Journal of International Accounting Research, 10 (1), pp. 27-59.
- Greene, William H. (2003). Econometric Analysis, 5th, New Jersey.
- Gu, Zhaoyang. (2007). ‘Across-sample Incomparability of R2s and Additional Evidence of Value Relevance Changes Over Time’, Journal of Business Finance & Accounting, 34 (7-8), pp. 1073-1098.
- Hirst, D. Eric and Hopkins, Patrick E. (1998). ‘Comprehensive income reporting and analysts’ valuation judgments’, Journal of Accounting Research, 36, Supplement, pp. 47-75.
- International Accounting Standards Board (ed.). (2008). Discussion Paper “Preliminary Views on Financial Statement Presentation", October: IASB.
- International Accounting Standards Board (ed.). (2003). ‘Reporting comprehensive income’, IASB update, July 2003, London: IASB, p. 8.
- Jarque, C.M.and Bera, A.K. (1987). ‘A Test for Normality of Observations and Regression Residuals’, International Statistical Review, 55, 163-172.
- Kanagaretnam, Kiri daran, Mathieu, Roberta and Shehata, Mohamed. (2009). ‘Usefulness of comprehensive income reporting in Canada’, Journal of Accounting and Public Policy, 28 (4), pp. 349-365.
- Kennedy, Peter (2008). A Guide to Econometrics, 6th, Cambridge, Massachusetts.
- Libby, Robert. (1981). Accounting and information processing: Theory and applications, 1st edition, New Jersey.
- Maines, Laureen and McDaniel, Linda S. (2000). ‘Effects of Comprehensive Income Characteristics on Nonprofessional Investors’ Judgements: The Role of Financial-Statement Presentation Format’, The Accounting Review, 75 (2), pp. 179-207.
- McClain, Guy and McLelland, Andrew J. (2008). ‘Shaking up financial statement presentation’, Journal of Accountancy, 206(5), pp. 56-64.
- Miller, Merton H. and Modigliani, Franco (1961). ‘Dividend policy, growth, and the valuation of shares’, The Journal of Business, 34 (2), pp. 411-433.
- Ohlson, James A. (1995). ‘Earnings, book values, and dividends in equity valuation’, Contemporary Accounting Research, 11 (2), pp. 661-687.
- Ohlson, James A. (1999). On transitory earnings’, Review of Accounting Studies, 4 (3-4), pp. 145-162.
- Paananen, Mari and Lin, Henghsiu (2009). ‘The Development of Accounting Quality of IAS and IFRS over Time: The Case of Germany’, Journal of International Accounting Research, 8 (1), pp. 31-55.
- Ramsey, J.B. (1969). ‘Tests for Specification Errors in Classical Least Squares Regression Analysis’, Journal of Royal Statistical Society, B31, pp. 350-371.
- Rice, John A. (1995). Mathematical Statistics and Data Analysis, 2nd, Belmont (California).
- Thinggaard, Frank, Wagenhofer, Alfred, Evans, Lisa, Gebhardt, Günther, Hoogendom, Martin, Marton, Jan, di Pietro, Roberto, Mora, Araceli and Peasnell, Ken (2006). ‘Performance Reporting - The IASB’s proposed formats of financial statements in the exposure draft of IAS V, Accounting in Europe, 3, pp. 35-63.
- Vuong, Quang H. (1989). ‘Likelihood ratio tests for model selection and non-nested hypotheses’, Econometrica, 57 (2), pp. 307-333.
- Wang, Yue (2006). Essays on the Relevance and Use of Dirty Surplus Accounting Flows in Europe,
- White, Halbert (1980). ‘A heteroskedasticity-consistent covariance matrix estimator and a direct test for heteroskedas- ficfty’, Econometrica, 48 (4), pp. 817-838.
Похожие статьи
Susanne Menzel
Susanne Bögeholz