Эта статья опубликована под лицензией Creative Commons и не автором статьи. Поэтому если вы найдете какие-либо неточности, вы можете исправить их, обновив статью.

The Relation between Inequality and Intergenerational Class Mobility in 39 Countries


Florian R. Hertel
Olaf Groh-Samberg
Опубликована Окт. 12, 2019
Последнее обновление статьи Окт. 18, 2022
Эта статья опубликована под лицензией
")


Abstract
We study the relationship between inter-class inequality and intergenerational class mobility across 39 countries. Previous research on the relationship between economic inequality and class mobility remains inconclusive, as studies have confounded intra- with between-class economic inequalities. We propose that between-class inequality across multiple dimensions accounts for the inverse relationship between inequality and mobility: the larger the resource distance between classes, the less likely it is that mobility from one to the other will occur. We consider inequality in terms of between-class differences in three areas—education, wages, and income—and in a composite measure. Building on sociological mobility theory, we argue that cross-country variation in mobility results, in part, from families adapting to different levels of between-class inequality. Consistent with this hypothesis, we find a negative correlation between inter-class inequality and social fluidity, with between-class inequality being a better predictor of mobility chances than conventional distributional measures. We also find that the resource distance between classes is negatively related to the strength of their intergenerational association for some off-diagonal origin and destination (OD) class combinations.
Ключевые слова
Educational, curve, inequality, Great, Gatsby, mobility, between-class, economic, social
Abstract
We study the relationship between inter-class inequality and intergenerational class mobility across 39 countries. Previous research on the relationship between economic inequality and class mobility remains inconclusive, as studies have confounded intra- with between-class economic inequalities. We propose that between-class inequality across multiple dimensions accounts for the inverse relationship between inequality and mobility: the larger the resource distance between classes, the less likely it is that mobility from one to the other will occur. We consider inequality in terms of between-class differences in three areas—education, wages, and income—and in a composite measure. Building on sociological mobility theory, we argue that cross-country variation in mobility results, in part, from families adapting to different levels of between-class inequality. Consistent with this hypothesis, we find a negative correlation between inter-class inequality and social fluidity, with between-class inequality being a better predictor of mobility chances than conventional distributional measures. We also find that the resource distance between classes is negatively related to the strength of their intergenerational association for some off-diagonal origin and destination (OD) class combinations.
The relationship between social inequality and intergenerational mobility has received increasing attention over recent years. Economists have presented evidence that intergenerational income mobility is lower in countries where income is more unequally distributed (Andrews and Leigh 2009; Björklund and Jäntti 1997; Corak 2013). Based on these findings, politicians have grown concerned about the Great Gatsby curve (Krueger 2012): that is, a strong correlation between countries’ intergenerational earnings elasticity and the Gini index of inequality in disposable household income.
Our study provides a sociological perspective on this issue by examining whether intergenerational class mobility covaries with between-class inequality across 39 countries in five continents (Blanden 2013; Wodtke 2017). Following sociological approaches to intergenerational class mobility, we focus on relative mobility chances rather than absolute mobility flows. In other words, we study individuals’ chances of reaching certain destination classes given their origin class (Breen 2010b; Bukodi and Goldthorpe 2018).
A few dated sociological studies have examined the relationship between class mobility and various forms of inequality, but a systematic empirical analysis is still lacking (Bukodi and Goldthorpe 2018; Hout 2004; Mitnik, Cumberworth, and Grusky 2016). Some have concluded that inequality is negatively correlated with class mobility (Erikson and Goldthorpe 1992; Tyree, Semyonov, and Hodge 1979), but others have not (Breen and Luijkx 2004b). These conflicting findings are troublesome, not least in light of increasing economic inequality in a number of countries and the potentially negative consequences for mobility (Chetty et al. 2017; Mayer 2001).
We argue that previous studies have reached conflicting results partly because they have confounded inter- with intra-class inequalities by using concepts of overall (i.e., inter-individual) economic inequality—as captured, for instance, by the Gini coefficient (Breen and Luijkx 2004b). Linking overall economic inequality to class mobility and economic mobility in similar ways can be misleading, because these phenomena are only weakly related (Blanden, Gregg, and Macmillan 2013; Breen, Mood, and Jonsson 2015; Mood 2017).1 Hence, social-class mobility might more appropriately relate to between-class inequality than to other types of inequality.
Building on social mobility theory, we propose that larger between-class resource distances affect families’ risk assessment and their ability to follow through on mobility decisions, resulting in lower social mobility chances. To the extent that between-class distances reflect barriers to mobility as well as resource inequalities, we hypothesize that families with fewer resources both prefer and are constrained to less ambitious but relatively safe mobility strategies, because failure is more consequential in high-inequality countries. By the same token, wealthy families are able and forced to use additional resources to maintain their status in highly unequal societies. In other words, the larger the resource distance between any two classes, the lower the propensity for intergenerational mobility between them.
Our study is limited to a cross-sectional analysis. We did not obtain sufficient measurement points for inequality and mobility to investigate their coevolution over time, that is, the effect of changing inequality on mobility within countries. Hence, we cannot establish a causal relationship between inequality and mobility. Instead, we consider variations in inequality and mobility for individuals born between 1950 and 1989 across 39 countries in five continents, and we arrive at the first empirical estimates for the relationship between inter-class inequality and relative mobility chances. The results of our first set of analyses show that class mobility is negatively correlated with between-class inequality. In a second set of analyses, we also study the cross-country covariation of between-class resource distance and intergenerational associations for each origin-destination (OD) class combination. The results demonstrate that long-range upward mobility is negatively related to larger resource distances between the highest and lowest classes.
Past Research
Research has thus far considered two main hypotheses with regard to cross-national variation in class mobility, also referred to as social fluidity.2 Proponents of the industrialization hypothesis suggest that social mobility differs across countries depending on their level of socioeconomic development and modernization (Blau and Duncan 1967; Treiman 1970; Treiman and Yip 1989). Other researchers, however, argue that cross-country differences in relative mobility chances are negligible because of countries’ similarities in terms of class structure, the predominance of nuclear families, and capitalist economic systems based on private property and markets (Featherman, Jones, and Hauser 1975; Lipset and Zetterberg 1959).
Scholars have presented empirical research supporting both theories. Ganzeboom, Luijkx, and Treiman’s (1989:47) comparative analysis of class mobility in 35 countries—the largest such study to date—found a substantial degree of cross-country variation: “about a third of the variance across mobility tables is attributable to societal differences in mobility regimes.” The credibility of some of their data, however, was severely undermined upon further analysis (Erikson and Goldthorpe 1992; Jones 1992). Whether variation in fluidity is in fact so large is therefore questionable yet hard to evaluate because later studies have focused on more culturally and historically similar (i.e., Western or European) countries.
Erikson and Goldthorpe (1992) found that, once national peculiarities are adjusted for, relative mobility chances are similar across industrialized countries, representing a pattern of “core fluidity.” This core model describes a universal mobility pattern characterized by hierarchical barriers, class inheritance, sectoral boundaries, and (dis)affinity between specific origin and destination classes. Erikson and Goldthorpe do find significant country-level deviations from their core model, but they do not attribute them to variation in between-class inequality but rather to the impact of institutions, sociocultural peculiarities, or political interventions at the country level (Bukodi and Goldthorpe 2018). Nevertheless, between-class differences in terms of available resources, occupational closure, and enumeration are at the core of the argument about hierarchical barriers to mobility between higher and lower classes (Erikson and Goldthorpe 1992:123ff.). More recent studies have corroborated that social fluidity is still structured according to this pattern (see country chapters in Breen 2004).
In light of later studies, these opposing hypotheses are probably too far-fetched (Wong 1992). Revisiting Erikson and Goldthorpe, Breen and Luijkx (2004b) conclude there has been at least some (albeit very moderate) increase in social fluidity in 9 of the 12 Western countries in their study. They also note significant cross-country differences and little convergence in social mobility (Breen and Luijkx 2004a). A more recent study of 30 European nations concludes that “where the inequalities of conditions are the most marked in terms of access to economic, social, and cultural resources . . . relative mobility chances are the most unequal” (Bukodi, Paskov and Nolan 2017:27–28). In a related paper, Bukodi and Goldthorpe (2018) argue that social fluidity differs in high- and low-inequality countries, even though they do not systematically quantify such differences.
There are two prime candidate explanations for cross-country variation in mobility. The first is economic inequality (Breen and Luijkx 2004b; Erikson and Goldthorpe 1992; Tyree et al. 1979); the second is a combination of cross-country differences in class structure, welfare-state regime type, and educational system (Beller and Hout 2006; Bukodi and Goldthorpe 2018; Erikson and Goldthorpe 1987; Grusky and Hauser 1984). We will separately discuss findings that support each of these explanatory accounts.
Economic Inequality and Social Mobility
Findings regarding the effect of economic inequality on social mobility are inconclusive. Many studies have found that inequality is negatively related to social fluidity, such that greater economic inequality is related to more unequal mobility chances (Erikson and Goldthorpe 1992; Grusky and Hauser 1984; Tyree et al. 1979). Others have found no correlation between the two (Breen and Luijkx 2004b).
Studying relative mobility chances between blue- and white-collar occupations in 22 countries, Tyree and colleagues (1979) found that inequality, measured as the percentage of total income accrued by the top 5 percent of households, negatively correlates with chances of mobility from manual to nonmanual classes. Using the same definition of inequality and three origin and destination classes in a comparative analysis of 16 countries, Grusky and Hauser (1984) estimate that income inequality ranks third out of five possible mechanisms accounting for cross-country variation in mobility chances, and inequality is mainly related to class inheritance. Using a more differentiated model for class stratification—the Erikson-Goldthorpe-Portocarero (EGP) class scheme—Erikson and Goldthorpe (1992) reaffirm the previously posited economic inequality–mobility relationship. They regress the Unidiff parameter for social fluidity on income inequality, among other explanatory factors. To measure inequality, they use a trichotomized composite indicator taken from Treiman and Yip (1989) based on the ratio of high-prestige professionals’ incomes relative to those of low-prestige production workers and the income shares of the top 10 percent of family income-earners (Erikson and Goldthorpe 1992:381ff).3
More recent studies offer descriptive evidence of this link without jointly modeling economic inequality and mobility. Jackson and Evans (2017) found that relative mobility chances became more unequal between the early 1990s and 2007 in the vast majority of 13 transitional Eastern European countries. Although they did not find a correlation between income inequality and relative mobility chances within their sample, they attribute the substantial decline in fluidity to marketization and the abolishment of socialist affirmative action programs (Jackson and Evans 2017:60). Finally, Mitnik and colleagues (2016) showed that intergenerational associations increased substantially from the 1990s to the 2000s in the United States among the professional and managerial classes but did not change much among all other classes. This was particularly true among age groups that experienced the sudden rise in income inequality, so the authors infer a relationship between both phenomena.
At least one comparative study, however, found evidence against a relationship between economic inequality and relative mobility chances. Breen and Luijkx (2004b) regressed 11 countries’ overall intergenerational association (measured by the Unidiff parameter) on income inequality (measured by the GINI index). They did not find a significant correlation between the two but reported a positive coefficient sign, indicating that countries with higher levels of inequality show more equal relative mobility chances (see also Grusky and Hauser 1984).
These conflicting results leave open the question of whether economic inequality is in fact related to cross-country differences in social-class mobility. A key issue is that different studies use alternative ways of measuring economic inequality. Studies supporting the view that inequality is not related to mobility use global measures of average inter-individual inequality. Studies arguing for an inverse relationship between inequality and class mobility use inequality measures based on specific inter-group differences in economic resources. Such local measures of inequality are based on similar—albeit not identical—units between which mobility is studied. We argue that the latter is a better approach in analyzing the relationship between inequality and mobility.
Educational Systems and Social Mobility
Recent research on social mobility focuses primarily on the role of educational attainment (Breen 2010a; Breen and Karlson 2014). This is based on the assumption that education is the single most important factor in status transmission and class reproduction outside of self-employment and farming (Blau and Duncan 1967; Featherman and Hauser 1978; Hout 1988; Ishida, Müller, and Ridge 1995; Treiman and Yip 1989). To explain changes in relative mobility, researchers often study the effects of declining inequality in educational opportunity (Beller and Hout 2006; Breen and Jonsson 2007; Erikson and Jonsson 1996; Jonsson and Erikson 2007), declining class returns on educational attainment (Torche and Ribeiro 2010), and the general rise in educational attainment (Hertel and Pfeffer 2016; Hout 1988; Pfeffer and Hertel 2015; Torche 2011, 2016).
These studies, however, focus on social mobility trends among cohorts rather than among countries. Beller and Hout (2006) found that cross-country differences in relative mobility chances covary with the level of secondary educational attainment and with inequalities in educational opportunity (Treiman and Yip 1989). Researchers have attributed this correlation to the “compositional effect” (Breen and Jonsson 2005:234): Hout (1988) demonstrated that growing shares of college graduates weakened overall intergenerational association in the United States—a finding that was later corroborated by Torche (2011) for class mobility but not for intergenerational income mobility (Zhou 2019). More recently, Torche (2016) has argued that this compositional effect originates from more meritocratic selection procedures in higher labor market segments. From a cross-country perspective, Beller and Hout (2006) show that high levels of secondary education have the largest impact on fluidity in liberal welfare states, which would otherwise feature the lowest levels of social fluidity. Given that cohort differences in educational inequality are drivers of social mobility within countries (Breen 2010a), they might also correlate with cross-country variation in mobility.
From the perspective of between-class educational inequality, the research reviewed thus far suggests that mobility chances across countries are related to cross-national variation in educational attainment, both among origin classes (as a proxy for inequality in educational opportunities) and among destination classes (as a result of credentialism, i.e., occupational closure given the increasing request for educational entrance certificates).
Welfare Regimes and Social Mobility
Welfare states’ ability to affect social mobility hinges on the relationship between the latter and the inequality of conditions and opportunities (Sørensen 2006). Welfare states can reduce inequality of conditions through redistributive strategies such as social transfers, progressive taxation, and social security contributions. They can influence primary market inequalities by implementing labor market policies such as minimum wages, employment protection legislation, and active labor market policies, and by setting the legal framework for bargaining systems (Esping-Andersen 1990, 1999; Hall and Soskice 2001; Kerrissey 2015). On the other hand, social and educational policies designed to foster equal opportunities—such as public school systems, affirmative action programs, and antidiscrimination laws—can affect social mobility beyond a state’s influence on the equality of material living conditions (DiPrete and Grusky 1990; Hout 2009).
Researchers frequently group countries into welfare-state regime types based on the shape and extent of their welfare systems and the role of states, markets, and households in welfare provision (Esping-Andersen 1990, 1996; Kim 2014). Comparative mobility studies of such welfare state regimes have found more equal mobility chances in Northern European social-democratic “statist” regimes relative to conservative “familiaristic” regimes in continental Europe (Beller and Hout 2006; Breen and Luijkx 2004a; Bukodi et al. 2017; Erikson and Goldthorpe 1992). Researchers have suggested that more generous universal welfare provisions equalize mobility rates by decreasing the disadvantages associated with lower-class origins without reducing higher-class mobility advantages (Esping-Andersen 2014; Esping-Andersen and Wagner 2012).
Based on this research, we expect substantial variation in mobility chances across welfare state regimes. We take this variation to partially result from the extent to which welfare states reduce inequality. In addition, these states may influence equality in educational and occupational opportunities directly (Erikson and Jonsson 1996). Hence, it is important to account for inequality in studying welfare state policies’ direct impact on social mobility (Nolan et al. 2011). To that effect, we shall evaluate the power of institutional settings against the different types of inequality. Specifically, we will test the extent to which inequalities mediate welfare states’ effect on social mobility (Esping-Andersen 2014).
Conceptualizing The Link Between Inequality and Mobility
Erikson and Goldthorpe’s (1992) core model of social mobility assumes that industrialized countries display common relative social mobility patterns because, net of national idiosyncrasies, their class structures stratify mobility chances in similar ways. The sociological theory of mobility decisions and status maintenance explains these similarities at the micro-level of rational decision-making under resource constraints imposed by the class structure.
Goldthorpe (2007b) suggests status maintenance is the ultimate driving force behind micro-level mobility decisions. This relies on the prospect theory axiom, whereby losses are weighted higher than gains of equivalent magnitude (Kahneman, Slovic, and Tversky 1982; Tversky and Kahneman 1989). From this perspective, mobility strategies are primarily guided by risk-averse decision-making. As a result, higher social classes’ motivation to avoid downward mobility will always be stronger than lower social classes’ motivation to achieve upward mobility. As a consequence of cross-country similarities in class structures constraining mobility decisions, “endogenous mobility regimes will tend towards uniformity” (Goldthorpe 2007a:166).
This explanation, however, rests on cross-country similarities in relative between-class inequality as dictated by class structure as such; it thus neglects the (additional) possible effect of cross-country variation in absolute between-class inequality on mobility. Such variation likely moderates the role of the explanatory elements of social mobility theory. Risk aversion is a pervasive feature of rational decision-making, but between-class resource distances should directly affect assessment of the risks involved in mobility strategies, including the (opportunity) costs of failing (Tyree et al. 1979). In more unequal societies, advantaged families have more to lose in cases of downward mobility. Consequently, they use all available assets and resources to maintain their status and thus increase immobility at the top (Erikson and Goldthorpe 1992; Mitnik et al. 2016). This renders upward mobility even more difficult and costly for the lower classes, because of heightened competition for limited privileged positions (Putnam 2015). In contrast, failing upward mobility strategies from below are less costly in more equal societies because “existing intermediate statuses provide alternative compromise destinations” (Tyree et al. 1979:413).
From a comparative perspective, it follows that not only relative but also absolute between-class inequalities affect countries’ class mobility patterns, leading to country-specific deviations from the core model of social fluidity. The service class is (relatively) more privileged than the working class in every country, but the (absolute) resource distance between these classes can vary substantially among countries. Where absolute resource distances between classes are higher, mobility will be less likely and, at the same time, alternative mobility destinations may become more attractive. Accordingly, we hypothesize an inverse relationship between cross-country variations in inter-class resource distances and mobility.
Several empirical studies are consistent with this hypothesis. Larger between-class inequalities, for example, are associated with greater status anxiety (Dragolov and Delhey 2013; Grusky and MacLean 2015) in upper- and middle-class individuals, who, on average, have more to lose than do members of less privileged classes and thus face a greater “fear of falling” (Ehrenreich 1989). Given higher inequality, greater status anxiety, and fiercer status competition, the middle and upper classes will use relatively more resources to achieve status maintenance and prevent status-seeking in the lower classes (Paskov, Gërxhani, and van de Werfhorst 2016; Schneider, Hastings, and LaBriola 2018).4 Increasing competition might arguably render it more difficult for lower-class families to achieve upward mobility, because the advantaged can better adapt to the institutional settings that shape competition (Alon 2009; Delhey, Schneickert, and Steckermeier 2017). The ability of “advantaged and powerful” families to “maintain their . . . position by setting their superior resources strategically against whatever changes—in institutional arrangements, public policy, etc.—may appear threatening to them” (Erikson and Goldthorpe 1992:394) varies with the extent of their resources relative to others.
Most previous research ignores such between-class inequality as the key explanans for cross-country variation in relative class mobility. Studies either neglect between-class inequality altogether (by assuming that class stratification itself sufficiently “represents” variations in inequality), or they confound inter- with intra-class inequalities by using aggregate measures of economic inequality such as the Gini index. The latter approach has, in general, resulted in a refutation of the inequality-mobility relationship, but the former approach has been unable to fully acknowledge its existence in the first place.
Inequality as Between-Class Resource Distance
To empirically investigate the relationship between inter-class inequality and social mobility, we use a simple but powerful measurement: the distance in mean levels of available resources between any two classes, also termed “resource distance,” that must be overcome in social mobility processes (Keller and Zavalloni 1964).5 The reviewed literature and micro-sociological mobility model suggest that unequal economic and educational resources are both important factors in explaining unequal social mobility between classes. We therefore consider the resource distance between two classes to comprise multiple dimensions of inequality (Mood 2017). All other things being equal, the larger the distance between origin and destination classes, the less likely social mobility will be.
We take the resources in question here as those parents can command to support their offspring’s mobility decisions (e.g., by investing in educational careers, accessing certain social networks, bridging waiting times, buffering failures) and, by doing so, collectively shield their position against aspirational newcomers. Hence, given two otherwise comparable countries, the one with larger between-class resource distances should display lower social-class mobility for two reasons: first, the privileged have greater advantages and the population at large has uneven starting conditions; second, between-class barriers in such a country are more pronounced. We shall investigate three types of between-class inequalities, and additionally a composite measure of total inter-class resource distance.
First, we use available household income as an indicator of between-class economic inequality. Household income allows parents to provide their children with a good start and continued support in their educational and occupational careers (Chetty and Hendren 2018a, 2018b; Chetty et al. 2014; Mayer 2001; Mitnik et al. 2016). All other things being equal, the larger the between-class income difference, the more likely parents in advantaged classes will be to secure their children’s status against the upward mobility aspirations of the lower classes, and the less likely the latter will be to successfully compete with the former.
Second, the same holds for educational gaps between classes, given the importance of parents’ education (i.e., their “cultural capital”) in advancing their children’s educational and occupational opportunities (Bourdieu 1984; Jæger and Breen 2016; Pfeffer and Hertel 2015). Higher parental educational attainment may help families realize and execute mobility strategies by granting them privileged access to information about the educational system (Baker and Stevenson 1986; Lareau 1989; Pfeffer 2008) and better learning environments, but also by providing a reference point for educational aspirations (Breen and Goldthorpe 1997; Davies, Heinesen, and Holm 2002).
Third, class differences in economic rewards are an important additional dimension of between-class inequalities. Whereas class differences in household income are affected by household composition, working hours, and welfare state redistribution, class differences in hourly wages directly reflect unequal economic returns from occupations. As Erikson and Goldthorpe (1992:124) argue, hierarchical differences between classes are “essentially reflecting differences in rewards and in entry requirements.” Such differences are, among other factors (e.g., productivity), related to different levels of closure, limiting access to occupations (Collins 1979; Parkin 1974, 1979). Hence, we use hourly wages as an additional indicator for between-class inequalities, assuming a negative effect on mobility chances due to efforts to shield higher occupations from increased influx.
Other potentially important dimensions of between-class inequality—such as those related to the ownership of business, land, and other forms of wealth, or to regulations such as business and (inheritance) tax laws—might also explain cross-country differences in mobility. However, these are beyond the scope of this article to consider (Wright 1989, 1997). In the following, we study the relationship between social mobility and each of the three dimensions of inequality described above; we also consider these dimensions jointly, as a more comprehensive measure of the overall socioeconomic distance between classes. We use this composite measure in the second set of analyses, where we investigate OD class combinations separately.
Hypotheses
Informed by our review of past research and our theoretical model, we conduct two different types of analysis. First, we explore whether between-class inequality relates to social fluidity:
Hypothesis 1: Greater inequality in economic and cultural resources is linked to lower relative mobility chances.
As mentioned, we conjecture that past studies’ contradicting results regarding the effect of inequality on class mobility might be due to their confounding inter-individual with between-class inequalities. This assumption leads to our second hypothesis:
Hypothesis 2: The impact of inequality on social fluidity is driven by the extent of between-class inequalities, rather than by overall economic inequality.
Finally, given our previous discussion of the impact of structural measures on mobility, we study whether welfare state regimes can enhance mobility beyond what they do to reduce resource inequalities:
Hypothesis 3: Welfare state regimes have a direct impact on relative mobility, beyond their indirect impact through inequality reduction.
The assumed differential effects on higher and lower classes further suggest that we need to study disaggregated mobility chances instead of only analyzing uniform patterns (Goodman and Hout 1998). Hence, we move beyond aggregating between-class inequality and mobility on the country level and instead directly assess the covariance of the overall resource distance and the intergenerational association between all pairs of social classes across countries. We deem such an approach more consistent with the institutionally embedded class-structural explanation of the link between inequality and mobility outlined earlier.
Hypothesis 4: Relative mobility chances between any two (different) social classes vary according to the resource distance between said classes.
As stated earlier, we expect the effect of between-class inequality to be especially pronounced between the highest and lowest classes, because resource differences are used to foster immobility at the top and therefore reduce mobility from below:
Hypothesis 5: The relationship between resource distance and relative mobility chances is strongest between the highest and lowest class positions.
In short, we conceptualize social space as delimited by classes that coincide with typical resource endowments and mobility-deflecting boundaries related to exclusionary investment practices and social closure. We consider three dimensions of inequality as relevant to mobility, namely disposable household income, education, and hourly wages (including earnings from self-employment). The larger the overall between-class inequality in one of these dimensions, the less open a society will be. Similarly, the larger the overall distance between any two classes, the lower their respective intergenerational association will be.
Data, Variables, and Methods
Data
To test our hypotheses, we compiled a cross-country mobility dataset (MDS) with nationally representative samples from surveys conducted between 1999 and 2010 that were specifically designed for cross-country comparisons: the European Social Survey (ESS) fielded biannually between 2002 and 2010 (ESS 2016), the European Value Study (EVS) fielded in 2008 (EVS 2016), the International Social Survey Programme (ISSP) fielded in 1999 and 2009 (ISSP Research Group 2014), the EUREQUAL surveys (EU-EQ) conducted in 2007 in Central and Eastern European countries (Whitefield and Evans 2015), the Adult Literacy and Life Skills Survey (ALL) conducted in 2003 and 2008 (OECD 2013), and, for the United States, the biannually collected data from the General Social Survey (GSS) from 2000 to 2010 (Smith et al. 2018). According to the international survey programs that coordinated cross-country data collection efforts, the resulting surveys are highly comparable and frequently administered by the same national teams across programs, or else modeled after each other among programs (e.g., the GSS offering a blueprint for other surveys). The tables in Part B of the online supplement provide information on the field method, sampling universe, and response rates for the 216 national surveys used here, as well as information on missing data and sample sizes.
In total, we obtained social mobility data for 39 different countries (the country list and country codes are available in Part A of the online supplement). We selected countries based on three criteria: (1) samples were nationally representative, (2) surveys included either EGP classes for social origins and current occupations, or else the occupational codes and additional information on employment status required to construct them using the routine provided by Ganzeboom and Treiman (2003, 2013),6 and (3) we were able to construct between-class inequality measures based on the inequality dataset described below.
The MDS contains information from respondents born between 1949 and 1985, that is, age 25 to 65 between 1999 and 2010 when the surveys took place, and not enrolled in any kind of educational program at the time. After performing a list-wise deletion of individuals for whom we lacked information regarding origin (22,965), destination (21,107), or gender (62), we obtained a sample of 83,618 men and 92,777 women. These 176,395 individuals are the basis for our measurements of social mobility in the 39 countries for which we additionally obtained inequality data.7
To construct the inequality measures used in our analyses, we further included national samples from the European Union Survey on Income and Living Conditions (EU-SILC), conducted annually between 2005 and 2010.8 The EU-SILC waves and the national samples from all seven survey programs comprise our inequality dataset (IDS), which we use to calculate the between-class inequality measures described below. We measure income inequality using data from the EVS, the ISSP, and the GSS; wage inequality with data from the EU-SILC, the ISSP, the EU-EQ, and the GSS; and educational inequality with data from all surveys except the EU-SILC (Tables D.1, D.2, and E.1 in the online supplement provide information on data sources by country). The IDS country samples used to construct inequality measures were generally larger than the samples in the MDS because we do not condition on available origin data and we use different age ranges (details below).
Note that measures of between-class inequality based on the IDS pertain to contemporary inequality. In general, it would have been preferable to measure between-class inequalities when respondents were growing up. After extensive debate, we abandoned this idea due to data limitations, similar to many previously published studies (Andrews and Leigh 2009; Björklund and Jäntti 1997; Breen and Luijkx 2004b; Erikson and Goldthorpe 1992). The available data for some countries would have allowed us to at least approach the time in which respondents were teenagers. This advantage, however, would have entailed a decrease or even loss in the comparability and quality of the data due to the considerable increase in economic inequalities over time. Therefore, retrieving inequality data for all countries at the same point in time seemed more important than retrieving data for each individual country as close as possible to respondents’ time of birth, which would have resulted in confounding inter-country differences with intertemporal ones.9 Although this constitutes an important restriction, it is the least bad choice regarding comparability and data availability. The chosen approach assumes that cross-country variation (or ranking) in between-class inequality remained largely stable over time (see Part F of the online supplement for an analysis of this assumption for the few countries where we obtained comparable data over a longer period).
In constructing the MDS and IDS, we decided to pool observations from different sources, in some cases even for the same country. This decision allows us to study more countries than are usually included in comparative mobility research. Moreover, the larger sample sizes in the MDS allows us to observe more mobility between classes, increasing the likelihood of detecting country differences in mobility and helping avoid estimation problems associated with zero cell counts in mobility tables (Fienberg and Rinaldo 2007). Regarding the IDS, combining different surveys for most countries was necessary to ensure the best data quality. For instance, EU-SILC generally has the largest sample sizes and comparable data on wages, but it only collects highly aggregated data on educational attainment that cannot be used to construct (acceptable) between-class educational inequality measures. Our strategy of mixing surveys, however, is not unproblematic given survey differences in sampling and data collection. We discuss specific issues regarding measurement differences in more detail in the following section, and we address potential concerns about this strategy in extensive robustness and sensitivity analyses that overall validate the presented findings.
In the MDS and IDS, the six-fold version of the EGP class scheme serves as an indicator of respondents’ origin and current classes (Erikson and Goldthorpe 1992; Goldthorpe 2007a). Depending on employment status, supervisory function (if available), and number of employees, working individuals were allocated to one of the following six classes: high service class (HSC), low service class (LSC), routine nonmanual class (RNM), (small) self-employed and farmers (SEF), skilled working class (SWC), or unskilled working class (UWC). Arguably, these classes reflect the basic vertical differentiation between occupational positions in developed countries with market economies, as well as the horizontal differentiation between self-employed (in- and outside agriculture) and employees. This scheme has achieved paradigmatic status in (comparative) mobility studies over the years (Beller and Hout 2006; Breen 2004; Bukodi et al. 2017; Erikson and Goldthorpe 1992). In this article, “destination class” refers to each respondent’s class at the time of the survey, that is, some year between 1999 and 2010; “origin class” refers to retrospectively collected (highest) class attained by respondents’ parents while respondents grew up. If information for mother’s class was unavailable in the MDS, social origins refer to the father’s occupation only.
To test our hypotheses, we performed two separate sets of analyses and hence used two sets of dependent and independent variables. In the first analysis, we examined the relationship between overall societal openness to intergenerational mobility and multidimensional between-class inequality on the macro level (Hypotheses 1, 2, and 3); in the second analysis, we focus on cross-country variation in the relationship between overall resource distance and intergenerational association for all OD class combinations (Hypotheses 4 and 5).10
Variables and Methods I: Aggregated Social Mobility and Between-Class Inequality
The dependent variable in the first analysis is the uniform difference (Unidiff) (Erikson and Goldthorpe 1992) or log-multiplicative layer effect (Xie 1992) parameter as an overall measure of the openness of a society’s class structure. We calculate this parameter based on the cross-classification of origin and destination classes by country provided in the MDS. Assuming a similar pattern of intergenerational association across countries, the Unidiff model allows us to estimate a parameter accounting for cross-country differences in the strength of this association, net of cross-country differences in origin and destination class distributions. Because intergenerational associations related to immobility are generally much larger than association parameters in off-diagonal cells, we control for this by fitting the diagonal cells (collapsed across countries) with immobility parameters; we did this to avoid confounding social mobility chances with the propensity for immobility. A more detailed explanation, including model specifications and fit statistics, is provided in Part C of the online supplement. Throughout the analysis, we report the additive inverse of the Unidiff parameter, so that a higher value indicates higher mobility chances (i.e., weaker intergenerational associations).
The main independent variables in the first set of analyses are between-class inequality measures based on the IDS data. Following our earlier reasoning, we consider between-class inequality in terms of differences in education, household income, and wages. We measure each dimension as follows: we average the number of years for which formal education was received, counterfactually predict gross hourly wages (including self-employment earnings) for a standard 40-year-old, and calculate disposable household incomes for each EGP class in every country. To obtain the distance measures, we took the ratio of resource averages for each possible OD class combination (further information on the calculation of between-class inequality measures is provided in Part F of the online supplement).
We chose to work with ratios because they are unit-free and therefore independent from cross-country differences in currency, purchase power, inflation, and (to a limited extent) measurement scale issues. These ratios constitute our core independent variables. In the first set of analyses, we use the standard deviation of the 15 inequality ratios (6 times 6 classes minus 6 immobility cells, divided by 2 because of the symmetry of the distance ratios) in each country as a measure of the overall dispersion of class distances in each of the three inequality dimensions. We also perform sensitivity analyses for alternative choices of the measure of aggregated between-class inequality, detailed in the Sensitivity Checks section.
Because our number of observations is limited, we can only control for a limited number of factors. Hence, we chose two broad institutional variables that might correlate with mobility chances and are theoretically interesting. First, we include the average United Nations (2015) Human Development Index (HDI) recorded between 2000 and 2010 as a proxy for countries’ overall level of development. These figures account for cross-country variations in combined levels of economic development, educational expansion, and health—all factors that supposedly vary with the intergenerational transmission of advantage according to modernization theory (Breen 2010a; Eriksson, Bratsberg, and Raaum 2005; Yaish and Andersen 2012). Second, we account for systematic cross-country differences in welfare state systems. We consulted the work of Beller and Hout (2006) when matching countries to Esping-Andersen’s (1990, 1996) welfare-state regime typology and used additional literature for countries not covered in their study (Huber 1996; Kim 2014; Stambolieva and Dehnert 2011; Lee and Ku 2007). In addition to the three basic regime types—social democratic, liberal, and conservative (including southern European countries)—we added the Eastern European transitional welfare state model (Standing 1996). As a reference, we chose the conservative continental welfare-state regime type as the most frequent and least mobile one (Beller and Hout 2006).
To gauge the significance of multidimensional between-class inequalities vis-à-vis more established inequality measures, we compare the former’s effect on mobility with that of four conventional measures for 33 of our 39 countries, as registered between 2000 and 2010 by the World Bank. All four indicators are common measures of economic inequality: the Gini coefficient represents income distribution between households ranging from zero (i.e., all households in one country obtain the same income) to one (i.e., one household commands all income); the two income shares measure concentration of incomes at the top and bottom of the distribution, respectively; and the poverty rate represents the population share at less than 50 percent of the median household income. We provide all data points in Tables E.1 and E.2 in the online supplement.
Regression Models I
In our first set of analyses, we regress the Unidiff parameter for overall strength of intergenerational class association on different aggregated country-level inequality measures (Breen 2004; Pfeffer 2008). Following Bernardi and Ballarino (2014), we apply a weighted least-squares design, with weights equaling the inverse of the squared (quasi-)standard errors from the Unidiff model, to account for the uncertainty with which the dependent variable is estimated (Firth 2003; Lewis and Linzer 2005). We report standardized beta coefficients with robust standard errors.
This analysis aims to establish between-class inequalities as important drivers of overall societal openness, while also controlling for individual countries’ socioeconomic development (as per the HDI) and dominant welfare-state regime type (Hypotheses 1 to 3). Our central independent variables are the (intra-country) standard deviation of between-class average resource ratios, where resources include the average number of years of formal education received, (post-government) household incomes, and predicted (market) wages.
Variables and Methods II: Mobility Chances and Between-Class Inequality
In the second set of analyses, we move beyond aggregate correlations between inequality and fluidity and look at the direct links between resource distances and intergenerational associations for specific OD class combinations. We do so to identify pairs for which inequalities particularly constrain mobility (Hypotheses 4 and 5). Forgoing the assumption of a uniform pattern of social mobility, the dependent variables considered in our second set of analyses are the association parameters pertaining to the 30 OD combinations for which O ≠ D (i.e., the off-diagonal cells); the latter were obtained by fitting a saturated log-linear model calculated separately by country and gender (Tyree et al. 1979). We ignore immobility parameters because we are interested in the relationship between inter-class inequalities and mobility.
Our focal predictor in the second set of analyses is the between-class distances for the respective OD combinations. We obtained these distances by creating an additive scale for the three inequality ratios corresponding to each OD combination, after inverting the inequality ratios that are smaller than 1 for OD combinations in the lower half of the mobility table. A Cronbach’s alpha of .87 for men and .83 for women across all OD combinations indicates acceptably high internal consistency of the three ratios, and an exploratory factor analysis confirms there is only one latent construct underlying the three inequality measures (results are available upon request). We take the sum of the three ratios as our preferred measure of total distance (the reported substantial conclusions are unaffected by standardization of the items prior to forming the index). We again control for the HDI in our analyses, but we also include welfare-state regime type controls in additional models (reported in Table H.5 in the online supplement).
Regression Models II
As in our first set of analyses, we proceed in two steps. We first calculate, separately for gender, the dependent variable as the net association between origin and destination classes in any OD pair, based on a saturated log-linear model fitted to each country’s mobility table obtained from the weighted MDS data (Powers and Xie 2008; see Part C of the online supplement for the log-linear model and Part G for all intergenerational association parameters and inequality ratios).
As a second step, we regress each of the 30 country-specific intergenerational association parameters on the between-class inequality distances obtained by adding the three resource ratios. To allow for comparison of the regression coefficients across models for each OD combination, we report standardized beta coefficients. All 30 regression models account for cross-country differences in socioeconomic development by including the HDI. The cross-country regression is again a weighted least-squares regression with robust standard errors; it is weighted by the inverse of the squared standard errors of the OD association parameter, to account for heteroscedasticity and imprecision due to estimation of the parameter of interest in the first step.
Results: How Between-Class Inequality Is Related To Social Mobility
Covariation of Social Mobility and Between-Class Inequality across 39 Countries
Our first set of analyses examines whether between-class inequality in education, income, and wages account for cross-country differences in social fluidity. Figure 1 shows the distribution of the focal dependent variable in our first analysis: the country-specific Unidiff parameter representing the strength of intergenerational associations. A value of zero equals the mean associational strength for each gender-specific sample. We grouped country parameters according to the type of welfare state regime.
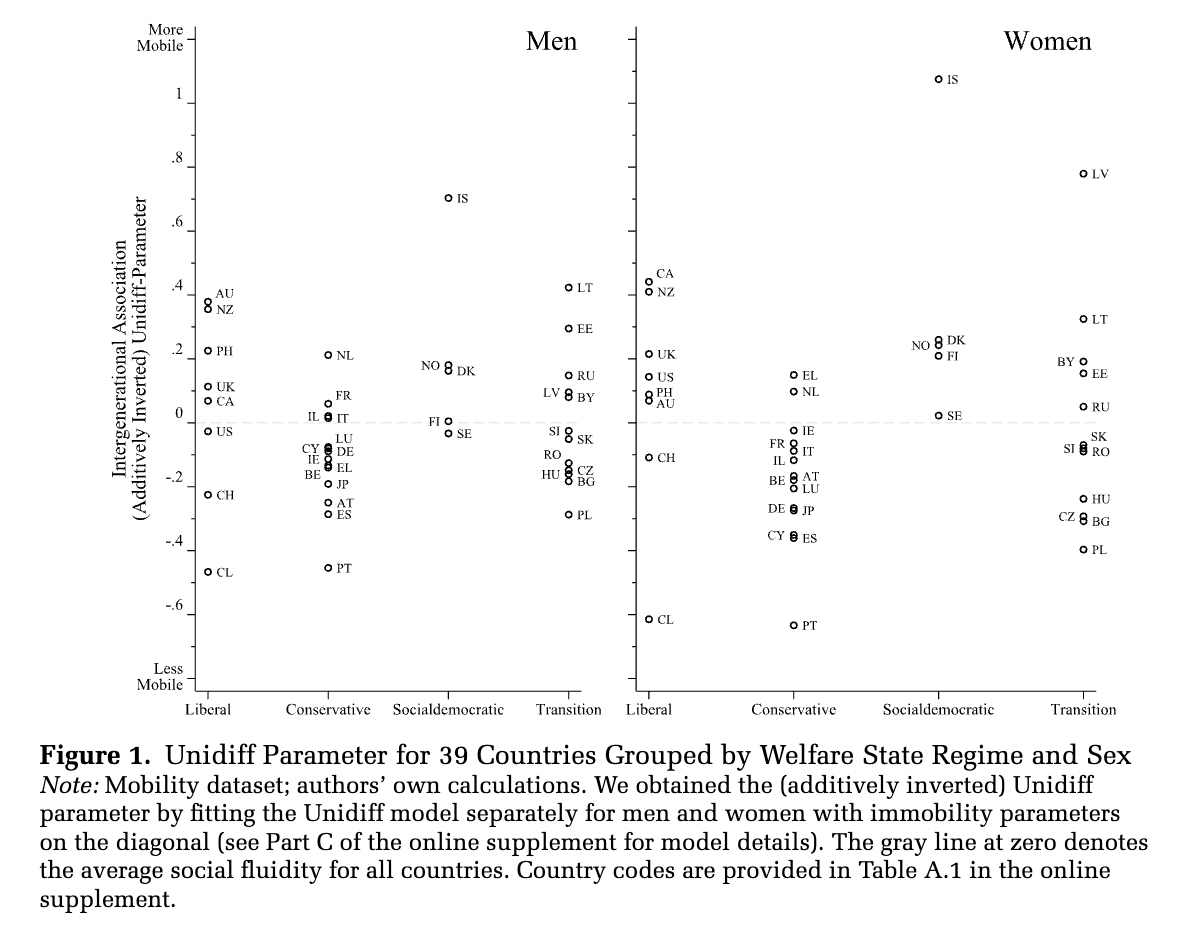
Relative social mobility varies between and within welfare state regimes. Countries with conservative welfare state regimes are the most similar, and they typically display below-average social fluidity (Beller and Hout 2006). Countries with social-democratic welfare state regimes, on the other hand, have above-average fluidity levels (Esping-Andersen and Wagner 2012). Countries with liberal or Eastern European transitional welfare state regimes exhibit greater heterogeneity. Those with liberal welfare state regimes tend to rank above average in terms of social fluidity, particularly regarding women, for whom the intergenerational association is on par, on average, with that observed in social-democratic welfare state regimes. The cluster of countries with transitional welfare states shows no clear openness patterns, substantiating doubts about whether these countries conform to a cohesive type of welfare state or mobility regime in the first place (Bukodi and Goldthorpe 2018; Haggard and Kaufman 2009).
Figure 2 displays the predictor variables of interest: the standard deviations of between-class inequality ratios for wages (rectangles), education (diamonds), and household income (triangles). Countries are ranked according to total between-class distance. We again find some variation in between-class inequalities across and within welfare state regimes. In general, countries in the Nordic cluster display lower inequalities (the one exception is Sweden). Conservative welfare states cluster below average, and Eastern European and liberal welfare states display both the lowest and highest between-class inequalities. The highest inequalities are found in Chile and the Philippines, which, according to the World Bank, also rank high with regard to household income inequality as measured by the Gini coefficient.
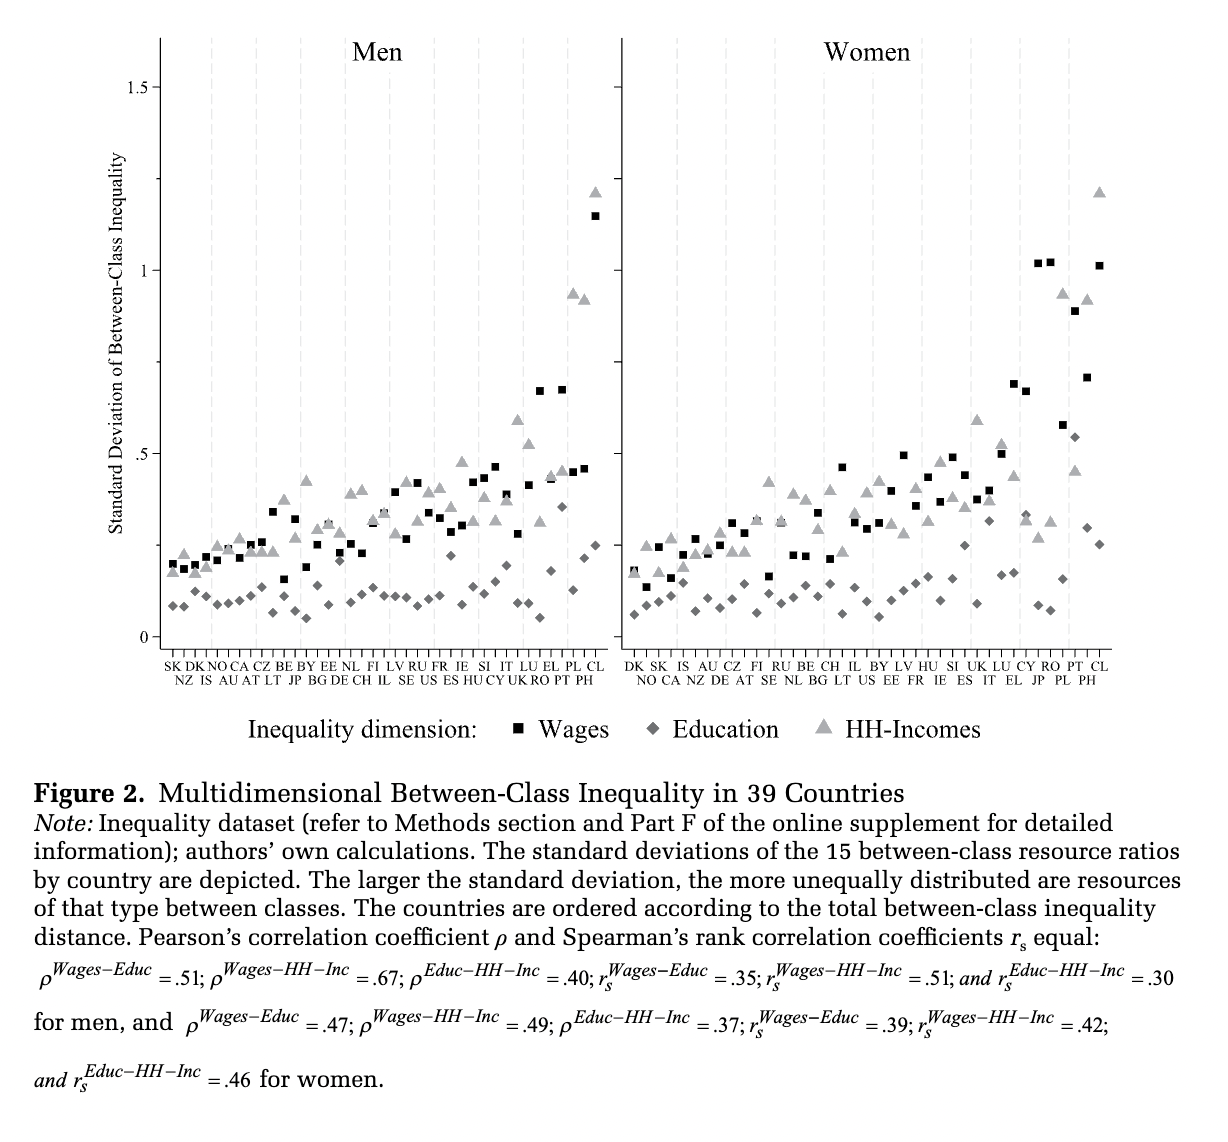
Figure 3 displays the analog of the Great Gatsby curve based on our 39 countries. It shows the bivariate distribution of between-class resource distances (i.e., the sum of the standard deviations of the three inequality ratios) and the level of social mobility as summarized by the (additively inverted) Unidiff parameter for men (upper panel) and women (lower panel).13 As shown by the fitted regression line, the results support the idea of a moderate correlation between inequality and mobility across countries (𝜌𝑚𝑒𝑛=−.522ρmen=−.522 and 𝜌𝑤𝑜𝑚𝑒𝑛=−.523ρwomen=−.523). Chile, Portugal, and Poland exhibit particularly high levels of between-class inequality combined with low levels of social fluidity, whereas Iceland, Denmark, New Zealand, and Norway exhibit higher levels of fluidity and lower class inequalities.
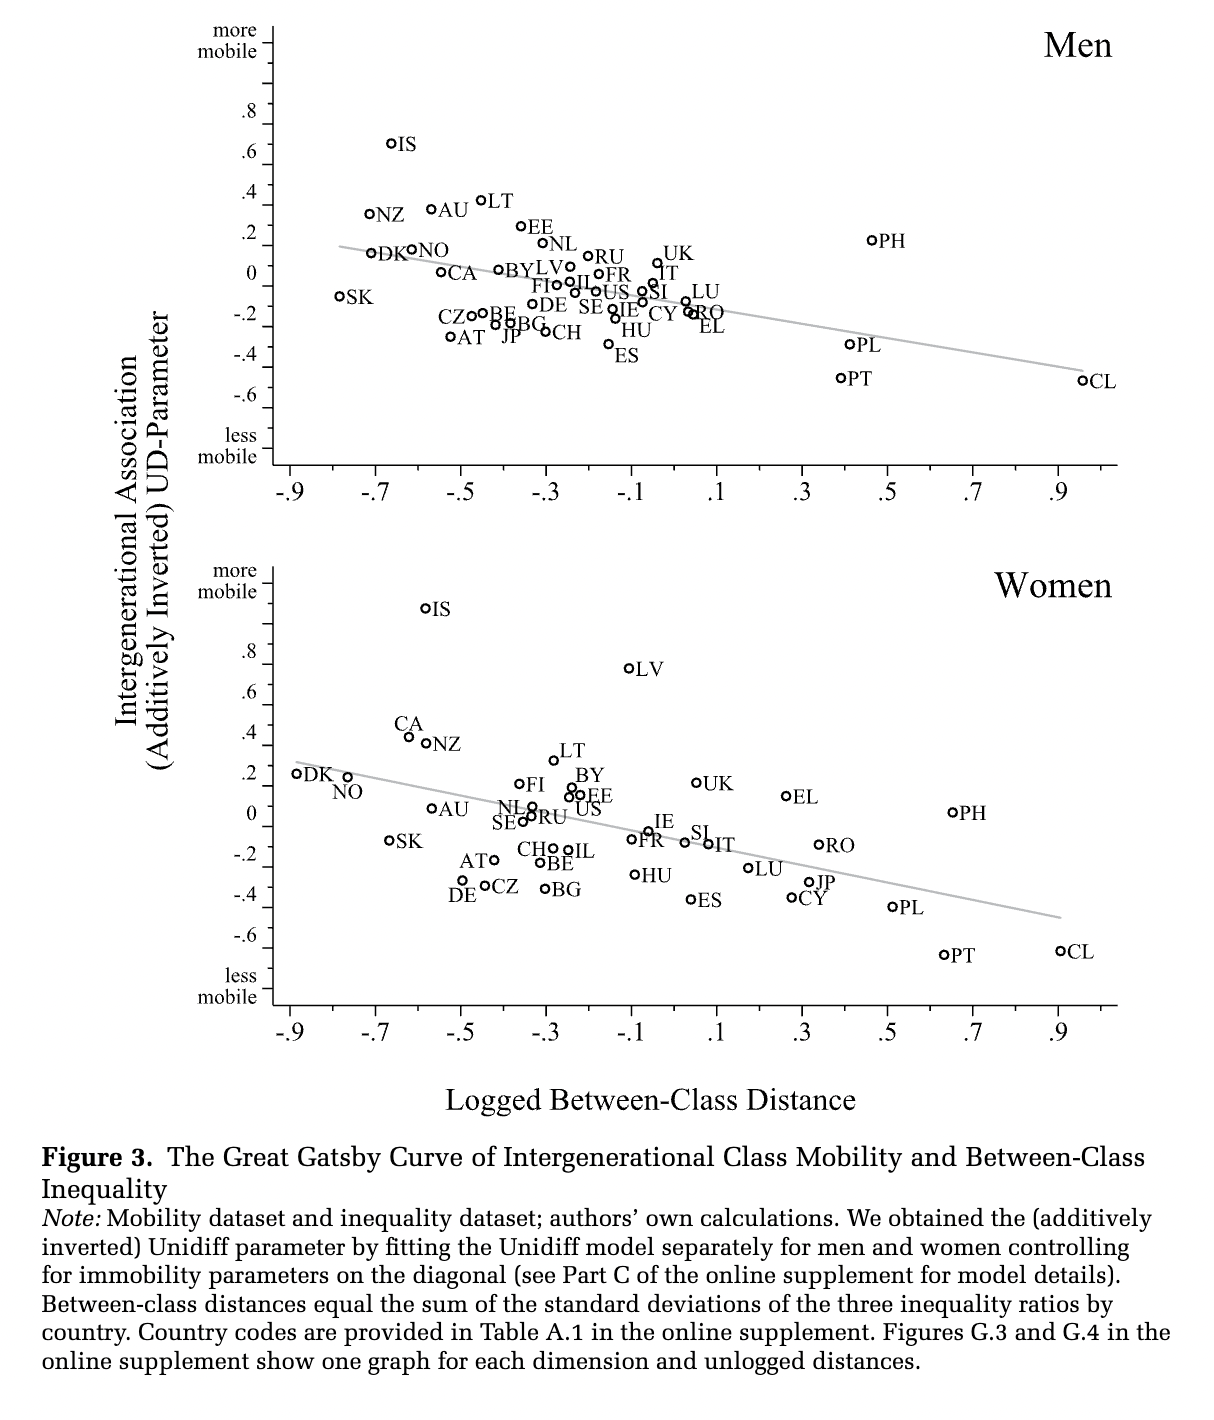
Our results (based on 39 countries) largely resemble the Great Gatsby curve (based on 21 countries; see Corak 2016), with some exceptions. Most notably, Sweden and Finland are among the most equal and mobile countries with regard to (men’s) individual earnings inequality and earnings elasticities, but they occupy the middle of the distribution regarding class inequality and mobility.
Relationship between Aggregated Between-Class Inequality and Social Fluidity
To test our hypotheses regarding the relationship between multidimensional between-class inequality and social fluidity (Hypothesis 1), the role of inter-class inequality vis-à-vis global measures of inequality (Hypothesis 2), and the mediating role of welfare states (Hypothesis 3), we use multiple regression and structural equation models. Tables 1 and 3 report results obtained from models regressing the Unidiff parameter on the three between-class inequality measures, the type of welfare state regime, and the human development index. Tables 2 and 4 present results from additional models to compare the performance of inter-class inequality measures with that of more conventional measures of aggregate inequality.
The baseline model (M1 in Table 1) includes only the control variables. In line with the literature, social fluidity among men is significantly higher in countries with social-democratic welfare regimes than in those with conservative welfare regimes (Beller and Hout 2006). Although substantial in size, the (standardized) level of modernization as measured by the human development index is not significantly associated with higher relative mobility. This finding offers little support for the industrialization thesis (Ganzeboom et al. 1989).
Table 1. Standardized Coefficients from Regressions of the Unidiff Parameter on Countries’ Level of Between-Class Inequality and Selected Covariates in 39 Countries, Men
| M1 | M2 | M3 | M4 | M5 | M6 | M7 |
Welfare Regime (ref. Conservative) | |||||||
Liberal | .085 |
|
|
|
|
| .035 |
Social-Democratic | .273* |
|
|
|
|
| .160 |
Transitional | .339 |
|
|
|
|
| −.147 |
Modernization | |||||||
HDI | .393 |
|
|
|
| .187 | −.005 |
Between-Class Inequality | |||||||
Educational Inequality |
| −.612*** |
|
| −.586*** | −.601*** | −.628*** |
HH-Income Inequality |
|
| −.374*** |
| −.313* | −.354** | −.335** |
Earnings Inequality |
|
|
| −.419** | .044 | .161 | .127 |
R-Squared | 18.5% | 37.4% | 14.0% | 17.6% | 45.7% | 48.4% | 51.4% |
R-Squared (adj.) | 8.9% | 35.7% | 11.7% | 15.4% | 41.1% | 42.3% | 40.4% |
BIC | −12.761 | −34.075 | −21.685 | −23.340 | −32.308 | −30.604 | −21.918 |
Note: Mobility dataset; authors’ own calculations. N = 39. Robust standard errors. We weighted regressions with the inverse of the quasi-standard errors of the Unidiff parameter. p < .05; **p < .01; ***p < .001 (two-tailed t-tests).
Models 2 through 4 present evidence of an inverse relationship between the dispersion of between-class inequality ratios and mobility chances for each of the three dimensions under study. A difference of one standard deviation in between-class educational inequality is associated with a reduction in relative mobility chances of –.612 standard deviations, which is roughly the difference in intergenerational mobility chances between (more mobile) Norwegian and (less mobile) Chilean men. Correspondingly, a larger variation in between-class inequality of household incomes and wages is associated with a reduction in relative mobility chances of –.374 and –.419 standard deviations, respectively. When we include all three inequality dimensions in the model (M5), educational and household income inequalities remain statistically significant, whereas the effect of the dispersion of inter-class wage ratios is substantially reduced 𝛥𝑏𝑒𝑎𝑟𝑛=−.463,𝑠.𝑒.=.172,𝑝=.007Δbearn=−.463,s.e.=.172,p=.007
Finally, as shown in models M6 and M7, the statistically significant effect of educational and household income inequalities on mobility chances remains even when we control for type of welfare state regime and level of modernization. Further mediation analysis using the product method (VanderWeele 2016) reveals that 41.4 percent of the mobility-enhancing effect associated with social-democratic welfare states is mediated by their reduction of between-class inequalities (𝛥𝑏𝑊𝐹𝑅−𝑆𝐷=.113,𝑠.𝑒.=.067,𝑝=.091(ΔbWFR−SD=.113,s.e.=.067,p=.091 Whereas educational inequality accounts for 34.4 percent of social-democratic welfare states’ effect, household income accounts for merely 7.0 percent. This result indicates that social-democratic welfare states can increase social fluidity beyond their equalizing economic effects (Nolan et al. 2011; Sørensen 2006).
In our assessment of between-class inequality measures relative to more conventional aggregate measures (Table 2), we disregard countries for which the World Bank does not publish inequality measures: Bulgaria, Belarus, Cyprus, the Philippines, Romania, and—depending on the measure—either New Zealand or Russia.14 Our results emphasize the importance of between-class inequality. None of the parameters for alternative measures are statistically significant on their own. Additionally, conventional measures explain cross-country variation in mobility chances to a far lesser degree than do between-class inequality measures (the adjusted R2 for M5 in Table 1 amounts to 45.7 percent compared to the R2 in Table 2, which is mostly negative or equal to zero). Once we control for inter-class inequality, all four alternative measures change their leading sign. Based on these results, we may conclude that the dispersion of between-class inequality provides a better aggregate measure of inequality where class mobility is concerned than either the global average inequality measure (Gini) or the more conventional distributional indices.
Table 2. Standardized Coefficients from Regressions of the Unidiff Parameter on Conventional Inequality Measures and Between-Class Inequality in 33 Countries, Men
| M1 | M2 | M3 | M4 | M5 | M6 | M7 | M8 |
Aggregate Measures | ||||||||
GINI | −.167 | .166 |
|
|
|
|
|
|
Top 10% Income Share |
|
| −.191 | .169 |
|
|
|
|
Bottom 10% Income Share |
|
|
|
| .037 | −.193 |
|
|
Poverty Rate |
|
|
|
|
|
| −.187 | .060 |
Between-Class Inequality | ||||||||
Educational Inequality |
| −.632*** |
| −.624*** |
| −.667*** |
| −.602*** |
HH-Income Inequality |
| −.414** |
| −.408** |
| −.403** |
| −.369* |
Earnings Inequality |
| .042 |
| .019 |
| .092 |
| .045 |
R-Squared | 2.8% | 51.4% | 3.7% | 51.2% | .1% | 53.0% | 3.5% | 48.4% |
R-Squared (adj.) | −.4% | 44.5% | .5% | 44.2% | −3.1% | 46.3% | .4% | 41.1% |
BIC | −14.167 | −26.57 | −14.463 | −26.423 | −13.281 | −27.671 | −12.861 | −23.052 |
Note: Mobility dataset; authors’ own calculations. N = 33. Robust standard errors. We weighted regressions with the quasi-standard errors of the Unidiff parameter. Compared to models in Table 1, models M1 to M5 exclude Bulgaria (BG), Belarus (BY), Cyprus (CY), New Zealand (NZ), Philippines (PH), and Romania (RO) because the World Bank does not provide the respective alternative inequality measures for the years 2000 to 2010. Models M6 and M7 additionally exclude the Russian Federation (RU) but include New Zealand (NZ) due to the availability of poverty rate data.
p < .05; **p < .01; ***p < .001 (two-tailed t-tests).
Tables 3 and 4 present corresponding parameter estimates from the regression models for women. We find almost no gender-based differences, except for a stronger and more persistent effect of welfare-state regime type for women. The baseline model (M1 in Table 3) and bivariate relationships between social fluidity and the inequality dimensions (M2, M3, and M4) show that relative mobility chances for women are higher in less unequal societies and in countries with social-democratic welfare regimes. Additionally, unlike men, women have greater mobility chances under liberal welfare state regimes than under conservative ones. Greater fluidity in the former might be due to the wider range of opportunities available to well-educated women (Beller and Hout 2006; DiPrete 2002). A one standard deviation increase in educational inequality reduces mobility chances by –.628 standard deviations, which equals the degree to which Latvian women are more mobile than U.S. women. Once we include all three inequality measures (M5), educational inequality remains the sole significant negative predictor of relative mobility chances, emphasizing the mediating role educational inequality plays with regard to social fluidity (𝛥𝑏𝑒𝑎𝑟𝑛=−.423,𝑠.𝑒.=.155,𝑝=.006(Δbearn=−.423,s.e.=.155,p=.006 and 𝛥𝑏𝐻𝐻𝐼𝑛𝑐=−.192,𝑠.𝑒.=.095,𝑝=.044ΔbHHInc=−.192,s.e.=.095,p=.044
Table 3. Standardized Coefficients from Regressions of the Unidiff Parameter on Countries’ Level of Between-Class Inequality and Selected Covariates in 39 Countries, Women
| M1 | M2 | M3 | M4 | M5 | M6 | M7 |
Welfare Regime (ref. Conservative) | |||||||
Liberal | .309 |
|
|
|
|
| .281* |
Social-Democratic | .385*** |
|
|
|
|
| .290** |
Transitional | .365 |
|
|
|
|
| −.105 |
Modernization | |||||||
HDI | .411 |
|
|
|
| .256 | .006 |
Between-Class Inequality | |||||||
Educational Inequality |
| −.628*** |
|
| −.491*** | −.563*** | −.584** |
HH-Income Inequality |
|
| −.326** |
| −.134 | −.190 | −.264** |
Earnings Inequality |
|
|
| −.568*** | −.145 | .058 | .117 |
R-Squared | 35.4% | 39.4% | 10.6% | 32.3% | 43.4% | 48.1% | 59.5% |
R-Squared (adj.) | 27.8% | 37.8% | 8.2% | 30.5% | 38.5% | 42.0% | 50.4% |
BIC | 1.684 | −11.825 | 3.345 | −7.496 | −7.132 | −6.846 | −5.593 |
Note: Mobility dataset; authors’ own calculations. N = 39. Robust standard errors. We weighted regressions with the inverse of the quasi-standard errors of the Unidiff parameter.
p < .05; **p < .01; ***p < .001 (two-tailed t-tests).
Table 4. Standardized Coefficients from Regressions of the Unidiff Parameter on Conventional Inequality Measures and Between-Class Inequality in 33 Countries, Women
| M1 | M2 | M3 | M4 | M5 | M6 | M7 | M8 |
Aggregate Measures | ||||||||
GINI | −.152 | .187 |
|
|
|
|
|
|
Top 10% Income Share |
|
| −.195 | .160 |
|
|
|
|
Bottom 10% Income Share |
|
|
|
| −.020 | −.260 |
|
|
Poverty Rate |
|
|
|
|
|
| −.111 | .192 |
Between-Class Inequality | ||||||||
Educational Inequality |
| −.507* |
| −.500* |
| −.578** |
| −.529** |
HH-Income Inequality |
| −.218 |
| −.209 |
| −.210 |
| −.213 |
Earnings Inequality |
| −.197 |
| −.201 |
| −.129 |
| −.167 |
R-Squared | 2.3% | 50.5% | 3.8% | 49.7% | .0% | 54.0% | 1.2% | 50.2% |
R-Squared (adj.) | −.9% | 43.4% | .7% | 42.5% | −3.2% | 47.4% | −2.0% | 43.1% |
BIC | 5.323 | −6.609 | 4.808 | −6.081 | 6.076 | −9.03 | 8.758 | −3.38 |
Note: Mobility dataset; authors’ own calculations. N = 33. Robust standard errors. We weighted regressions with the quasi-standard errors of the Unidiff parameter. Compared to models in Table 3, models M1 to M5 exclude Bulgaria (BG), Belarus (BY), Cyprus (CY), New Zealand (NZ), Philippines (PH), and Romania (RO) because the World Bank does not provide the respective alternative inequality measures for the years 2000 to 2010. Models M6 and M7 additionally exclude the Russian Federation (RU) but include New Zealand (NZ) due to the availability of poverty rate data.
p < .05; **p < .01; ***p < .001 (two-tailed t-tests).
Adjusting for the HDI (M6) and welfare regime type (M7) does not reduce the effect of inequality on intergenerational fluidity, although once we control for regime type, educational and household income inequalities are significantly related to social fluidity among women. A mediation analysis, however, reveals that liberal and social-democratic welfare regimes’ mobility-enhancing effects are not significantly reduced after accounting for inequality (𝛥𝑏𝑊𝐹𝑅−𝐿𝑖𝑏=−.028,𝑠.𝑒.=.074,𝑝=.706(ΔbWFR−Lib=−.028,s.e.=.074,p=.706 and 𝛥𝑏𝑊𝐹𝑅−𝑆𝐷=−.094,𝑠.𝑒.=.070,𝑝=.182ΔbWFR−SD=−.094,s.e.=.070,p=.182 These results demonstrate that inter-class inequality reduction is not the only way in which welfare states increase women’s fluidity. The aforementioned study by Beller and Hout (2006) suggests that cross-country variation in higher educational attainment might substantially explain the remaining effects of welfare regimes. The final model explains roughly 60 percent (adjusted 50 percent) of cross-country variation in women’s social fluidity.
The comparison of conventional inequality measures with those based on educational, income, and wage differences yields similar findings for women as for men. Again, we find that accounting for between-class inequalities accounts for cross-country variation in social fluidity to a much greater degree than do conventional measures (compare the adjusted R2 between any two consecutive models in Table 4). On their own, conventional inequality parameters are not significantly related to mobility chances. Once we control for inter-class inequality, all but one parameter linked to conventional measures changes signs. Hence, for both men and women, dispersion of between-class resource inequalities provides a more accurate predictor of mobility than do conventional inequality measures, which conflate inter- and intra-class inequalities.
Results support Hypotheses 1 to 3: there is a strong negative relationship between the dispersion of inter-class inequality and social fluidity for each of the three dimensions of inequality under consideration (Hypothesis 1); between-class inequality measures significantly outperform conventional inequality measures when it comes to explaining cross-country variations in social fluidity (Hypothesis 2); and social-democratic (and, for women, also liberal) welfare state regimes can increase relative mobility chances beyond their inequality-muting effects (Hypothesis 3).
Relationship between Inter-Class Resource Distances and Relative Mobility Chances
Our second set of analyses aims to identify which intergenerational associations are specifically limited by between-class inequalities (Hypotheses 4 and 5). Hence, we regress the intergenerational association for each OD class combination on the respective total inter-class distance (i.e., the sum of the three resource ratios under consideration) while controlling for the HDI. Tables 5 and 6 display the standardized regression coefficients for between-class distance and modernization level in the first two panels. The R2 for each of the 30 weighted-regression models is reported in the bottom panel.
In the vast majority of OD class combinations, and in all cases in which the inequality parameter turns out to be significant, larger between-class resource distances are linked to lower intergenerational associations for men (see Table 5). In particular, distances are negatively related to associations pertaining to downward mobility chances from LSC to RNM and from RNM to UWC. They are also negatively related to horizontal mobility chances from RNM to SEF and from SEF to SWC. Finally, there are three significantly negative effects pertaining to upward mobility from both UWC and SEF to HSC, and from SWC to LSC.
Table 5. Standardized Coefficients and R2 from Regressions of the Intergenerational Association on Between-Class Resource Distances and HDI for Each OD Combination in 39 Countries, Men
|
| Destination Class | |||||
|
| HSC | LSC | RNM | SEF | SWC | UWC |
| Distance |
|
|
|
|
|
|
Origin Class | High Service Class (HSC) |
| .298 | −.013 | .054 | −.344 | .048 |
| Low Service Class (LSC) | .197 |
| −.266* | .043 | −.049 | −.139 |
| Routine Nonmanual (RNM) | .129 | −.131 |
| −.318* | .022 | −.339* |
| Self-Employed (SEF) | −.634** | −.365 | −.244 |
| −.329* | −.326 |
| Skilled Working Class (SWC) | −.033 | −.400** | .182 | −.225 |
| −.182 |
| Unskilled Working Class (UWC) | −.407** | −.183 | −.222 | −.268 | −.199 |
|
| HDI |
|
|
|
|
|
|
Origin Class | High Service Class (HSC) |
| −.157 | .283 | .168 | −.216 | .008 |
| Low Service Class (LSC) | −.053 |
| −.216 | .038 | .237 | .045 |
| Routine Nonmanual (RNM) | .139 | .091 |
| −.236 | .170 | −.004 |
| Self-Employed (SEF) | −.197 | −.187 | −.123 |
| −.262 | −.025 |
| Skilled Working Class (SWC) | .161 | −.144 | .119 | −.103 |
| .225 |
| Unskilled Working Class (UWC) | .107 | .369 | −.157 | .131 | −.252 |
|
| R2 |
|
|
|
|
|
|
Origin Class | High Service Class (HSC) |
| 14.5% | 8.1% | 2.5% | 12.4% | .2% |
| Low Service Class (LSC) | 4.9% |
| 12.4% | .2% | 6.5% | 2.3% |
| Routine Nonmanual (RNM) | 3.4% | 2.3% |
| 13.4% | 2.8% | 11.4% |
| Self-Employed (SEF) | 28.0% | 8.7% | 5.2% |
| 18.8% | 10.9% |
| Skilled Working Class (SWC) | 3.1% | 14.2% | 3.3% | 5.7% |
| 6.3% |
| Unskilled Working Class (UWC) | 20.1% | 20.6% | 4.3% | 8.4% | 12.7% |
|
Note: Mobility dataset; authors’ own calculations. N = 39. Robust standard errors. Regression coefficients from 30 independent weighted least-squares regressions. We weighted each regression with the standard error of the association parameters.
*
p < .05; **p < .01; ***p < .001 (two-tailed t-tests).
Similarly, resource distances are mostly negatively related to intergenerational associations for women (Table 6), although the relationship is only significant in five cases: from LSC to SWC and from RNM to UWC (downward mobility); and from SWC to LSC, UWC to LSC, and UWC to HSC (upward mobility). In addition, and contrary to our theoretical model, we find one significant positive association between resource distance and mobility chances, from RNM to LSC.
Table 6. Standardized Coefficients and R2 from Regressions of the Intergenerational Association on Between-Class Resource Distances and HDI for Each OD Combination in 39 Countries, Women
|
| Destination Class | |||||
|
| HSC | LSC | RNM | SEF | SWC | UWC |
| Distance |
|
|
|
|
|
|
Origin Class | High Service Class (HSC) |
| .216 | −.046 | −.128 | −.136 | −.217 |
| Low Service Class (LSC) | .069 |
| −.267 | −.228 | −.342* | −.019 |
| Routine Nonmanual (RNM) | −.193 | .295* |
| .127 | −.069 | −.446* |
| Self-Employed (SEF) | −.321 | −.129 | −.154 |
| −.313 | −.041 |
| Skilled Working Class (SWC) | −.150 | −.221* | .043 | .007 |
| −.028 |
| Unskilled Working Class (UWC) | −.334* | −.626** | .212 | −.344 | −.051 |
|
| HDI |
|
|
|
|
|
|
Origin Class | High Service Class (HSC) |
| −.339 | −.315 | .187 | .255 | .092 |
| Low Service Class (LSC) | −.155 |
| −.172 | .104 | .185 | .005 |
| Routine Nonmanual (RNM) | .025 | .026 |
| .105 | −.213 | −.005 |
| Self-Employed (SEF) | .236 | .418 | .018 |
| .042 | −.257 |
| Skilled Working Class (SWC) | −.006 | −.074 | .198 | .054 |
| .147 |
| Unskilled Working Class (UWC) | .182 | −.016 | .327 | .122 | −.226 |
|
| Model R2 |
|
|
|
|
|
|
Origin Class | High Service Class (HSC) |
| 20.4% | 10.0% | 7.2% | 9.9% | 6.6% |
| Low Service Class (LSC) | 3.5% |
| 10.9% | 8.1% | 17.1% | .0% |
| Routine Nonmanual (RNM) | 3.9% | 8.7% |
| 2.0% | 4.4% | 19.7% |
| Self-Employed (SEF) | 26.2% | 25.8% | 2.6% |
| 9.9% | 7.2% |
| Skilled Working Class (SWC) | 2.2% | 4.4% | 3.6% | .3% |
| 2.2% |
| Unskilled Working Class (UWC) | 17.7% | 38.7% | 10.0% | 11.8% | 5.5% |
|
Note: Mobility dataset; authors’ own calculations. N = 39. Robust standard errors. Regression coefficients from 30 independent weighted least-squares regressions. We weighted each regression with the standard error of the association parameters.
p < .05; **p < .01; ***p < .001 (two-tailed t-tests).
These results indicate that inter-class resource distances are inversely related to intergenerational associations between classes. However, we could not find complete support for Hypothesis 4, that larger resource distances between classes are always accompanied by lower intergenerational associations. Likewise, we could not find a clear-cut reason for why some OD class combinations are significantly negatively related to between-class inequality while others are not. A consistent finding is that the intergenerational association between unskilled working-class origins and high service-class destinations is significantly reduced for both men and women in countries where these classes fall apart more strongly in terms of their distance. In general, intergenerational associations pertaining to mobility from the working classes to the service classes appear more strongly related to between-class distances than corresponding downward mobility chances. Hence, Hypothesis 5, stating that mobility between the service and working classes would be particularly affected by inter-class distances, is only partially supported. Our finding, however, does support our proposal that larger between-class distances might especially hinder upward mobility in the lowest social classes, as such a transition is riskier in highly unequal regimes where competition is more pronounced.
Sensitivity Checks and Stability of Results
Given the limited number of observations, the considerably noisy data expected to arise from the diverse surveys we pooled together, and the differences in resource measurements, we carried out various robustness and sensitivity analyses.
First, we excluded all countries with sparse mobility tables (no zero cell counts and fewer than 10 cells below 30 observations) and ran our models again based on 36 mobility tables for men and 35 mobility tables for women. The restricted sample analysis again reveals a negative relationship between the dispersion of inter-class inequality and overall social fluidity, as well as between resource distance and intergenerational associations pertaining to mobility from the unskilled working classes to the service classes for both men and women (results are presented in Tables H.1 to H.4 in the online supplement). We also checked for country outliers and influential cases using robust regressions, and we found little indication that our results might be driven by our selection of countries (mostly because the weighting of the regressions already accounts for imprecise samples).
Second, we used different model specifications to study the OD association parameter, including leaving out the HDI and controlling for type of welfare state regime or for survey-related measurement effects (results are presented in Table H.5 in the online supplement for different specifications of regression models pertaining to working-class and service-class intergenerational associations). Different model specifications had little influence on the results, in particular between the highest and lowest classes.
Third, we addressed concerns about pooling various data sources for the MDS and IDS. We recalculated our main analyses for a subsample of mobility data from the ESS (N = 29) with our original inequality measures and on a further reduced subset of countries for which inequality data based solely on EU-SILC were available (N = 26). We provide the results of these additional analyses covering only European countries in Tables H.6 to H.13 in the online supplement. Results are largely robust, with the restriction that several coefficients do not reach statistical significance if the sample size is reduced.
Fourth, we addressed possible concerns regarding our country-level inequality measure by using the average (instead of the standard deviation) of resource ratios and additionally with the coefficient of variation of the underlying class resources (i.e., avoiding the calculation of pairwise ratios). Both analyses confirm the robustness of our results with coefficients pertaining to inequality being negative and, except for household incomes in the full model, statistically significant (results available in Tables H.14 to H.17 in the online supplement). We defend our choice to use the standard deviation of between-class ratios because of its sensitivity regarding larger deviations from the mean, thereby accounting more accurately for polarization of between-class inequalities. In light of these robust results, we expect better data to more conclusively demonstrate even stronger correlations between inequality and relative mobility chances.
Counterfactual Absolute Mobility under Different Inequality Regimes in the United States
It has become standard practice in social mobility research to show how differences in relative mobility chances affect mobility flows. To determine the effects of inequality on absolute mobility, we built counterfactual mobility tables for the United States, assuming between-class resource distances to equal those found in either the least unequal countries (i.e., Denmark for women and Slovakia for men) or the most unequal country (i.e., Chile for both). Using these distances, we predicted counterfactual association parameters for each off-diagonal cell in the United States mobility table. We then reconstructed cell frequencies based on these counterfactual association parameters and the observed marginal cell frequencies for the United States. The resulting differences in the mobility table are hence solely due to varying resource distances.
Figure 4 presents the data for upward and downward mobility between the UWC and the HSC as they were actually observed (observed bar) and as they would be in a hypothetical, low-inequality United States (minimum) and a hypothetical, higher-inequality United States (maximum) for men and for women. If the resource distance between the HSC and the UWC were equal to that of Denmark or Slovakia, then downward mobility would be substantially more likely among privileged U.S. women (at 12.7 percent) and men (at 26.8 percent) than it currently is (8.8 percent and 12.0 percent, respectively). If, on the contrary, educational and economic resources between the most and least privileged classes were as unequally distributed as they are in Chile, no privileged Americans would experience downward mobility.
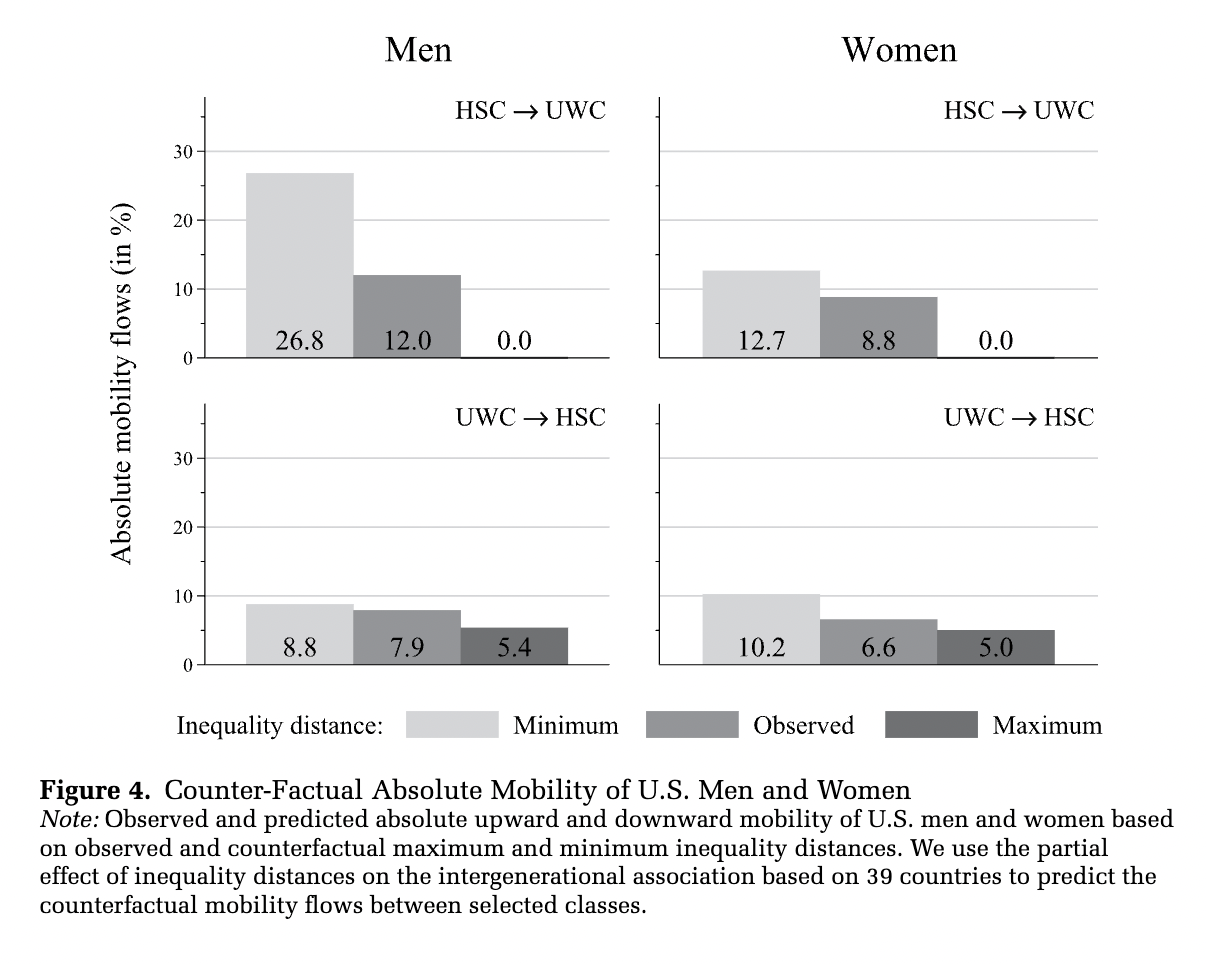
Counterfactual results for upward mobility mirror those for downward mobility. If resource distances between the UWC and the HSC in the United States were equal to that of Slovakia or Denmark, roughly 8.8 percent of men and 10.2 percent of women from the UWC would achieve the so-called American dream, whereas only 7.9 percent of men and 6.6 percent of women currently do according to observed data. On the other hand, long-range upward mobility would drop to 5.4 percent for men and 5.0 percent for women from the least privileged backgrounds if between-class inequalities were to increase to Chilean levels. These simple simulations illustrate the importance of inter-class inequality for absolute long-range upward and downward mobility.
Conclusions and Discussion
Summary and Implications of the Results
The regression models reported in the first step of our analyses provide support for Hypothesis 1: countries with higher inequality levels display lower levels of social fluidity. They also show that the impact of inequality on social fluidity is driven by between-class inequalities rather than by overall economic inequality (Hypothesis 2). Mediation analyses also show that welfare state regimes can enhance mobility chances beyond their reduction of economic inequalities (Hypothesis 3). Net of inter-class inequalities, social-democratic welfare regimes and, for women, liberal ones are linked to higher social fluidity compared to continental welfare regimes. Regarding multidimensionality of inequality, results emphasize the importance of educational and household income inequalities.
The second set of analyses provide partial support for a direct link between inter-class distances and intergenerational association for specific OD class combinations. Thus, Hypothesis 4 cannot be entirely rejected. However, cross-country correlations between distances and mobility chances are neither significant nor negative for all class combinations. Given the uncertainty in our measurements, we take these inconclusive and partly mixed results as providing support for the idea that the link between inequality and mobility can be found in between-class distances. Our analysis does not fully support Hypothesis 5—namely, that the aforementioned link is particularly strong between working and service classes. Although we found a strong correlation between inequality and mobility chances from unskilled working-class origins to (high) service-class destinations, associations pertaining to downward mobility chances are not significantly related to between-class distances. Regarding absolute mobility in the United States, however, our counterfactual exercise shows that, everything else equal, larger inter-class inequality considerably reduces downward mobility.
Cross-national variation in social mobility has not been systematically linked to between-class inequality in prior empirical research (Bukodi and Goldthorpe 2018). Likewise, there is sparse theoretical literature on the potential mechanism linking inequality and class mobility. We argued that inter-class inequality reduces mobility chances by increasing the distances between classes that must then be overcome in mobility processes. These distances directly affect mobility strategies by moderating risk-averse decision-making: when resource distances are large, the propensity for mobility is lower because related strategies carry greater risk in more competitive environments. Consequently, aggregated intergenerational associations are lower. Our finding that larger inter-class inequalities are connected to lower intergenerational associations in both upward and downward mobility provide support for these hypotheses, especially when it comes to mobility from the lowest to highest classes. Children from more disadvantaged backgrounds seem, on average, to refrain from ambitious mobility decisions if favorable class destinations are “too far” for them (Paskov et al. 2016). We cannot directly show this correlation on the individual level, but the regression results support its possibility.
Limitations and Suggestionsfor Future Research
A caveat to our study is that we could not empirically test our theoretical conjecture on the micro level; we could only study aggregated results. Although we did find the expected relationship between inequality and mobility chances, there might be factors other than between-class resource distance that also shape mobility chances. In particular, it is likely that cross-country differences in class composition based on race, ethnicity, or other ascriptive traits additionally shape the inequality distribution and significantly constrain mobility opportunities for minorities (Chetty et al. 2018). Moreover, the role of within-class inequality requires further investigation, in particular from a micro-level perspective. The evidence presented here supports the idea that levels of within-class inequality do not affect class mobility chances once between-class inequality is accounted for, but the potential role of within-class inequality for class mobility remains to be scrutinized. Further research is required to establish whether there is, in fact, a causal link between inter-class distances and mobility chances. Preliminary analyses exploiting longitudinal data of consecutive intra-country cohorts are consistent with our results, albeit at the aggregate class level.
An important limitation to note is the heterogeneity of the data sources. Both the mobility dataset (MDS) and the inequality dataset (IDS) are based on various different surveys. We used this strategy to study more than just the usual European countries and to include populations that are far too often ignored in comparative mobility research, like the populations of Chile, Philippines, and Belarus, as well as Canada, the United States, Israel, and Australia (Breen 2004; Bukodi and Goldthorpe 2018; Erikson and Goldthorpe 1992). Regarding the multiple sources of the IDS, we were forced to use this strategy because none of the datasets provided good measurements for all three indicators. The EU-SILC provides the best (i.e., largest) samples to calculate between-class wage inequality measures, and the EVS provides a reasonably good measure of household income, but neither the EVS nor the EU-SILC allow one to construct between-class educational inequalities, either due to lacking years in education or because of highly aggregated (and in some countries poorly measured) educational categories. The ESS and the ISSP, on the other hand, do not provide good income measures for the purpose of calculating between-class inequality. Hence, we followed the least bad and most exhaustive strategy of obtaining inequality measures for each country from the surveys that appeared to us most appropriate for the construction of each measure.
Our inequality measures could also be improved upon in future work. The lack of significant data on the effects of between-class wage inequality calls for a more direct measurement of cross-country differences in social closure, potentially via microclasses (Weeden and Grusky 2012). Finally, we would have preferred to use household income measurements taken closer to the time in which survey respondents grew up. Due to large cross-country variation in available first measurements and a lack of comparable income data in older surveys, we had to register income inequalities based on contemporary data, much like comparable mobility studies have done (Andrews and Leigh 2009; Björklund and Jäntti 1997; Breen and Luijkx 2004b; Erikson and Goldthorpe 1992). Although this is regrettable in terms of the fit between our theoretical conjecture and our empirical conceptualization, it implies that our findings are not driven by differences in the timing of the measurements; they follow from using between-class distance measurements instead of global average inequality measurements.
The lack of correlation between resource distances and mobility chances for all OD combinations may be due to other issues, such as the limited number of between-class resource measures we could use (i.e., education, household income, and wages). Other stratifying resources, such as wealth, property ownership, cross-country parenting styles, or inter-class affinities might help to better understand the correlations presented here (Lareau 2015; Pfeffer 2018). Future research should attempt to use a wider range of measures to adjust for cross-country institutional differences, which might affect mobility and account for unobserved heterogeneity among countries.
Keeping these caveats in mind, it is important to note that we did not aim to provide a causal analysis of the relationship between inequality and mobility, but rather a conceptually innovative, descriptive account from a sociological perspective. Sociologists have only recently concluded that there has been a modest rise in social fluidity in most countries over the course of the prosperous decades following World War II (Breen 2004; Hertel 2017), but this subtle trend toward openness may mean little to individuals born in this era of increasing inequality. Although we cannot evaluate such a conjecture based on this analysis, we can state with certainty that current mobility chances are more unequally distributed in countries marked by larger between-class inequalities.
Acknowledgments
This paper is the product of a long production process. The ideas behind it took shape during 2015 and 2016, when its first author was a Max Weber Fellow at the European University Institute (EUI). Our research greatly profited from the exceptional academic atmosphere at the EUI, and in particular, from the SPS Department’s Inequality Working Group. Earlier versions of the paper were presented at the DGS Meeting in Bamberg, the RC-28 Summer Meeting in Bern, the EUI Max Weber Conference in Florence, and the 112th ASA Annual Meeting in Montréal. While audiences present at each of these meetings made substantial contributions through their questions, comments, and suggestions, we are particularly grateful to the editors of ASR and to four anonymous reviewers for their constructive criticism. We are also indebted to Fabrizio Bernardi, Hans-Peter Blossfeld, Yu Xie, John Goldthorpe, Robert Erikson, Gordey Yastrebov, Gabriele Ballarino, Hannes Kröger, Jordi Teixido-Figueras, Olivia Nicol, and Jack Seddon for their critiques and individual support. While we had the good fortune of profiting from our colleagues’ collective knowledge and feedback, we are solely responsible for all potential errors or omissions contained herein, as well as for all conclusions arrived at.
Похожие статьи
S.A. Verbitskaya
Sonia Mukhtar