Эта статья опубликована под лицензией Creative Commons и не автором статьи. Поэтому если вы найдете какие-либо неточности, вы можете исправить их, обновив статью.

The role of atmospheric precipitation in introducing contaminants to the surface waters of the Fuglebekken catchment, Spitsbergen


Katarzyna Kozak
Krystyna Kozioł
Bartłomiej Luks
Stanisław Chmiel
Marek Ruman
Mariusz Marć
Jacek Namieśnik
Żaneta Polkowska
Опубликована Ноя. 23, 2015
Последнее обновление статьи Авг. 19, 2023
Эта статья опубликована под лицензией
")


Abstract
Although the Svalbard Archipelago is located at a high latitude, far from potential contaminant sources, it is not free from anthropogenic impact. Towards the Fuglebekken catchment, in the southern part of Spitsbergen, north of Hornsund fjord, contaminants can be transported from mainland pollution sources. In the precipitation and surface water collected in the catchment, the following elements were detected and quantified: Ag, Al, As, B, Ba, Bi, Ca, Cd, Co, Cr, Cu, Cs, Mo, Ni, Pb, Sb, Se, Sr, Tl, U, V and Zn. Additionally, pH, electrical conductivity and total organic carbon (TOC) were determined in those samples. The acidic reaction of precipitation waters was identified as an important factor intensifying the metal migration in this Arctic tundra environment. The air mass trajectory, surprisingly, explained the variability of only a small fraction of trace elements in precipitation water. The air mass origin area was correlated only with the concentrations of As, V and Cr. Wind directions were helpful in explaining the variability of Mn, U and Ba concentrations (east–north-easterly wind) and the contents of B, As, Rb, Se, Sr and Li in precipitation (south-westerly wind), which may indicate the local geological source of those. Atmospheric deposition was found to play a key role in the transport of contaminants into the Fuglebekken catchment; however, the surface water composition was modified by its pH and TOC content.
Ключевые слова
Arctic, Svalbard, trace elements, TOC, environmental chemistry, metals
The atmosphere is one of the main transporters of metals into the Arctic (AMAP 2005). As a result of atmospheric circulation, contaminants are transported by diffusion of gaseous and particulate contaminants in the troposphere, which is followed by either dry or wet deposition. Besides atmospheric deposition, also important for the migration of pollutants in the hydrological cycle are processes occurring in the catchment substratum. The dominant ones are sorption and those causing contaminant re-emission, such as remobilization, dissolution or oxidation (Bard 1999; Muir et al. 1999; Crane et al. 2001; Elberling et al. 2003).
Climatic factors, including high and low pressure systems, regulate the transport of air masses. Long-range pollutant transport brings chemical compounds produced in factories in Europe, Asia and North America (particularly, Russia and Canada), and deposits them in the Arctic (AMAP 2005). During the winter months, the Arctic air mass reaches industrial regions of Eurasia and North America due to the southward shift of the Polar Front; hence, the pollution transport from these regions into the Arctic is uninterrupted (Wolff 1990). The winter transport of atmospheric pollutants can occur rapidly, carrying contaminants from Europe to the Arctic within a few days (Polkowska et al. 2011). More than half of all human induced pollution in the Arctic comes from Eurasia (Pacyna 1995) on account of the asymmetry of the Arctic air dome around the North Pole; in Eurasia it may reach as far south as 40°N in January (Law & Stohl 2007).
The exposure of organisms to metal concentration, even at minimal levels, can strongly affect their functioning and health. Many metals have the tendency to bioaccumulate and biotransform and some (such as Hg, Cd and Pb) are highly toxic (Macdonald et al. 2000; Crane et al. 2001). As metal transfers through the food chain, concentrations in organisms at the top of the chain are magnified (Ayotte et al. 1995).
The Svalbard Archipelago requires special attention because of its distinctive environmental conditions and location in the Arctic, which makes the area a pollution reservoir (Kozak et al. 2013; Ruman et al. 2013). For the investigation of processes leading to pollution accumulation in a Svalbard catchment, we chose Fuglebekken stream, which is conveniently monitored from the Polish Polar Station in Hornsund.
In this paper, we track the levels of metal concentration in the Fuglebekken catchment, from atmospheric precipitation to surface waters: lakes, rivers and streams. Our focus is on heavy metals because of their toxic potential in the fragile Arctic ecosystem (White et al. 2012). We also perform a statistical analysis to discover links between the precipitation water composition and air mass history, using the wind direction at the sampling location and backward air mass trajectories. In doing so, we provide a unique record of short- and long-distance metal pollution transport to Hornsund, Svalbard.
Materials and methods
Study area
The Fuglebekken catchment is a non-glaciated catchment with a surface area less than 3 km2. It includes the steep slope of Ariekammen (511 m a.s.l.) and Fugleberget (569 m a.s.l.) and a large part of Fuglebergsletta plains. Fuglebekken stream flows for five months (145 days) each year between June and October. In winter, snow accumulates in the catchment and water circulation ceases. The total length of the watercourses in the catchment is 6.3 km, including multiple streams in its upper part. The main stream Fuglebekken drains a lake, and ends in the Isbjörnhamna bay of the Hornsund fjord. Because the outflow can be hidden beneath boulders during dry periods, the stream was sampled further upstream.
Sampling
Because of the difficulties connected with multiple element analyses in situ in polar regions, all chemical analyses were conducted in samples brought to the laboratory in Poland. The samples were transported from Svalbard to Poland by the research vessel Horyzont II, and the analyses were performed shortly afterwards.
Surface water and atmospheric wet and dry (bulk) deposition (including particulate and precipitation as rain and snow) were collected from the main stream and lake in the Fuglebekken basin (Fig. 1). The main stream water (Fuglebekken) and precipitation were sampled between 11 August 2010 and 3 September 2012. Lake water was collected between 9 August 2010 and 14 October 2010.

Atmospheric wet deposition samples were collected from a white polypropylene precipitation gauge, placed on a stand in a fixed location within the Fuglebekken catchment. The gauge surface area was 0.25 m2, and samples of capacity up to 1.5 dm3 were retrieved from it by gravitational flow into polyethylene containers. The samples were collected at two fixed times (06:00 and 18:00 GMT) on each day with a precipitation event occurring within 12 hours before a sampling time.
Both stream and lake samples were taken once a day. Lake samples were collected from just below the water surface. Surface water samples were collected manually and stored in airtight bottles, triple rinsed with the sample water prior to its collection. This was performed with the bottleneck directed towards the water current to prevent the inflow of suspended contaminants. To avoid the post-sampling chemical composition changes, all material collected was stored and transported to the laboratory in airtight HDPE bottles, in cold storage (approximately +4°C). The measured absorbances in the samples were close to zero, which indicated negligible suspended particle content, so filtering was deemed unnecessary. A thorough pre-cleaning procedure with the alkaline cleaning powder Neodisher LaboClean LA (Chemische Fabrik Dr. Weigert, Hamburg, Germany), a sequence of solvents and deionized water rinses deactivated the inside of the sampling containers, resulting in negligible losses of heavy metals by adsorption. The efficiency of the preparation procedures and the good preservation of samples in transport was confirmed by validation tests on solutions of 1 mg L−1 concentration of the metals tested in this study.
Chemicals
Technical specifications, reagents for determining selected parameters and analyte contents in samples, and basic validation parameters of the analytical procedures are summarized in Supplementary Table S1. Milli-Q deionized water was used during the determination of the various target analyte groups. The concentrations of organic and inorganic compounds (metals, total organic carbon [TOC] and the parameters of pH and electrical conductivity [EC]) in precipitation and surface water samples were determined using a variety of methods: inductively coupled plasma mass spectrometry for metals; a TOC-VCSH/CSN analyser (Shimadzu, Kyoto, Japan) for non-purgeable organic carbon; a CX-401 microcomputer pH-meter/O2-meter, with electrode type ESAgP-301W (Elmetron, Zabrze, Poland); and, for conductivity, an OK.-102/1 conductometer (Radeliks, Budapest, Hungary).
Quality assurance/quality control
All data were subject to strict quality control procedures. The analytical procedures applied to the determination of individual components in environmental samples with various matrix compositions were validated against certified reference materials (Supplementary Table S2).
The sensitivity of the applied methods was tested by injecting standard mixtures of the analytes in the measured range of concentrations. Linear calibration curves were obtained by plotting the peak area against the concentration of the respective standards; their correlation coefficients (R2) were in the range of 0.898–0.999 for all standards. The concentration levels of each substance in field samples (analysed in triplicates) were determined on the basis of the calibration curve. For every batch of six analysed samples, one procedural blank was added to check the instrumental background. Repeats and reference solutions were run after every five samples to assure the precision of each run. The limit of detection (LOD) was determined for the analytes in quality control samples, based on three replicates of a measurement. All blanks were analysed in the same set-up as for the samples, using the same reagents, in deionized water which has shown levels below detection limits for both TOC and the trace elements reported in this paper. This allowed for the elimination of any background level of trace elements or TOC in the used reagents and analytical vessels.
Human and environmental trace elements sources
The main source areas for human induced pollution in the Arctic are Urals, Kola Peninsula, the Norilsk region and the industrial districts of central Europe, particularly in the former Soviet Union.
Of local sources, the geological substratum of the Fuglebekken catchment and its surroundings are possible contributors of several trace elements. The Fuglebekken catchment is located within the oldest part of the geological Hecla Hoek formation, in the Isbjørnhamna group, which forms part of the Svalbard Archipelago proto-basement (Smulikowski 1965; Harland 1997). The Isbjørnhamna group comprises metamorphic rocks, which were formed from loamy–sandy sediments, with an admixture of marl and limestone. The metamorphosis occurred in amphibolite facies, hence the occurrence of garnets, staurolite, kyanite and plagioclase (andesine). The middle series of this rock group, Ariekammen, lies underneath the entire Fuglebekken catchment area. This series is built of biotite and carbonate gneiss, with garnets and schists, and interbeds of grey or yellowish marble (Smulikowski 1965). Little is known regarding the detailed composition of the minerals involved here. The only rock series located in the vicinity of the Fuglebekken catchment with well-known mineral composition, are pegmatites and hydrothermal veins from Skodefjellet. These were shown to contain the following elements: Li, Na, K, Be, Ca, Mg, Y, La, Ce, Th, Nd, U, Yb (and other rare earth elements), Ti, Zr, Nb, Ta, Mn, Fe and Al (Majka et al. 2012). Pyrochlores in these rocks possibly also contain Sn, Sr and Pb (Majka et al. 2012). The Mindat.org database also lists minerals containing Ba and Zn in this dyke (Mindat 2012).
Other geological sources of heavy metals, besides the local substratum, include rock dust coming from other parts of the archipelago and deposited in the area. However, this source is unlikely to be quantitatively important. Svalbard coal dust contains only small amounts of heavy metals, including Be, Cd, Co, Cr, Cu, Ga, Li, Mn, Mo, Ni, Pb, V and Zn (Headley 1996; Lewińska-Preis et al. 2009). Zn and V are the dominant trace elements in the Longyearbyen and Kaffioyra coals, respectively (Lewińska-Preis et al. 2009). Besides geological sources, surface water can be enriched in metals deposited in bird faeces in colonies of kittiwake (Rissa tridactyla) and glaucous gull (Larus hyperboreus), which were, for example, shown to supply the uppermost layer of peat in Kongsfjorden with such heavy metals as Al, Cu and Zn, as well as Fe, Mn and Ni (Headley 1996). In the Fuglebekken catchment, Cd, Pb, Ni, Cu, Zn, Mn and Fe were found in moss (Godzik 1991; Grodzińska & Godzik 1991) and their concentration increased 1.5–2-fold in the samples collected within a little auk (Alle alle) colony, compared to other samples from the area. On the other hand, Na, Mn, Cu, Ni and Zn are thought to accumulate in the moss Sanionia uncinata directly from sea spray (Samecka-Cymerman et al. 2011).
Influence of meteorological conditions on the transport of trace elements
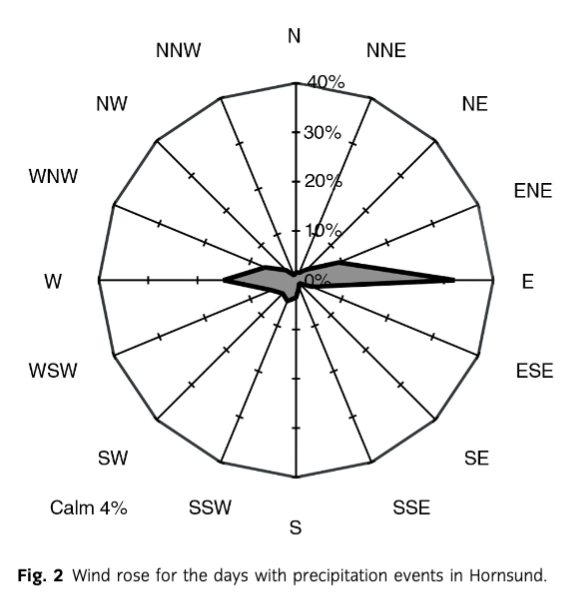
One of the main contaminant transport pathways into the Fuglebekken catchment (Fig. 1) are inflowing air masses, which bring pollutants from local and continental sources as aerosols or adsorbed to particulate matter (e.g., PM10). To track the potential influence of this factor, we analysed the dominant local wind directions in the sampling location (Fig. 2) and backward air mass trajectories. The reason for including both factors is that the mountains surrounding the catchment may block contaminant deposition from particular advection directions. Also, the local wind direction is more likely to influence the deposition of elements originating from the local geological substratum.
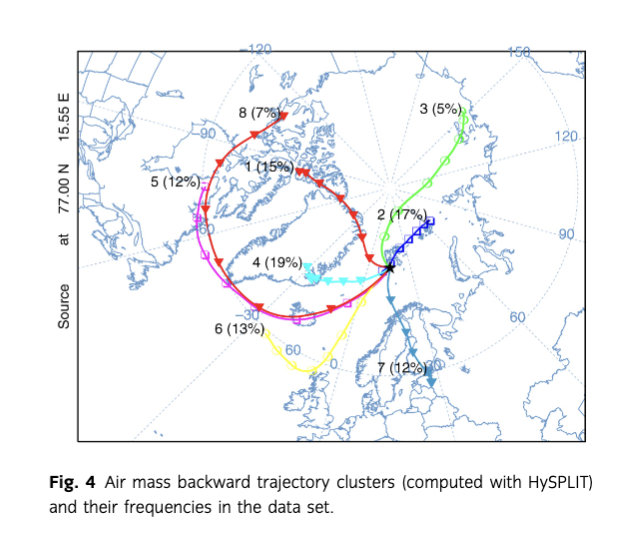
The air mass origin for the Polish Polar Station at Hornsund was modelled with HYSPLIT (Draxler & Hess 1997; Draxler & Rolph 2003; Draxler 2004; Draxler et al. 2009), using seven-day (i.e., 168-hour) backward air mass trajectories at 1000 m a.s.l., based on the Global Data Assimilation System meteorological data set. The trajectory elevation was chosen to avoid the influence of local topography, which, in a test run of the model, strongly disturbed the trajectories arriving at 500 m a.s.l. Rozwadowska et al. (2010) indicated that even trajectories at 1000 m a.s.l. were still influenced by the topography, being located within the boundary layer. However, these were less influenced than 500 m a.s.l. trajectories, and coincided with the typical cloud elevation, which is an important factor in the assessment of pollution sources for precipitation. The trajectories were produced for days with precipitation events, at three-hour intervals, and clustered into eight groups. Cluster analysis was performed using Ward’s method, as described by Stunder (1996).
To explore the interdependence of the local wind direction or a wider air circulation trajectory in the supply of contaminants to precipitation waters, we used statistical analysis (discriminant analysis [DA]). The air mass origin was analysed using HYSPLIT-based clusters, while the wind directions were obtained from local meteorological station in Hornsund. All clusters were used in the analysis, while several wind directions were excluded because of their very low frequencies, leaving only the classes containing a minimum of five cases each. All chemical variables, i.e., trace element concentrations, pH, EC and TOC, were included, except those with no or very low variability detected due to concentrations below LOD (Be, Cs, Sn, Tl and U, all of which had fewer than three cases exceeding LOD). Variables with missing entries were only excluded from the statistical analysis of the cases with lacking data (however, the results below LOD were included as zeros). DA was calculated for standardized data to avoid the influence of relatively higher variances in variables of generally higher levels. Following an initial run of DA with respect to both wind directions and air mass trajectory clusters, five variables with the highest significance levels were chosen to produce a more limited model.
Results
Meteorological background
The dominant local wind direction in all sampling sites was east, with a secondary maximum around the west direction (Fig. 2). This is a typical result for Hornsund and is attributed to the orientation of the fjord and is reinforced by local topography (Marsz & Styszyńska 2013). The secondary maximum of westerly winds is much less common in the station record (1979–2009) than north-easterly winds: only four years in the record show west to be the second most frequent wind direction (Marsz & Styszyńska 2013).

Despite the typical surface wind directions being easterly, most air masses bringing precipitation to the Polish Polar Station originated from the south-western quadrant (Fig. 3), which is consistent with long-term trends (Marsz & Styszyńska 2013). In the sampling period, four out of eight distinguished trajectory clusters belonged to this quadrant, accounting for a joint incoming air mass frequency of 51% (Fig. 4). These air masses may cross the British Isles (cluster 6), Iceland and North America (clusters 5 and 8), but also represent mainly circumpolar origin, avoiding densely populated areas (clusters 1 and 4). Clusters 2, 3 and 7, on the other hand, may represent European and North Asian pollution sources.
Chemical composition of precipitation, stream and lake waters
In the precipitation and surface waters, the following elements were identified and quantified: Al, As, B, Ba, Bi, Cd, Cr, Cu, Li, Mn, Mo, Ni, Pb, Rb, Sb, Se, Sr, U, V and Zn. Co, Ag and Cs were quantified only in precipitation water, and Tl only in surface water samples (Supplementary Fig. S1). The concentrations of the determined elements in the atmospheric precipitation (Ag, B, Cd, Co, Cs, Cu, Mn, Ni, Pb, Sb, Zn) were higher than in the surface water. The highest metal concentrations in surface waters were determined for Al, As Ba, Li, Mo, Sb, Ti, U and V. Supplementary Table S3 presents the results of the analyses performed, grouped by the sampled medium.
The interdependence of air movement and trace elements detected in precipitation water
The DA has shown that the most differing wind directions, from the perspective of their chemical composition, were the pairs ENE–SW, ENE–NW, WSW–SW, WSW–NW, WNW–SW, E–SW, E–NW, SW–W and SW–NW, all of them exhibiting p<0.05 for their Mahalanobis distances (Supplementary Table S4). On the other hand, the chemically similar precipitation profiles were associated with the following groups of wind directions: ENE–SSW, WNW–W, WSW–SSW and E–SSW. For air mass trajectory clusters, significant differences (p<0.05) were found within cluster pairs (Supplementary Table S5) 1–6, 1–8, 2–6 and 4–6, while the least difference was found between cluster 3 and clusters 2, 4, 5, 6 and 7.
The DA in both cases (wind direction and air mass trajectory classification) resulted in the selection of five chemical variables that were the most effective in class discrimination. For wind directions, these were Zn, As, Rb, Cd and Pb, and they resulted in a DA model of p<0.002 significance level (Supplementary Table S6). Similarly, a DA model truncated to five variables (Li, B, Rb, Sb, EC) was built to discriminate trajectory clusters (Supplementary Table S7), with a p<0.048. The levels of the variables included in the truncated models are shown in Supplementary Figs. S2 and S3.
Discussion
The Norwegian Arctic is known to be mostly influenced by emissions from the Kola Peninsula, where the predominant pollution sources are Russian industrial centres in major towns and cities such as Monchegorsk, Murmansk, Nikel, Zapolyarnyi, Kovdor, Apatity, Olenogorsk, Kirovsk and Kandalaksha, as well as the Norwegian town of Kirkenes and, in Finland, Kittilä (Reimann et al. 1996; Chekushin et al. 1998; Reimann & de Caritat 2005). Other pollution emitters are the towns of Salechard, Severodvinsk, Inta and Vorkuta (AMAP 2006), as well as Arkhangelsk, Magadan, Norilsk, Anchorage, Fairbanks and Reykjavík (Bryś 2002; de Caritat et al. 2005).
In Svalbard, Beine et al. (1996) studied the directions of pollutant import on Zeppelin mountain in Ny-Ålesund in 1994. They concluded that the main air mass source region was Russia (38.7% of the time). Air inflow from elsewhere in the Arctic was also frequent (23.7% of the time). In contrast, local sources were only observed for 6.4% of the time, and this was usually in the summer when the relative frequency of local air advection was highest. Local sources of pollutants in Svalbard include coal mines in Barentsburg, Longyearbyen, Pyramiden and Sveagruva (Simões & Zagorodnov 2001), as well as the geological substratum in general. The current importance of these pollution sources needs reassessment.
Trace elements in precipitation and surface waters
The fate of metals in the Arctic environment is dependent on their transport pathways. In the Fuglebekken catchment, precipitation is a likely supplier of Pb, Zn and Cu for the surface water samples. The considerably high concentration levels of these elements in atmospheric precipitation, especially zinc (mean concentrations: Pb 0.33 µg L−1, Zn 28.99 µg L−1, Cu 0.66 µg L−1), as well as the significance of Zn and Pb in distinguishing the wind directions from the directions related to marine inputs and elsewhere, may indicate their local source from the sea spray (particularly as all three elements were found to be enriched in moss near the local bird colony (Godzik 1991; Grodzińska & Godzik 1991; Samecka-Cymerman et al. 2011). According to Pacyna (1995), the metal industry is the main source of Cd, Cu, Pb, Ni, As, Se and Zn in the Arctic, and the higher level of Zn, Pb and As in the precipitation connected to south-westerly winds may initially seem to confirm this pattern (Supplementary Fig. S2). However, the south-westerly wind direction aligns with the air mass transport from the British Isles, while the most important sources of heavy metals used to be smelting plants in European Russia and north Siberia (Reimann et al. 1996; Chekushin et al. 1998; Reimann & de Caritat 2005). Furthermore, the air arriving from the south-west to Hornsund (and the trajectory of cluster 6, also very well distinguished from other clusters) probably experiences the longest contact with open ocean waters compared to the air coming from other directions. Since both the sustained long-distance transport of pollutants and ship traffic (Zhan et al. 2014) in the past have likely contributed to the formation of secondary sources in the surface layer of the sea (Samecka-Cymerman et al. 2011), the main direct source of those elements in precipitation water in Hornsund is most probably currently the sea spray. This hypothesis is consistent with the weaker discrimination of the air mass trajectory of cluster 7, connected to the primary sources of pollutants, in favour of cluster 6. The sea spray source may be responsible for the pollution of Ni, Cu, Zn and Mn (Samecka-Cymerman et al. 2011), while ship traffic has been recently shown to supply extra TOC, Ni, V, Mn, Al, Fe, Co, As, Se, Ba and Pb to air samples from Ny-Ålesund, Svalbard (Zhan et al. 2014).
Finally, the contribution of the geological substratum of the area surrounding the Fuglebekken catchment to trace element content of precipitation water needs exploring, as information on the local rock composition is currently limited. However, Li, Sr, Pb and Zn were found on the neighbouring Skoddefjellet mountain (Majka et al. 2012), located towards the north-west from the sampling point, which could contribute to the role of Pb and Zn concentrations in distinguishing the north-west wind direction on the day of precipitation event. Furthermore, local contributions from different rock types could be responsible for the significant differences between precipitation events accompanied by wind coming over land areas, as opposed to the relatively similar composition of those from the south-western quadrant and the east, both strongly influenced by the sea.
The comparison of pollution levels in Svalbard and the Arctic to other areas of the globe, especially the areas of Europe from which it originates, is possible thanks to the Arctic Monitoring and Assessment Programme (AMAP) and the Co-operative Programme for Monitoring and Evaluation of the Long-range Transmission of Air Pollutants in Europe (EMEP). In precipitation and air samples from Europe the ranges of pollution concentrations for Pb, Cd, Zn, Ni, As, Cu, Co, Cr, Mn, V, Fe and Al were 0.007–59.3 µg L−1 and 0.01–41.8 ng m−3, respectively (Fagerli et al. 2012). In the AMAP (2005) report, surface waters from the Arctic have been shown to contain 0.0001–20 µg L−1 of heavy metals (Cu, Zn, Pb and Cd). These values contrast strongly with the more polluted areas of Asia, e.g., in south Asia precipitation samples contained 0.0001–980 µg L−1 of Al, Sc. V, Cr, Mn, Fe, Co, Ni, Cu, Zn, As, Cd, Sn, Cs, Pb and Bi (Guo et al. 2015; Kamani et al. 2014). An even higher metal pollution level was found in the surface waters of north Asia, where 0.1–2336 µg L−1 of Sr, Al, Fe, Mn, Cr, Cu, Ni, Zn, Cd, Co, Pb and As was described (Moiseenko et al. 2013). On the other hand, in South America moderate metal levels were found in atmospheric precipitation, as the reported levels of Co, Cr, Cu, Fe, Mn, Ni, Zn, Pb and Sr there ranged 0.1–22.5 µg L−1 (Migliavacca et al. 2012). Against this background, the detected concentrations in Svalbard precipitation and surface waters are relatively small but not negligible, with the exception of Zn, which was noted to occur in high concentrations in precipitation waters and which requires further attention in the future.
The relationship between metal concentrations and the pH of surface and precipitation water
Except precipitation water, a possible source for the trace elements in surface water is leaching from geological substratum, as well as the melting of ground ice. The latter may act as secondary source of the formerly deposited contaminants. Migrating animals, especially reindeer, foxes, polar bears and little auks forming a local bird colony, may also deposit metals through leaving faeces in the catchment. To understand better the influence of post-depositional processes on the surface water impurities content, especially leaching from the local substrate, the influence of pH on trace metal concentrations is further investigated below. This will also inform about the surface quality, in correspondence to the classification by Naseem et al. (2013).
In the surface water samples, the highest sums of metal concentrations occurred, when pH was in the neutral zone (Supplementary Fig. S4). On the contrary, the precipitation samples were usually acidic and contained high or very high metal concentrations; hence, they can be sources of metals in the Arctic tundra. However, there was a negative correlation between pH and the total base metal concentration (Zn, Cu, Pb, Cd, Ni and Co) in stream samples, while the correspondent relationship for precipitation samples was positive (Spearman rank rho = 0.348, p<0.001 for precipitation and rho = −0.291, p<0.001 for stream water). The acidic character of the precipitation increases metal mobility and leads to higher metal concentrations in the environment, but the acidic precipitation is buffered upon delivery to surface waters, since the range of pH measured in the surface waters is mostly due to the presence of carbonate rocks.
Relationships between trace element concentration and TOC
Metal bioavailability increases as metals become dissolved and chemically bound, their chemical state determining their uptake by living organisms and their influence on them. Metals can be removed from water through deposition in sediment, often forming metal oxides or stable complexes with organic ligands (Bilali et al. 2002). In the lake samples analysed in this study, significant correlations between the concentrations of organic matter and Al (R = −0.381, p<0.01) or As (R = 0.439, p<0.001) were found (there were also insignificant positive relationships between TOC and other trace element concentrations; Supplementary Fig. S5a). For the samples collected in the stream, a significant correlation was detected between the concentration of organic matter and Al (R = − 0.161, p<0.05; Supplementary Fig. S5b). This suggests that organic compounds may play an important role in the enrichment of As (and perhaps other trace elements) in the surface waters, given the positive correlation in the lake. On the other hand, the concentration of Al in the surface waters is mainly dependent on the supply from aluminosilicate minerals, or the cation exchange capacity of the clay minerals and humus substances in soil (contributing mainly Al3 + and AlOH2 + ions). In the precipitation samples, no trace element correlations with TOC were observed, which may be a result of the paucity of organic compounds in those samples, in contrast to their higher concentrations in the surface water samples. These considerations show that the water reservoirs are rich in organic matter, including fulvic and humic acids, which may influence the distribution of some trace elements. However, to assign this effect to dissolved organic matter only, the influence of plant-related remediation—as yet unknown—needs to be excluded.
A significant correlation was also observed between the concentrations of As and Mn (R = 0.306, p<0.001) or Pb (R = 0.254, p<0.001) in the stream (Supplementary Fig. S6), whilst that relationship was not detected in precipitation samples. This suggests that Mn and Pb may undergo similar dynamics as As, associated with the organic matter or suspended sediment containing TOC. However, the correlation between Mn and As may also indicate their common geological source. The surrounding rocks contain pyrite with an admixture of arsenopyrite FeAsS. As may also be adsorbed on FeOOH (goethite) and MnOOH (manganite). During the process of iron (III) hydroxide grain coatings reduction, bacteria release the adsorbed As (Reza et al. 2011).
Conclusions
Our results show trace element concentrations in both precipitation and surface waters in the Hornsund area for the first time, enriching the limited published data set of trace element concentrations in the southern part of Svalbard (Supplementary Table S8). Here, we complement the findings of prior studies of the metal concentrations in a variety of environmental components in Svalbard, hoping to contribute to the informed protection of the local environment in the Fuglebekken catchment.
Main trace pollutants in the Fuglebekken catchment precipitation were found to be Zn, Cu and Pb, which all were likely to originate from long-range transport, but nowadays may be supplied from the secondary sources in the marine environment. In the studied case, the back-trajectory clusters explained trace element variability in atmospheric precipitation only to a limited extent, while the wind directions were more clearly discriminated based on the chemical composition of precipitation water. Many trace elements in the precipitation in Hornsund are therefore likely of mixed origin, the potential sources including sea spray and bird colonies (secondary metal sources), local geological substratum and human activity, e.g., ship traffic. Upon delivery to surface waters, these trace elements undergo further post-depositional processes; e.g., the pH of surface waters influences the base metals concentration, and TOC content impacts the concentration of Al and As. In the lake and streams, both dilution of the originally deposited metals and enrichment by leaching from the substratum and melting permafrost change the surface water composition.
Because of the limited direct influence of local pollution sources (including the geological substratum), Arctic catchments may be considered sensors of global environmental pollution. Containing both permanent and ephemeral water bodies, the Fuglebekken catchment is an interesting testing ground for research on the migration of metals in the Arctic tundra environment. Combining multiple trace element sources, atmospheric deposition was observed to play a role in the transport of pollution into this area. However, pH buffering and interaction with organic matter quickly change the concentrations (compared to precipitation) of multiple elements in surface waters. In particular, the concentration peaks found in precipitation were smoothed in surface waters. This regulating mechanism—which may lead to the formation of secondary pollution sources—should be further investigated. Such secondary pollution sources will play an increasing role in the future environmental fate of trace elements in the Arctic, which is already observable as the disjunction between anthropogenic pollutant source areas and the areas to which air masses deliver pollution.
Acknowledgements
This research was funded by the National Science Centre in Poland with a research grant no. 2013/09/N/ST10/04191. The authors are grateful to the Institute of Geophysics, Polish Academy of Sciences, for the opportunity for KK to conduct the 2012 field sampling as an intern at the Polish Polar Station, Hornsund. The staff of the station are thanked for field assistance, as are the participants of Special Project 1173/IPY/2007, under the auspices of Poland’s Ministry of Higher Education during the Fourth International Polar Year, who collected some of the samples. This publication has been financed by funds from the Leading National Research Centre, received by the Centre for Polar Studies for the period 2014–18.
References
- AMAP (Arctic Monitoring and Assessment Programme) 2005. AMAP assessment 2002: heavy metals in the Arctic. Oslo: Arctic Monitoring and Assessment Programme.
- AMAP (Arctic Monitoring and Assessment Programme) 2006. AMAP assessment 2006: acidifying pollutants, Arctic haze, and acidification in the Arctic. Oslo: Arctic Monitoring and Assessment Programme.
- Ayotte P., Dewailly E., Bruneau S., Careau H. & Vézina A. 1995. Arctic air pollution and human health: what effects should be expected? Science of the Total Environment 160, 529–537. Publisher Full Text
- Bard S.M. 1999. Global transport of anthropogenic contaminants and the consequences for the Arctic marine ecosystem. Marine Pollution Bulletin 38, 356–379. Publisher Full Text
- Beine H.J., Engardt M., Jaffe D.A., Hov Ø., Holmén K. & Stordal F. 1996. Measurements of NOx and aerosol particles at the Ny-Ålesund Zeppelin mountain station on Svalbard: influence of regional and local pollution sources. Atmospheric Environment 30, 1067–1079. Publisher Full Text
- Bilali L.E., Rasmussen P.E., Hall G.E.M. & Fortin D. 2002. Role of sediment composition in trace metal distribution in lake sediments. Applied Geochemistry 17, 1171–1181. Publisher Full Text
- Bryś T. 2002. Meteorologiczne i orograficzne uwarunkowania depozycji jonowej z opadów i osadów atmosferycznych w rejonie Hornsundu w okresie lipiec 1999—czerwiec 2000. (Meteorological and orographic conditions of the ion deposition of atmospheric precipitation and deposits in the area of Hornsund in the period July 1999–June 2000). Problems of Polar Climatology 12, 89–106.
- Chekushin V.A., Bogatyrev I.V., de Caritat P., Niskavaara H. & Reimann C. 1998. Annual atmospheric deposition of 16 elements in eight catchments of the central Barents region. Science of the Total Environment 220, 95–114. Publisher Full Text
- Crane K., Galasso J., Brown C., Cherkachov G., Ivanow G., Petrova V. & Vanstayan B. 2001. Northern ocean inventories of organochroline and heavy metals contamination. Marine Pollution Bulletin 43, 28–60. Publisher Full Text
- de Caritat P., Hall G., Gìslason S., Belsey W., Braun M., Goloubeva N.I., Olsen H.K., Scheie J.O. & Vaive J.E. 2005. Chemical composition of Arctic snow: concentration levels and regional distribution of major elements. Science of the Total Environment 336, 183–199. Publisher Full Text
- Draxler R., Stunder B., Rolph G., Stein A. & Taylor A. 2009. HYSPLIT4 user’s guide. Version 4.9. Silver Spring, MD: Air Resources Laboratory, National Oceanic and Atmospheric Administration.
- Draxler R.R. 2004. HYSPLIT PC training seminar. Hybrid Single-particle Lagrangian Integrated Trajectory Model. Silver Spring, MD: Air Resources Laboratory, National Oceanic and Atmospheric Administration.
- Draxler R.R. & Hess G.D. 1997. Description of the HYSPLIT 4 modeling system. NOAA Technical Memorandum ERL ARL–224. Silver Spring, MD: Air Resources Laboratory, National Oceanic and Atmospheric Administration.
- Draxler R.R. & Rolph G.D. 2003. HYSPLIT (Hybrid Single-particle Lagrangian Integrated Trajectory). Air Resources Laboratory, National Oceanic and Atmospheric Administration. Model accessed on the internet at http://www.arl.noaa.gov/HYSPLIT.php on 15 June 2014.
- Elberling B., Knudsen K.L., Kristensen P.H. & Asmund G. 2003. Applying foraminiferal stratigraphy as a biomarker for heavy metal contamination and mining impact in a fiord in West Greenland. Marine Environmental Research 55, 235–256. Publisher Full Text
- Fagerli H., Gauss M., Steensen B.M. & Benedictow A.C. 2012. EMEP/MSC-W model performance for acidifying and eutrophying components and photo-oxidants in 2010. Supplementary material to EMEP Status Report 1. Oslo: Norwegian Meteorological Institute.
- Godzik B. 1991. Heavy metals and macroelements in the tundra of southern Spitsbergen: the effect of little auk Alle alle (L.) colonies. Polar Research 9, 121–131. Publisher Full Text
- Grodzińska K. & Godzik B. 1991. Heavy metals and sulphur in mosses from southern Spitsbergen. Polar Research 9, 133–140. Publisher Full Text
- Guo J., Kang S., Huang J., Zhang Q., Tripathee L. & Sillanpää M. 2015. Seasonal variations of trace elements in precipitation at the largest city in Tibet, Lhasa. Atmospheric Research 153, 87–97. Publisher Full Text
- Harland W.B. 1997. Proto-basement in Svalbard. Polar Research 16, 123–147. Publisher Full Text
- Headley A.D. 1996. Heavy metal concentrations in peat profiles from the High Arctic. Science of the Total Environment 177, 105–111. Publisher Full Text
- Kamani H., Hoseini M., Safari G.H., Jaafari J. & Mahvi A.H. 2014. Study of trace elements in wet atmospheric precipitation in Tehran, Iran. Environmental and Monitoring Assessment 186, 5059–5067. Publisher Full Text
- Kozak K., Polkowska Ż., Ruman M., Kozioł K. & Namieśnik J. 2013. Analytical studies on the environmental state of the Svalbard Archipelago—critical source of information about anthropogenic global impact. Trends in Analytical Chemistry 50, 107–126. Publisher Full Text
- Law K.S. & Stohl A. 2007. Arctic air pollution: origins and impacts. Science 315, 1537–1540. Publisher Full Text
- Lewińska-Preis L., Fabiańska M.J., Ćmiel S. & Kita A. 2009. Geochemical distribution of trace elements in Kaffioyra and Longyearbyen coals, Spitsbergen, Norway. International Journal of Coal Geology 80, 211–223. Publisher Full Text
- Macdonald R.W., Barrie L.A., Bidleman T.F., Diamond M.L., Gregor D.J., Semkin R.G., Strachan W.M.J., Lib Y.F., Wania F., Alaee M., Alexeeva L.B., Backus S.M., Bailey R., Bewers J.M., Gobeil C., Halsall C.J., Harner T., Hoff J.T., Jantunen L.M.M., Lockhart W.L., Mackay D., Muir D.C.G., Pudykiewicz J., Reimer K.J., Smith J.N., Stern G.A., Schroeder W.H., Wagemann R. & Yunker M.B. 2000. Contaminants in the Canadian Arctic: 5 years of progress in understanding sources, occurrence and pathways. Science of the Total Environment 254, 93–234. Publisher Full Text
- Majka J., Larionov A.N., Gee D.G., Czerny J. & Pršek J. 2012. Neoproterozoic pegmatite from Skoddefjellet, Wedel Jarlsberg Land, Spitsbergen: additional evidence for c. 640 Ma tectonothermal event in the Caledonides of Svalbard. Polish Polar Research 33, 1–17. Publisher Full Text
- Marsz A.A. & Styszyńska A. 2013. Climate and climate change at Hornsund, Svalbard. Gdynia, Poland: Gdynia Maritime University.
- Migliavacca D.M., Teixeira E.C., Gervasoni F., Conceição R.V. & Rodriguez M.T.R. 2012. Metallic elements and isotope of Pb in wet precipitation in urban area, South America. Atmospheric Research 107, 106–114. Publisher Full Text
- Mindat 2012. Mineral and locality database. Accessed on the internet at http://www.mindat.org/loc-222426.html on 1 August 2012.
- Moiseenko T.I., Gashkina N.A., Dinu M.I., Kremleva T.A. & Khoroshavin V.Y. 2013. Aquatic geochemistry of small lakes: effects of environment changes. Geochemistry International 51, 1031–1148. Publisher Full Text
- Muir D., Braune U.B., DeMarch B., Norstrom R., Wagemann R., Lockhart L., Hargrave B., Bright D., Addison R., Payne J. & Reimer K. 1999. Spatial and temporal trends and effects of contaminants in the Canadian Arctic marine ecosystem: a review. Science of the Total Environment 230, 83–144. Publisher Full Text
- Naseem S., Hamza S., Nawaz-ul-Huda S., Bashir E. & ul-Haq Q. 2013. Geochemistry of Cd in groundwater of Winder, Balochistan and suspected health problems. Environmental Earth Sciences 71, 1683–1690. Publisher Full Text
- Pacyna J.M. 1995. The origin of Arctic air pollutants: lessons learned and future research. Science of the Total Environment 160, 39–53. Publisher Full Text
- Polkowska Ż., Cichała-Kamrowska K., Ruman M., Kozioł K., Krawczyk W.E. & Namieśnik J. 2011. Organic pollution in surface waters from the Fuglebekken basin in Svalbard, Norwegian Arctic. Sensors 11, 8910–8929. Publisher Full Text
- Reimann C. & de Caritat P. 2005. Distinguishing between natural and anthropogenic sources for elements in the environment: regional geochemical surveys versus enrichment factors. Science of the Total Environment 337, 91–107. Publisher Full Text
- Reimann C., Niskavaara H., de Caritat P., Finne T.E., Äyräs M. & Chekushin V.A. 1996. Regional variation of snowpack chemistry in the vicinity of Nickel and Zapoljarnij, Russia, northern Finland and Norway. Science of the Total Environment 182, 147–158. Publisher Full Text
- Reza A.H.M.S., Jean J.-S., Lee M.-K., Luo S.-D., Bundschuh J., Li H.-C., Yang H.-J. & Liu C.-C. 2011. Interrelationship of TOC, As, Fe, Mn, Al and Si in shallow alluvial aquifers in Chapai-Nawabganj, northwestern Bangladesh: implication for potential source of organic carbon. Environmental Earth Sciences 63, 955–967. Publisher Full Text
- Rozwadowska A., Zieliński T., Petelski T. & Sobolewski P. 2010. Cluster analysis of the impact of air back-trajectories on aerosol optical properties at Hornsund, Spitsbergen. Atmospheric Chemistry and Physics 10, 877–893. Publisher Full Text
- Ruman M., Kozak K., Lehmann S., Kozioł K. & Polkowska Ż. 2013. Pollutants present in different components of the Svalbard Archipelago environment. Ecological Chemistry and Engineering S 19, 571–584.
- Samecka-Cymerman A., Wojtuń B., Kolon K. & Kempers A.J. 2011. Sanionia uncinata (Hedw.) Loeske as bioindicator of metal pollution in polar regions. Polar Biology 34, 381–388. Publisher Full Text
- Simões J.C. & Zagorodnov V.S. 2001. The record of anthropogenic pollution in snow and ice in Svalbard, Norway. Atmospheric Environment 35, 403–413. Publisher Full Text
- Smulikowski W. 1965. Petrology and some structural data of lower metamorphic formations of the Hecla Hoek Succession in Hornsund, Vestspitsbergen. Studia Geologica Polonica 18. Warsaw: Institute of Geological Sciences, Polish Academy of Sciences.
- Stunder B.J.B. 1996. An assessment of the quality of forecast trajectories. Journal of Applied Meteorology 35, 1319–1331. Publisher Full Text
- White D.A., Hafsteinsdóttir E.G., Gore D.B., Thorogood G. & Stark S.C. 2012. Formation and stability of Pb-, Zn- & Cu-PO4 phases at low temperatures: implications for heavy metal fixation in polar environments. Environmental Pollution 161, 143–153. Publisher Full Text
- Wolff E.W. 1990. Signals of atmospheric pollution in polar snow and ice. Antarctic Science 2, 189–205.
- Zhan J., Gao Y., Li W., Chen L., Lin H. & Lin Q. 2014. Effects of ship emissions on summertime aerosols at Ny-Alesund in the Arctic. Atmospheric Pollution Research 5, 500–510. Publisher Full Text
Похожие статьи
Øyvind Nordli
Rajmund Przybylak
Astrid E.J. Ogilvie
Ketil Isaksen
и другие.
Karen Lone
Jon Aars
Christian Lydersen
Kit M. Kovacs
и другие.
Herdis M. Gjelten
Øyvind Nordli
Ketil Isaksen
Eirik J. Førland
и другие.
Øystein Varpe
Geir W. Gabrielsen
Michał Hubert Węgrzyn
Beata Cykowska-Marzencka
Monica Alterskjær Sundset
Paulina Wietrzyk-Pełka
и другие.