Эта статья опубликована под лицензией Creative Commons и не автором статьи. Поэтому если вы найдете какие-либо неточности, вы можете исправить их, обновив статью.

Atmospheric trace elements in aerosols observed over the Southern Ocean and coastal East Antarctica


Guojie Xu
Yuan Gao
Опубликована Ноя. 17, 2014
Последнее обновление статьи Авг. 22, 2023
Эта статья опубликована под лицензией
")


Abstract
Atmospheric aerosol samples were collected over the Southern Ocean (SO) and coastal East Antarctica (CEA) during the austral summer of 2010/11. Samples were analysed for trace elements, including Na, Mg, K, Al, Fe, Mn, Ni, Cd and Se, by inductively coupled plasma mass spectrometry (ICP-MS). The mean atmospheric concentrations over the SO were 1100 ng m−3 for Na, 190 ng m−3 for Mg, 150 ng m−3 for Al, 14 ng m−3 for Fe, 0.46 ng m−3 for Mn and 0.25 ng m−3 for Se. Over CEA, the mean concentrations were 990 ng m−3 for Na, 180 ng m−3 for Mg, 190 ng m−3 for Al, 26 ng m−3 for Fe, 0.70 ng m−3 for Mn and 0.29 ng m−3 for Se. Particle size distributions, enrichment factors (EFs) and correlation analysis indicate that Na, Mg and K mainly came from the marine source, while Al, Fe and Mn were mainly from the crustal source, which also contributed to Mg and K over CEA. High EFs were associated with Ni, Cd and Se, suggesting likely contributions from mixed sources from the Antarctic continent, long-range transport, marine biogenic emissions and anthropogenic emissions. Sea-salt elements (Na, Mg, K) were mainly accumulated in the coarse mode, and crustal elements (Al, Fe, Mn) presented a bimodal size distribution pattern. Bioactive elements (Fe, Ni, Cd) were enriched in the fine mode, especially with samples collected over the SO, possibly affecting biogeochemical cycles in this oceanic region.
Ключевые слова
Trace elements, coastal East Antarctica, sources, Southern Ocean, size distribution
The Southern Ocean (SO) plays a critical role in regulating the global carbon cycle (Reid et al. 2009), and atmospheric aerosols over this region may contribute to regional biogeochemical cycles and atmospheric chemistry (Jickells et al. 2005; Heimburger et al. 2012; Gao et al. 2013). Atmospheric sea salt and biogenic sulphur are among the major aerosol components over the SO (Berg et al. 1998; Murphy et al. 1998). Sea-salt aerosol particles contain elements such as Na, Mg, K and Ca (Murphy et al. 1998; O’Dowd & De Leeuw 2007) and sea-salt fractionation due to fresh sea-ice formation can alter atmospheric chemistry over polar regions (Hara et al. 2012). The seawater bubble bursting processes can also be a source for atmospheric Se, in addition to volcanic and biogenic sources (Schneider 1985; Weller et al. 2008). The trace elements of continental sources (Fe, Mn, Ni) provided by atmospheric long-range transport are required for organisms during photosynthesis, respiration and nitrogen fixation processes (Price & Morel 1990; Moore et al. 2013; Twining & Baines 2013). Although some of these bioactive elements (Cd, Ni) may act as toxicants at high concentrations to certain marine organisms (Whitfield 2001; Echeveste et al. 2014), Fe is a limiting and essential micronutrient for all organisms (Jickells et al. 2005). Recent field measurements have shown that upwelling, dust deposition, entrainment from shelf sediment and advection of subtropical waters are among the sources of bioavailable iron to SO waters (Boyd et al. 2004; Blain et al. 2007; Sedwick et al. 2008). Enhancements in nitrogen fixation and biological blooms correspond to the episodic supply of iron (Frew et al. 2001; Boyd et al. 2004). In the SO, the atmospheric Fe input contributes to the pool of dissolved Fe (Blain et al. 2007; Gao et al. 2013; Heimburger et al. 2013). Observations of atmospheric trace elements over the SO have been reported for the Atlantic sector (Rädlein & Heumann 1995; Witt et al. 2006; Boye et al. 2012). Direct measurements of atmospheric deposition of trace elements has been reported by Heimburger et al. (2012) over the Kerguelen Islands (49°18′S, 70°07′E) in the Indian Ocean sector of the SO, and Witt et al. (2006) measured the atmospheric concentrations of trace elements during an Indian Ocean transect at 32°S from Durban, South Africa, to Perth, Australia. However, few observations of atmospheric trace elements have been made south of 50°S in the Indian Ocean sector of the SO.
Antarctica is the most pristine region on the planet, isolated by the SO and circumpolar cyclonic vortex from neighbouring continents. This provides ideal opportunities for studying the background of aerosols far from continental sources (Zoller et al. 1974; Dick 1991; Artaxo et al. 1992; Mouri et al. 1997; Arimoto et al. 2008). Previous observations of trace elements in aerosols were made at the South Pole (Duce et al. 1975; Maenhaut et al. 1979; Arimoto et al. 2008) and over coastal West Antarctica (Mishra et al. 2004; Saxena & Ruggiero 2013). Even though seasonal patterns of heavy metal concentrations deposited in snow have been conducted in Lambert Glacier basin, East Antarctica (Hur et al. 2007), atmospheric trace elements over coastal East Antarctica (CEA) and the Indian Ocean sector of the SO during the austral summer have hitherto not been investigated simultaneously.
To quantify the concentrations and size distributions of trace elements in aerosols, atmospheric particulate samples were collected during an Antarctic cruise in the SO and CEA. In this paper, we present the distributions of selected atmospheric trace elements and explore possible sources for them. Results from this study can provide valuable information about aerosol properties over both the SO and CEA, contributing to a better understanding of biogeochemical cycles in these regions.
Sampling and methods
Shipboard aerosol sampling
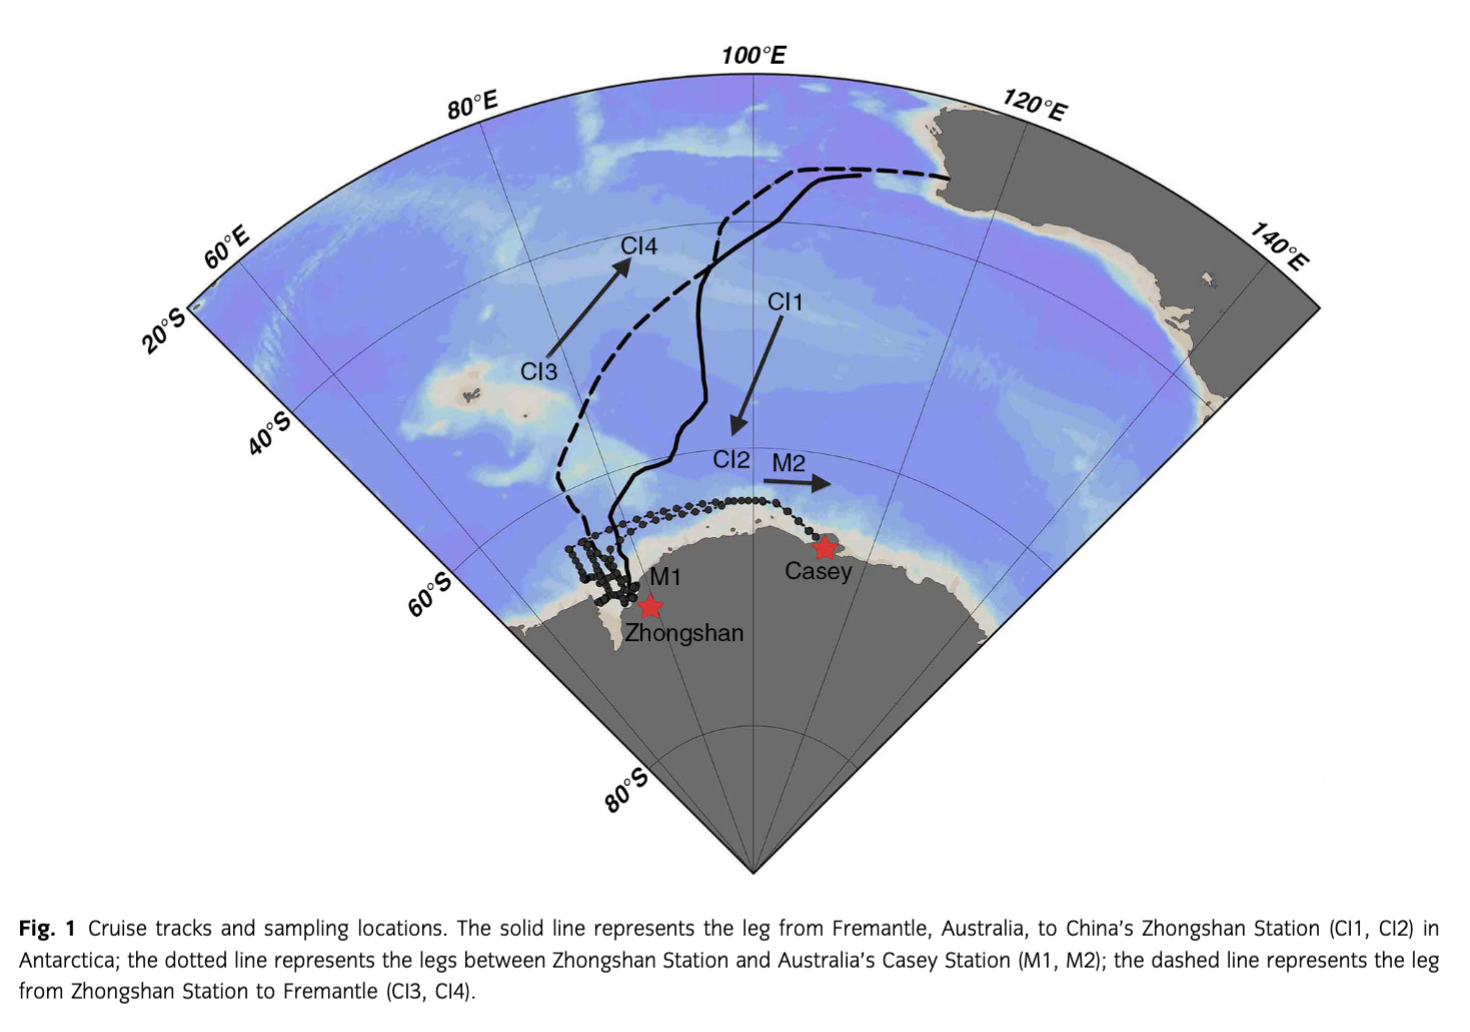
Aerosol sampling was conducted between the SO and China’s Zhongshan Station (69°22′S, 76°22′E), and between Zhongshan Station and Australia’s Casey Station (66°17′S, 110°32′E) during the austral summer from November 2010 to March 2011, onboard the Chinese icebreaker Xue Long (Fig. 1). In this study, the SO was defined as the region between 40°S and 65°S, and coastal Antarctica was defined as the region between 65°S and 69°S. The divisions of SO and CEA were made based on three considerations. Firstly, the sea-ice extent, which may impact the marine primary productivity (Nicol et al. 2000; Smith & Comiso 2008), is different between these two regions. In austral summer, the region south of 40°S is ice-free, while CEA is covered with pack ice. Sea-ice extent and biological productivity could determine the source strength of marine biogenic aerosols, resulting in changes in aerosol chemical composition and size characteristics (Andreae 1986; Mosher et al. 1987; Trevena & Jones 2012). Secondly, the air mass origins and wind patterns in the SO and CEA were different. The origins of air masses affecting samples collected over the SO were mainly in the SO (Fig. 2), while samples collected in CEA were mainly impacted by air masses from the Antarctic continent (Fig. 3). This is also confirmed by wind patterns: the SO is under westerly winds, but CEA is affected by katabatic winds from the Antarctic continent (Hogan 1975; Jourdain & Legrand 2001). Thirdly, the polar front is a distinct boundary between warm and cold air masses, where cyclonic storm systems develop (Bjerknes & Solberg 1922). Turner & Thomas (1994) found that high frequencies of vortex activities occurred within coastal Antarctic regions, which is different from the situation in SO.

Air samplers were assembled on a 3×6 m2 platform on the ship’s eighth floor front deck, about 25 m above the sea surface. To collect size-segregated atmospheric particle samples over the SO, a high-volume cascade impactor (CI) with a flow rate of ca. 1 m3 min−1 (Tisch Environmental, Cleves, OH, USA) was used, and acid-washed Whatman grade 41 cellulose filter papers (Whatman, Kent, UK) were used as the sampling media. The aerodynamic cut-off diameters of this sampler were 0.49, 0.95, 1.5, 3.0 and 7.2 µm, respectively. To separate the fine and coarse mode particles, 1.5 µm was used as a cut-off size. Over CEA, a 10-stage Micro-Orifice Uniform Deposit Impactor (MOUDI; MSP Corp., Shoreview, MN, USA) with a flow rate of 30 L min−1 was used, and Teflon filters (Pall Corp., Port Washington, NY, USA), 47 mm in diameter and 1 µm pore size, were used as sampling substrates to collect the size-segregated aerosol samples. The 50% cut-off mass median aerodynamic diameters of the MOUDI were 0.056, 0.10, 0.18, 0.32, 0.56, 1.0, 1.8, 3.2, 5.6, 10 and 18 µm. A cut-off size 1.8 µm was used to separate the fine and coarse aerosol fractions. Total suspended particles were also collected during this cruise, using model 3500 Chemcomb Cartridge devices (Thermo Scientific, Waltham, MA) with a flow rate of ca. 15 L min−1 and polytetrafluoroethylene filters (47 mm diameter, 1.0 µm pore size) as sampling substrates. To avoid contamination from the ship, a wind speed and direction system installed on the same sampling platform was utilized to control all sampling instruments, which operated sampling only when the wind was from a sector 90° left and right on the centre line of the ship’s path and at wind speeds >2 m s−1. During sampling, loading and unloading of the filters were conducted in a 100-class high-efficiency particulate air-filtered laminar flow clean-room hood in the ship’s chemical laboratory, following clean-room operation procedures. After sampling, sample filters with field blanks were kept in the refrigerator at 4°C in the ship. Detailed sampling information is presented in Table 1.
Table 1 Sampling information, including wind speed (WS), air temperature (AT), relative humidity (RH) and air pressure (AP). | |||||||
Sample type | No. | Sampling date | Lat. (°S), Long. (°E) | WS (m s−1) | AT (°C) | RH (%) | AP (hPa) |
Total suspended particles | T1 | 25/11/10–27/11/10 | 34°S, 109°E–41°S, 100°E | 14.1 | 8.8 | 68.4 | 1026 |
| T2 | 27/11/10–30/11/10 | 42°S, 100°E–56°S, 94°E | 6.9 | 13.1 | 78.2 | 1014 |
| T3 | 30/11/10–02/12/10 | 56°S, 94°E–62°S, 81°E | 14.5 | 0.7 | 94.5 | 995 |
| T4 | 03/12/10–04/12/10 | 65°S, 78°E–69°S, 94°E | 13.4 | −3.4 | 79.5 | 985 |
| T5 | 05/12/10–07/12/10 | 69°S, 76°E–69°S, 76°E | 4.2 | −2 | 55.9 | 996 |
| T6 | 11/01/11–19/01/11 | 69°S, 75°E–64°S, 102°E | 5.8 | 0.5 | 83.3 | 997 |
| T7 | 19/01/11 | 64°S, 103°E–66°S, 110°E | 5.9 | 0.7 | 76.2 | 999 |
| T8 | 26/01/11–28/01/11 | 66°S, 110°E–65°S, 87°E | 8.1 | 0.1 | 73.5 | 988 |
| T9 | 28/01/11–30/01/11 | 64°S, 84°E–69°S, 76°E | 6.3 | −0.6 | 78.3 | 996 |
| T10 | 10/02/11–11/02/11 | 69°S, 78°E | 6 | −4.3 | 45.3 | 986 |
| T11 | 12/02/11–15/02/11 | 69°S, 77°E | 7.8 | −4.4 | 48 | 992 |
| T12 | 15/02/11–18/02/11 | 69°S, 77°E–69°S, 78°E | 11.7 | −3.6 | 47.8 | 995 |
| T13 | 22/02/11–23/02/11 | 69°S, 77°E–69°S, 75°E | 9.2 | −7.1 | 62 | 982 |
| T14 | 26/02/11–01/03/11 | 69°S, 76°E–57°S, 76°E | 10.6 | −1.9 | 82.3 | 983 |
| T15 | 02/03/11–04/03/11 | 58°S, 81°E–44°S, 96°E | 9.4 | 8.6 | 70.1 | 1018 |
| T16 | 04/03/11–06/03/11 | 44°S, 96°E–36°S, 102°E | 7.7 | 13.7 | 67.5 | 1023 |
| T17 | 06/03/11–08/03/11 | 35°S, 102°E–32°S, 115°E | 13.8 | 20 | 59.9 | 1019 |
Cascade impactor | CI1 | 25/11/10–30/11/11 | 34°S, 109°E–56°S, 94°E | 11.3 | 9.9 | 74.1 | 1019 |
| CI2 | 30/11/10–04/12/10 | 56°S, 94°E–69°S, 76°E | 16.1 | −1.2 | 89.2 | 988 |
| CI3 | 26/02/11–02/03/11 | 69°S, 76°E–52°S, 84°E | 11.3 | −0.3 | 85.4 | 987 |
| CI4 | 03/03/11–07/03/11 | 48°S, 89°E–33°S, 110°E | 9.3 | 14.3 | 63.6 | 1023 |
MOUDIa | M1 | 11/01/11–19/01/11 | 69°S, 75°E–66°S, 110°E | 5.8 | 0.5 | 82.7 | 997 |
| M2 | 26/01/11–30/01/11 | 66°S, 110°E–69°S, 76°S | 7.4 | −0.2 | 76 | 991 |
aMicro-Orifice Uniform Deposit Impactor.
Chemical analyses
Aerosol samples were analysed for elements, including Na, Mg, K, Al, Fe, Mn, Ni, Cd and Se, through inductively coupled plasma mass spectrometry (ICP-MS) with a 7500ce model (Agilent Technologies, Santa Clara, CA, USA) at the Third Institute of Oceanography, China, following the same methods described by Gao et al. (2013). Briefly, one quarter from each aerosol sample filter was digested with concentrated HNO3 in a Microwave Accelerated Reaction System (CEM Corp., Matthews, NC, USA). Three steps in the digestion process were used: (1) heating to 170±5°C in 5.5 min, (2) keeping at 170±5°C for 30 min for finishing digestion and (3) cooling down for 20 min. Digested solutions were diluted with Milli-Q water to achieve an acidity of 4% and then injected into the ICP-MS system. The detection limits were ca. 0.001 ng m−3 for Na, Mg and K; ca. 0.003 ng m−3 for Fe, Ni and Se; and ca. 0.005 ng m−3 for Cd in this study. The average precision for replicate samples was ca. 2%, and the overall average field blank levels were ca. 2% relative to samples. The recoveries of trace elements by this digestion method were determined by utilizing the environmental calibration standard 5183-4688 from Agilent Technologies, based on the same digestion and analysis as our samples. The results showed that the recoveries of Na, Mg, K, Al, Fe, Mn, Ni, Cd and Se ranged from 93% to 101%. External standards curves were constructed (R2>0.9999) for the determinations of trace elements in samples. The final concentrations of selected trace elements in samples were obtained after subtraction of their appropriate field blanks.
Data analyses
Meteorological data analyses
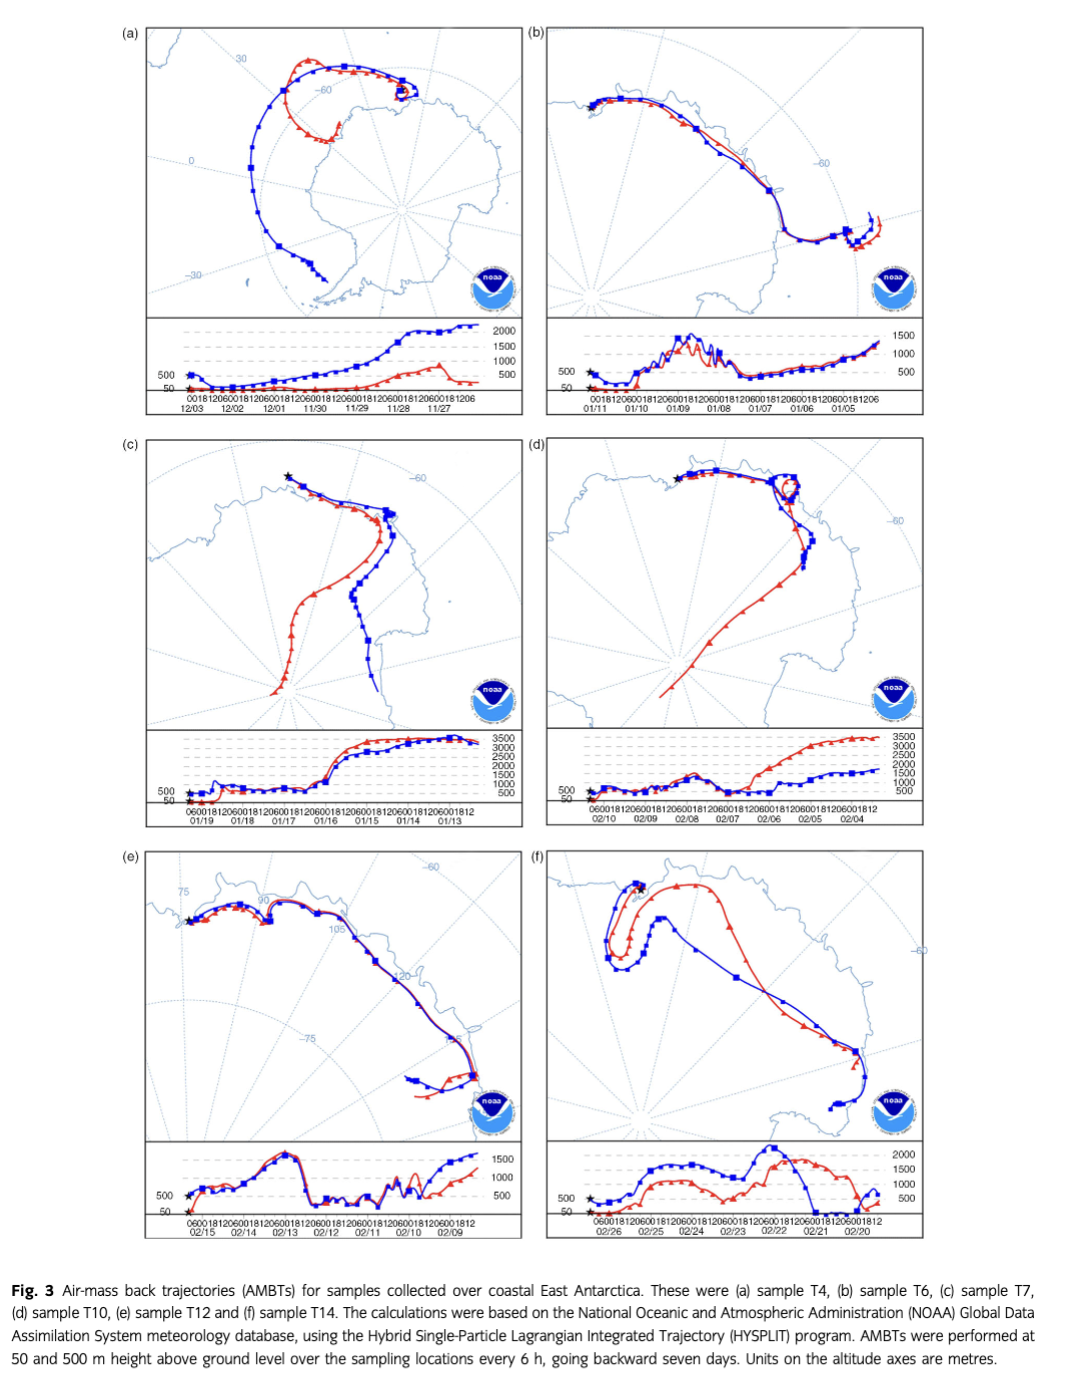
During sampling periods, the meteorological data, including air temperature, air pressure, relative humidity, wind speed and wind direction, were obtained from the ship’s weather stations (Table 1). To explore possible sources of the observed trace elements in aerosols, air mass back trajectories were performed at 50 and 500 m height above the ground over the sampling locations every 6 h, going backward seven days. The trajectories were calculated from the National Oceanic and Atmospheric Administration Global Data Assimilation System meteorology database (Draxler & Rolph 2014), using the Hybrid Single-Particle Lagrangian Integrated Trajectory (HYSPLIT) program.
Enrichment factor
The use of an enrichment factor (EF) is a first-step of source identification to differentiate the possible sources of atmospheric trace elements observed in this study. EF is defined as follows:
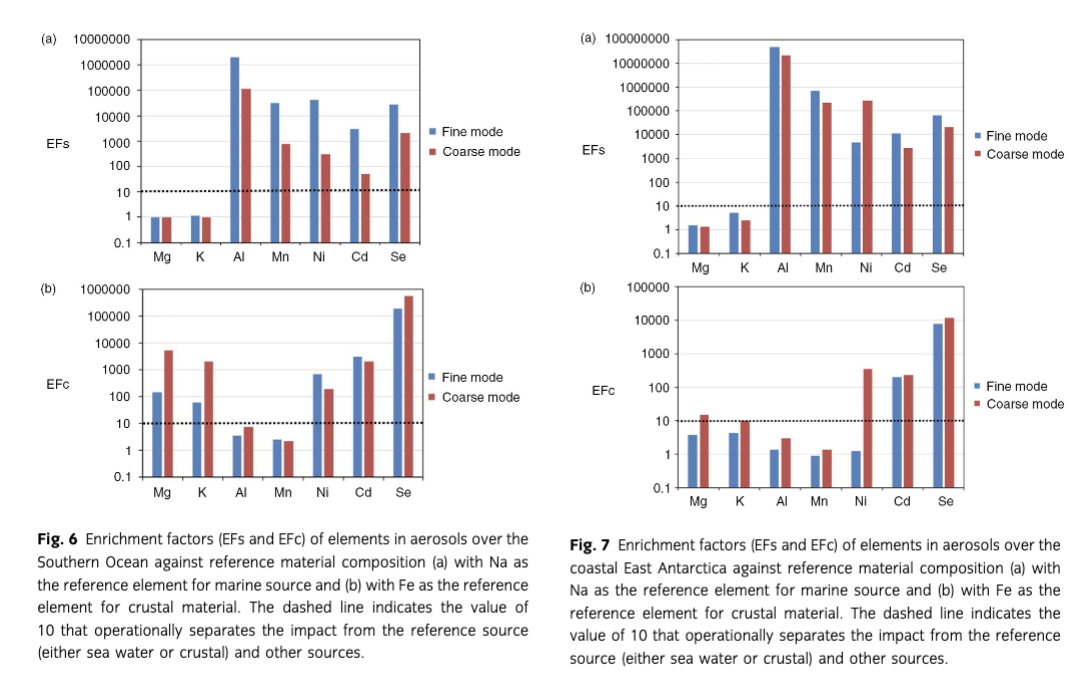
where EFi is the EF of element i, r is the reference element, (Xi /Xr )air is the concentration ratio of element i over the reference element r in aerosols, and (Xi /Xr )sou is the abundance ratio of element i over r in source materials. In this paper, EFsi is the EF for the source of sea water by utilizing Na as the reference element abundant in the ocean waters (Millero 2013). EFci is the EF for crustal source, with Fe being chosen as the representative element of crustal materials (Taylor 1964), as good correlations among typical crustal elements (Fe, Mn and Al) were found in this study over the SO and CEA (R2>0.5, n=17). If an EF value for an element is less than 10, the source represented by element r is likely the source for element i; if EF>10, it can be considered that element i has another source, as the element i is greatly enriched relative to element r (Chester et al. 1991; Weller et al. 2008).
Results and discussion
Mass concentration distributions
Elements Na, Mg, K
Results showed that the average concentrations of Na were 1100 ng m−3 over the SO and 990 ng m−3 over CEA, while the highest observed Na concentrations were 2700 ng m−3 over the SO and 1800 ng m−3 over CEA (Table 2). The mean concentration of Na observed over CEA was comparable with that reported by Artaxo et al. (1992) over the Antarctic Peninsula, which was 1046.2 ng m−3. Xu et al. (2013) showed that sea-salt aerosols in bulk samples contributed to ca. 72% of the mass over the SO and ca. 56% in CEA. Significant latitudinal gradient of sea-salt aerosol indicated by Na was observed over the SO (Table 2) affected by the variation of wind speeds. The strong westerly wind with speed >13 m s−1 over the SO could explain the observed high concentrations of sea-salt elements. The average concentrations of both Mg and K were<200 ng m−3 over the SO and CEA. Sea spray or bubble bursting processes in the SO was the dominant source for the observed sea-salt elements over these regions (Minikin et al. 1998; Wagenbach et al. 1998). The concentrations of sea-salt elements (Na, Mg and K) observed in CEA during this study in austral summer were more than four times higher than those at Neumayer Station, located at 70°39′S, 8°15′W (Weller et al. 2008). This difference in sea-salt concentrations could be explained by the distance to open water as aerosol sampling conducted by Weller et al. (2008) was made on land, about 1.5 km south of Neumayer Station which is more than 10 km from open water. The presence of sea ice in CEA may contribute to Na depletion in sea-salt aerosol from sea ice through the formation of mirabilite (Na2SO4·10H2O) (Fattori et al. 2005; Yang et al. 2008; Kalnajs et al.2013). Rankin & Wolff (2003) found that over the coast of the Weddell Sea, 60% of the total sea salt came from brine and frost flowers on the sea ice rather than open water. Hara et al. (2012) conducted aerosol sampling at Syowa Station and found that fractionated sea-salt particles were accumulated in the ultrafine-coarse modes, with higher Mg2+/Na+ and K+/Na+ ratios compared with those of bulk seawater. In this study, higher Mg2+/Na+ and K+/Na+ ratios than those of bulk seawater werealso found in aerosol samples collected in CEA, implying that Na depletion may affect the EF calculation using Na as the representative element for seawater. However, Weller et al. (2008) concluded that sea-salt fractionation could cause ca.11.8% of Na depletion by mass, leading to an increase of the EF to ca.1.12 in winter, when sea-salt fractionation was most active. Therefore, the Na depletion process may not affect the general EF results in this study. Further investigation is needed to solve this problem.
Table 2 Elements concentration over the Southern Ocean (SO) and coastal East Antarctica (CEA). | ||||||||||
|
| Trace elements (ng m−3) | ||||||||
Region | Sample ID | Na | Mg | K | Al | Fe | Mn | Ni | Cd | Se |
SO | T1 | 2700 | 360 | 150 | 110 | 8.1 | 0.29 | 0 | 0 | 0.19 |
| T2 | 180 | 49 | 58 | 77 | 6.1 | 0.2 | 0 | 0 | 0.09 |
| T3 | 1700 | 230 | 120 | 140 | 10 | 0.25 | 0 | 0 | 0.17 |
| T14 | 230 | 88 | 100 | 140 | 11 | 0.46 | 0 | 0 | 0.4 |
| T15 | 1200 | 220 | 210 | 240 | 38 | 0.73 | 0.07 | 0.02 | 0.11 |
| T16 | 880 | 220 | 140 | 180 | 15 | 0.9 | 0 | 0.01 | 0.36 |
| T17 | 790 | 130 | 140 | 160 | 12 | 0.39 | 0 | 0 | 0.4 |
| Range | 180–2700 | 49–360 | 58–210 | 77–240 | 6.1–38 | 0.2–0.9 | 0–0.07 | 0–0.02 | 0.09–0.4 |
| Average | 1100 | 190 | 130 | 150 | 14 | 0.46 | 0.01 | 0.004 | 0.25 |
CEA | T4 | 620 | 150 | 220 | 270 | 29 | 0.75 | 0.59 | 0 | 0.2 |
| T5 | 160 | 62 | 76 | 160 | 14 | 0.61 | 0 | 0 | 0.11 |
| T6 | 1800 | 260 | 170 | 150 | 20 | 0.54 | 1.7 | 0.02 | 0.09 |
| T7 | 1800 | 310 | 340 | 310 | 56 | 1.2 | 2.2 | 0.04 | 0.48 |
| T8 | 1000 | 150 | 150 | 130 | 31 | 0.50 | 1.6 | 0.03 | 0.11 |
| T9 | 1500 | 220 | 160 | 160 | 14 | 0.45 | 0 | 0 | 0.46 |
| T10 | 360 | 90 | 120 | 160 | 20 | 0.77 | 0 | 0.02 | 0.49 |
| T11 | 440 | 89 | 120 | 150 | 30 | 0.53 | 0.27 | 0.05 | 0.11 |
| T12 | 610 | 140 | 120 | 160 | 22 | 0.67 | 0.06 | 0.01 | 0.16 |
| T13 | 1600 | 330 | 270 | 220 | 29 | 0.95 | 1.1 | 0 | 0.64 |
| Range | 160–1800 | 62–330 | 76–340 | 130–310 | 14–56 | 0.45–1.2 | 0–2.2 | 0–0.05 | 0.09–0.64 |
| Average | 990 | 180 | 170 | 190 | 27 | 0.70 | 0.75 | 0.017 | 0.29 |
Elements Al, Fe, Mn
The concentrations of total Al ranged from 77 to 240 ng m−3 over the SO (average 150 ng m−3) and from 130 to 310 ng m−3 over CEA (average 190 ng m−3; Table 2). Over the SO, the concentrations of total Fe ranged from 6.1 to 38 ng m−3 (average 14 ng m−3) and 14 to 56 ng m−3 (average 27 ng m−3) over CEA. One explanation for the high Fe concentration (56 ng m−3) observed in the areas of 64–66°S, 103°E could be due to possible contributions by local dry lands, as suggested by Gao et al. (2013). Compared with the results (average Fe 130 ng m−3) from McMurdo Station (77°51′S, 166°40′E) (Mazzera et al. 2001), relatively low Fe concentrations in aerosols were observed over both the SO and CEA during this study. The high Fe concentrations around McMurdo Station could be affected by local sources and an active volcano existed (Kyle et al. 1990). The concentrations of total Mn ranged from 0.2 to 0.9 ng m−3 over the SO (average 0.46 ng m−3) and from 0.45 to 1.2 ng m−3 over CEA (average 0.70 ng m−3; Table 2). Low Mn concentrations were observed over the South Pole during the austral summer with an arithmetic mean of 0.013 ng m−3 (Maenhaut et al. 1979), while high Mn concentrations (average 2.5 ng m−3) in ambientPM10 samples were observed at McMurdo Station (Mazzera et al. 2001). Wagenbach et al. (1988) utilized Mn as the reference element for crustal aerosol and found the maximum Mn over coastal West Antarctica (70°S, 8°W) in the austral summer, during which crustal aerosol concentration was more than two times higher than the mean concentration. Similar seasonal maxima for crustal elements in aerosols were also observed at Neumayer Station by Weller et al. (2008), who concluded that the crustal elements (Al, La, Ce and Nd) in aerosols showed the maximum during the austral summer, with the summer mean 1.7 times the annual mean. The concentrations of crustal elements (Fe, Mn) observed during this study were comparable with studies in the SO and coastal Antarctic sites by other investigators (Chester et al. 1991; Rädlein & Heumann 1992; Mishra et al. 2004; Bowie et al. 2009). In addition, significant spatial variations in the concentrations of both Fe and Mn were found over the SO. Aerosol samples collected over the SO, especially aerosol collected from<40°S near west Australia, could be influenced by dust from Australia deserts (Tanaka & Chiba 2006), although dust may also be carried by long-range transport from the continents, such as Patagonia in South America (Johnson et al. 2011) and South Africa (Gassó & Stein 2007). However, aerosols over CEA could be affected by coastal Antarctic local sources, which can be indicated by the air mass back trajectories (Figs. 2 and 3). The McMurdo Dry Valleys is one potential source contributing to the observed high crustal elements concentrations in this study, as discussed in more detail by Gao et al. (2013).
Elements Ni, Cd, Se
The observed Ni concentrations ranged from 0 to 0.07 ng m−3 over the SO (average 0.01 ng m−3) and from 0 to 2.2 ng m−3 over CEA (average 0.75 ng m−3), while the observed Cd concentrations ranged from 0 to 0.02 ng m−3 over the SO (average 0.004 ng m−3) and from 0 to 0.05 ng m−3 over CEA (average 0.017 ng m−3) during the austral summer. These results were comparable to previous observations over the SO and CEA. Ezat et al. (1994) investigated the long-range atmospheric transport of aerosols to the southern Indian Ocean, and they found that the average ambient concentration of Ni was 0.25 ng m−3. Artaxo et al. (1992) conducted aerosols observations over the Antarctic Peninsula, and they concluded that in the fine mode particles, the Ni concentration was 0.076 ng m−3 during the summer, while PM10 observation at McMurdo Station revealed that the average Ni concentration was 0.14 ng m−3 (Mazzera et al. 2001). However, Maenhaut et al. (1979) measured the concentrations and size distributions of trace elements in aerosols in the South Pole atmosphere, and reported that the arithmetic means atmospheric concentration of Cd was<0.018 ng m−3. Annibaldi et al. (2007) conducted research on water-soluble and insoluble fractions of Cd in Antarctic aerosols at Terra Nova Bay and found that total extractable (soluble portion and insoluble portion) fractions of Cd in PM10 aerosol samples ranged from 0.0006 ng m−3 to ca. 0.006 ng m−3 (average concentration 0.003 ng m−3). Higher average concentrations of Ni and Cd over CEA than these over the SO may suggest possible sources for these elements around coastal Antarctica, although other factors may also affect their concentrations in this region, such as the impacts of different meteorological conditions and long-range transport from other continents (Mishra et al. 2004).
The observed Se concentrations ranged from 0.09 to 0.4 ng m−3 over the SO (average 0.25 ng m−3) and from 0.09 to 0.64 ng m−3 over CEA (average 0.29 ng m−3) during the austral summer. Observations over the South Pole showed that the average ambient concentration of Se was ca. 0.006 ng m−3 during the summer time (Zoller et al. 1974; Cunningham & Zoller 1981), while observations by Artaxo et al. (1992) showed that average atmospheric concentration of Se was 0.064 ng m−3 over the Antarctic Peninsula. At Neumayer Station, Weller et al. (2008) reported that average ambient concentration of Se was 0.025 ng m−3 during the austral summer. Different source processes could explain the geographical variability of Se concentrations. Weller et al. (2008) further investigated the potential source of Se and concluded that a distinct ambient Se concentration maximum existed in austral summer and there was a significant correlation between Se and sulphur-containing species (methanesulphonate [MSA]) and non-sea-salt sulphate ( ) (r[MSA]=0.66; r[]=0.67), indicating a potential marine biogenic source for this element. However, no good correlation between MSA or and Se (r[MSA]=0.09; r[]=0.22) was found in this study, which implies that the existence of Se in aerosols in these regions is not solely explained by marine biogenic emissions. Other potential sources of Se could be volcanic emissions, as pointed out by Cunningham & Zoller (1981), who stated that the atmospheric load of volatile elements including Se could be influenced by volcanic emissions. Sea spray, volcanoes and the biogenic emissions could explain ca. 60% of the atmospheric Se budget (Weller et al. 2008). In general, the concentrations of Ni, Cd and Se observed during this study were low and comparable with previous observations (Rädlein & Heumann 1992, 1995; Annibaldi et al. 2007; Weller et al. 2008).
Particle size distributions
Over the Southern Ocean
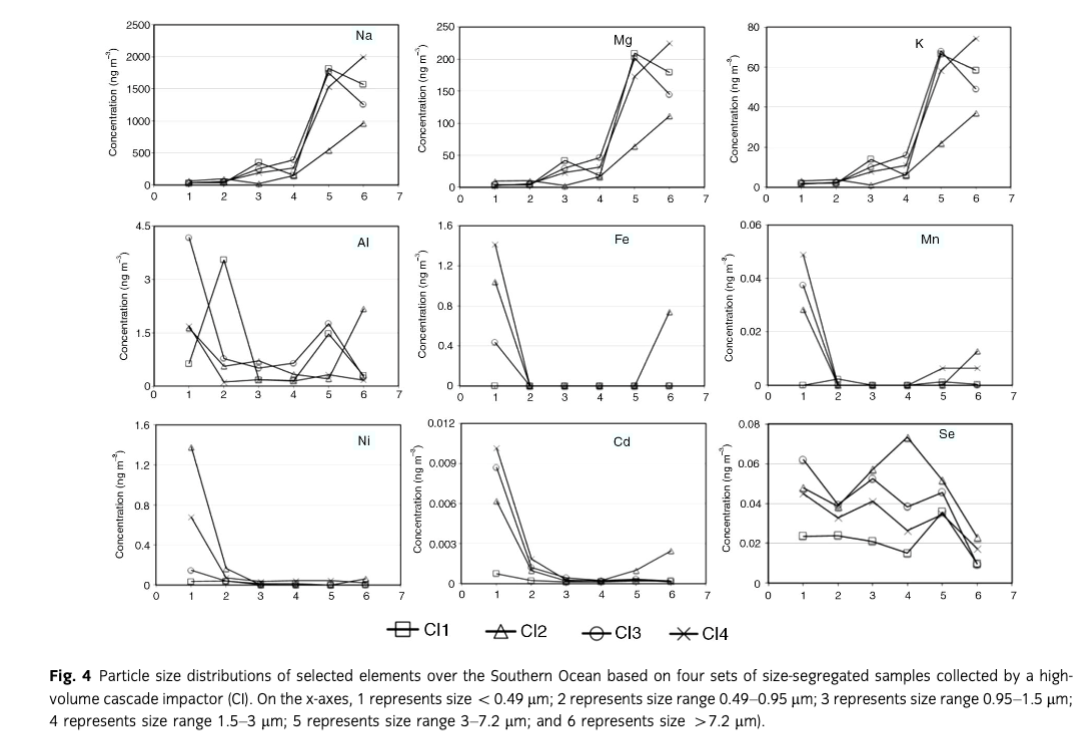
Figure 4 shows the size distributions of selected trace elements (Na, Mg, K, Al, Fe, Mn, Ni, Cd and Se) in aerosols over the SO derived from four sets of CI samples. The element Na, Mg and K were mainly accumulated in the coarse mode with particle size>3 µm. Sea-salt aerosol over the SO was strongly influenced by westerly winds, which was consistent with the concentration variation and size distribution of sea salt under the high wind speed condition reviewed by O’Dowd et al. (1997). Chester (1990) also concluded that sea-salt-generated elements mainly existed in particle size range from approximately 3 µm to >7 µm. The elements Al, Fe and Mn showed a bimodal size distribution, with size peaks both in the fine mode (<0.95 µm) and coarse modes (>3 µm), but the mass concentrations were mainly accumulated in the fine mode. However, the elements Ni and Cd were mainly accumulated in the fine mode (size<0.49 µm) over the SO, while Se presented a size distribution pattern with peaks at size <0.49 µm, 0.95–1.5 µm and 3–7.2 µm. The coarse mode fractions of Al, Fe, Mn, Ni, Cd and Se in aerosols could be explained by the crustal source, having mass median diameters ranging from about 1 to about 3 µm (Chester 1990). The fine mode fractions, in contrast, could be attributed to long-range transported dust, volcanic processes and anthropogenic processes (Chester 1990).
Over Coastal East Antarctica
Figure 5 shows the size distributions of selected trace elements (Na, Mg, K, Al, Fe, Mn, Ni, Cd and Se) in aerosols over CEA derived from two sets of MOUDI samples (Fig. 5). The results showed that Na, Mg and K mainly existed in the coarse mode (particle size >1.8 µm), which could be explained by the contributions from sea spray over the Antarctic coastal seas (Minikin et al. 1998; Wagenbach et al. 1998). The element Al, Fe, Mn, Ni, Cd and Se displayed bimodal size distribution patterns, peaking at both fine mode (size <1.8 µm) and coarse mode (size >1.8 µm), but their mass concentrations were mainly accumulated in the coarse mode, except for Cd and Se. Gao et al. (2013) indicated that the size peak of atmospheric Fe in the coarse mode could be derived from crustal substances from regional sources in Antarctica. They investigated the dust source region with air mass back trajectories and suggested that McMurdo Dry Valleys could bring in crustal materials to coastal Antarctic sites. Therefore, the presence of Al, Fe, Mn, Ni, Cd and Se in coarse mode particles could be attributed to local aeolian inputs; however, further research is required to justify this interpretation. Different chemical and physical processes (such as the chemical weathering of rocks and wind speeds) may be involved and reflected by different size distributions of these elements in the regions, and the size distributions of different metals should depend on the balance of different sources: marine, crustal, biogenic and anthropogenic (Grgić 2009).

Sources identification of trace elements in aerosols
Enrichment factor
Results from both CI and MOUDI samples were separated into fine and coarse modes to explore the possible particle size distribution/sources relationships. The calculated EF (EFs and EFc) of trace elements in both fine and coarse particles over the SO is shown in Fig. 6. Mg and K in both fine and coarse modes had EFs<10 and EFc>10, suggesting they originated from marine sources. In contrast, Mn and Al in both modes had EFs>10 and EFc<10, suggesting they were derived from crustal sources (Fig. 6). However, EFs and EFc of Ni, Cd and Se were much higher than the threshold (10) both for marine and crustal sources, suggesting additional sources for these elements. The calculated EFs and EFc of trace elements in both fine and coarse particles over CEA are shown in Fig. 7. Both EFs and EFc of Cd and Se were higher than the marine and crustal threshold (10). Therefore, additional sources, such as biogenic emissions, volcano eruptions and anthropogenic emissions, need to be considered to explore the additional sources for these two elements (Rädlein & Heumann 1995; Pacyna & Pacyna 2001). Mn and Al in both particle size modes were from the crustal source as EFc<10 and EFs >10, while Mg and K in both modes had EFs<10. However, K in both modes had EFc<10, and Mg in fine mode had EFc<10 over CEA. Crustal sources may therefore contribute to Mg and K in CEA. Ni in fine mode had EFc<10, but EFs>1000, indicating that contributions from crustal source may explain this fraction of Ni in aerosols (Cempel & Nikel 2006).
Correlations between selected trace elements
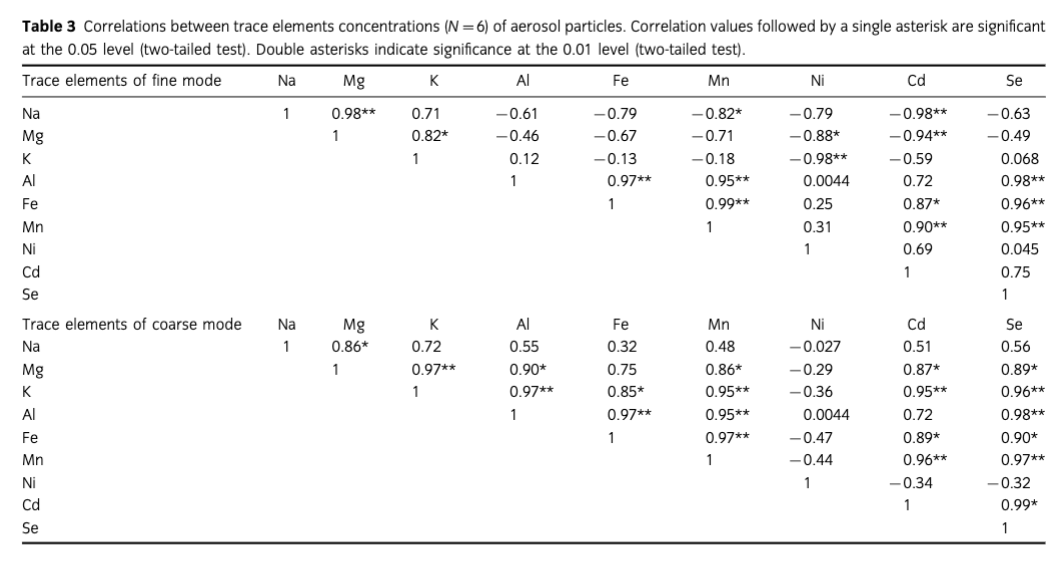
To further explore sources of selected trace elements (Na, Mg, K, Al, Fe, Mn, Ni, Cd and Se) in aerosols over the SO and CEA, correlations between each element were calculated in both fine and coarse modes (n=6), which are shown in Table 3. In the fine mode particles, significant correlations were found between Na and Mg (Pearson coefficient>0.9, p<0.001), and between K and Mg (Pearson coefficient>0.8, p<0.05), suggesting that Na and Mg were mainly derived from seawater, even though Mg and K had certain contributions from crustal sources in CEA, as inferred by the EF. Good correlations (Pearson coefficient>0.9, p<0.001) between Fe, Al and Mn revealed that these three elements in the fine mode shared common sources. Notable correlations were also found between Cd, Se and Fe (Pearson coefficient>0.8, p<0.05), suggesting that atmospheric Fe, Al, Mn, Cd and Se in the fine fraction could be derived from dust carried by long-range transport, during which particle fractionation occurred and their lifetime as smaller particles in the atmosphere was extended (Seinfeld & Pandis 2006). In the coarse mode, significant correlations appeared between Fe, Al, Mn and K (Pearson coefficient>0.9, p<0.001, except for that between Fe and K (Pearson coefficient>0.8, p<0.05). Together with the EF results (EFs and EFc), this indicates that Fe, Al and Mn mainly came from crustal sources, which also contributed to K in coarse mode particles. Significant correlation between Mn, Cd and Se (Pearson coefficient>0.9, p<0.001) imply crustal inputs of these elements in coarse mode particles, while significant correlations between Mg, Cd and Se (Pearson coefficient >0.8, p<0.05) also indicated that sea salt could be the source of these elements in the coarse mode.
Implication for aerosol impacts on climate and biogeochemical cycling
Aerosols play an important role in climate and biogeochemistry cycling (Charlson et al. 1987; Jickells et al. 2005; Mahowald 2011). These particles modify the radiation budget of the atmosphere, both directly and indirectly (O’Dowd & De Leeuw 2007). Aerosols affect the radiation budget indirectly through affecting microphysical, optical and radiative properties of clouds by serving as cloud condensation nuclei (CCN) or ice nuclei (IN) (Albrecht 1989; DeMott et al. 2003), depending on their chemical composition and size (Dusek et al. 2006). In this study, the particle size distributions of Fe and Mn in aerosols observed over the SO were mainly accumulated at the fine mode (<0.49 µm), largely in the size mode of CCN. This result implies that these fine mineral aerosol particles could act as CCN, affecting cloud albedo over the SO. Mineral aerosols can also interact with sulphate and nitrogen containing species during their transport in the atmosphere, and form internally mixed particles, further modifying the ability of mineral particles acting as CCN (Dentener et al. 1996; Levin et al. 2005). Moreover, mineral aerosols have been known to be effective IN, playing a vital role in ice crystal formation in high clouds (DeMott et al. 2003; Cziczo et al. 2009). These ice crystals could affect the radiation budget, the hydrological cycle and water vapour distribution in the atmosphere (Avramov & Harrington 2010; DeMott et al. 2010). Sea-salt particles can also act as efficient CCN (Murphy at al. 1998; Pierce & Adams 2006).
Additionally, over the global ocean, the mean concentrations of atmospheric Fe, Ni and Cd were 550 ng m−3, 2.1 ng m−3 and 0.1 ng m−3, respectively (Heintzenberg et al. 2000). Once deposited, these bioactive elements can affect the growth of phytoplankton in the euphotic zone of the ocean (Bruland et al. 1991; Morel & Price 2003). Profiles for dissolved Fe, Ni and Cd in the ocean generally show the patterns of surface depletion and deep-water enrichment, resulting from the uptake by biota in surface waters and regeneration of sinking particles in deep waters (Norisuye et al. 2007; Millero 2013). These elements are required by phytoplankton during various metabolic processes (Price & Morel 1991; Cullen et al. 1999). Lane & Morel (2000) reported that Cd could act as a Cd-specific carbonic anhydrase in certain diatoms. In general, Fe, Ni and Cd in seawater play a critical role in regulating oceanic phytoplankton growth and, hence, may influence the global carbon cycle.
However, measurements of in situ speciation and bio-reactivity of bioactive elements are few, both in the surface waters of the SO and its marine atmosphere. Sarthou et al. (2011) showed that higher values of labile Fe(II) were found in the surface mixed layer than in deep waters toward high latitudes, which could be attributed to atmospheric Fe(II) deposition (Gao et al. 2013). Gao et al. (2013) reported that total dissolvable Fe air–sea deposition fluxes were 0.007–0.52 mg m−2 yr−1 over the SO. The atmospheric dissolvable Fe input contributes to the dissolved Fe pool in SO surface waters, supporting marine primary production (Chever et al. 2010). In any case, once these elements get into the seawater, they are present in different chemical forms such as free ionic, labile bound, and strongly bound to organic ligands (Baeyens et al. 2011). However, not all of these forms are accessible to phytoplankton, and they need to be in free ionic or labile bound forms (Davlson & Zhang 1994; Morel & Price 2003; Baeyens et al. 2011) in order to cross the phytoplankton cell membrane. In this study, the observed atmospheric Ni and Cd concentrations were low compared with Fe, but these three elements (Fe, Ni and Cd) were mainly accumulated in the fine mode. Once deposited into the ocean, these elements in fine particles may be more easily dissolved than coarse mode particles and get involved in bio-interaction through colloidal aggregation and organic complexation by phytoplankton (Wells 2002). However, precisely defining these elements’ bioavailability is challenging, as it involves complicated interactions among biogeochemical processes, biological organisms, trace elements chemistry and ambient environmental conditions.
Acknowledgements
This research was sponsored by the US National Science Foundation Award 0944589 to YG. We thank the Chinese Arctic and Antarctic Administration and Polar Research Institute of China for logistic support. We also thank Jiexia Zhang for help with sample collection and Liqi Chen, Qi Lin, Wei Li, Hongmei Lin and Shun Yu for help with sampling preparation and sample analysis. We are grateful to Jianqiong Zhan, Tianyi Xu and Pami Mukherjee for discussions. YG specifically acknowledges the Chinese 27th Antarctic Expedition scientific team and staff at the Chinese Antarctic Zhongshan Station for their support of her participation in the voyage at sea and in the Antarctic. This work would not have become possible without the dedication of the crew of the Chinese icebreaker Xue Long.
References
- Albrecht B.A. 1989. Aerosols, cloud microphysics, and fractional cloudiness. Science 245, 1227–1230. Publisher Full Text
- Andreae M.O. 1986. The ocean as a source of atmospheric sulfur compounds. In P. Buat-Ménard (ed.): The role of air–sea exchange in geochemical cycling. Pp. 331–362. Berlin: Springer.
- Annibaldi A., Truzzi C., Illuminati S., Bassotti E. & Scarponi G. 2007. Determination of water-soluble and insoluble (dilute-HCl-extractable) fractions of Cd, Pb and Cu in Antarctic aerosol by square wave anodic stripping voltammetry: distribution and summer seasonal evolution at Terra Nova Bay (Victoria Land). Analytical and Bioanalytical Chemistry 387, 977–998. Publisher Full Text
- Arimoto R., Zeng T., Davis D., Wang Y., Khaing H., Nesbit C. & Huey G. 2008. Concentrations and sources of aerosol ions and trace elements during ANTCI-2003. Atmospheric Environment 42, 2864–2876. Publisher Full Text
- Artaxo P., Rabello M.L.C., Maenhaut W. & van Grieken R. 1992. Trace elements and individual particle analysis of atmospheric aerosols from the Antarctic Peninsula. Tellus B 44, 318–334. Publisher Full Text
- Avramov A. & Harrington J.Y. 2010. Influence of parameterized ice habit on simulated mixed phase Arctic clouds. Journal of Geophysical Research—Atmospheres 115, D03205, doi: 10.1029/2009JD012108. Publisher Full Text
- Baeyens W., Bowie A.R., Buesseler K., Elskens M., Gao Y., Lamborg C., Leermakers M., Remenyi T. & Zhang H. 2011. Size-fractionated labile trace elements in the northwest Pacific and Southern oceans. Marine Chemistry 126, 108–113. Publisher Full Text
- Berg O.H., Swietlicki E. & Krejci R. 1998. Hygroscopic growth of aerosol particles in the marine boundary layer over the Pacific and Southern oceans during the First Aerosol Characterization Experiment (ACE 1). Journal of Geophysical Research—Atmospheres 103, 16535–16545. Publisher Full Text
- Bjerknes J. & Solberg H. 1922. Life cycle of cyclones and the polar front theory of atmospheric circulation. Geofysiske Publikasjoner 3, 1–18.
- Blain S., Queguiner B., Armand L., Belviso S., Bombled B., Bopp L., Bowie A., Brunet C., Brussaard C., Carlotti F., Christaki U., Corbiere A., Durand I., Ebersbach F., Fuda J.-L., Garcia N., Gerringa L., Griffiths B., Guigue C., Guillerm C., Jacquet S., Jeandel C., Laan P., Lefevre D., Monaco C.L., Malits A., Mosseri J., Obernosterer I., Park Y.-H., Picheral M., Pondaven P., Remenyi T., Sandroni V., Sarthou G., Savoye N., Scouarnec L., Souhaut M., Thuiller D., Timmermans K., Trull T., Uitz J., van Beek P., Veldhuis M., Vincent D., Viollier E., Vong L. & Wagener T. 2007. Effect of natural iron fertilization on carbon sequestration in the Southern Ocean. Nature 446, 1070–1074. Publisher Full Text
- Bowie A.R., Lannuzel D., Remenyi T.A., Wagener T., Lam P.J., Boyd P.W., Guieu C., Townsend A.T. & Trull T.W. 2009. Biogeochemical iron budgets of the Southern Ocean south of Australia: decoupling of iron and nutrient cycles in the Subantarctic zone by the summertime supply. Global Biogeochemical Cycles 23, GB4034, doi: 10.1029/2009GB003500. Publisher Full Text
- Boyd P.W., McTainsh G., Sherlock V., Richardson K., Nichol S., Ellwood M. & Frew R. 2004. Episodic enhancement of phytoplankton stocks in New Zealand Subantarctic waters: contribution of atmospheric and oceanic iron supply. Global Biogeochemical Cycles 18, GB1029, doi: 10.1029/2002GB002020. Publisher Full Text
- Boye M., Wake B.D., Garcia P.L., Bown J., Baker A.R. & Achterberg E.P. 2012. Distributions of dissolved trace metals (Cd, Cu, Mn, Pb, Ag) in the southeastern Atlantic and the Southern Ocean. Biogeosciences 9, 3231–3246. Publisher Full Text
- Bruland K.W., Donat J.R. & Hutchins D.A. 1991. Interactive influences of bioactive trace-metals on biological production in oceanic waters. Limnology and Oceanography 36, 1555–1577. Publisher Full Text
- Cempel M. & Nikel G. 2006. Nickel: a review of its sources and environmental toxicology. Polish Journal of Environmental Studies 15, 375–382.
- Charlson R.J., Lovelock J.E., Andreae M.O. & Warren S.G. 1987. Oceanic phytoplankton, atmospheric sulphur, cloud albedo and climate. Nature 326, 655–6561. Publisher Full Text
- Chester R. 1990. Marine geochemistry. London: Unwin Hyman.
- Chester R., Berry A.S. & Murphy K.J.T. 1991. The distributions of particulate atmospheric trace metals and mineral aerosols over the Indian Ocean. Marine Chemistry 34, 261–290. Publisher Full Text
- Chever F., Sarthou G., Bucciarelli E., Blain S. & Bowie A. 2010. An iron budget during the natural iron fertilisation experiment KEOPS (Kerguelen Islands, Southern Ocean). Biogeosciences 7, 455–468. Publisher Full Text
- Cullen J.T., Lane T.W., Morel F.M.M. & Sherrell R.M. 1999. Modulation of cadmium uptake in phytoplankton by seawater CO2 concentration. Nature 402, 165–167. Publisher Full Text
- Cunningham W.C. & Zoller W.H. 1981. The chemical composition of remote area aerosols. Journal of Aerosol Science 12, 367–384. Publisher Full Text
- Cziczo D.J., Stetzer O., Worringen A., Ebert M., Weinbruch S., Kamphus M., Gallavardin S.J., Curtius J., Borrmann S. & Froyd K.D. 2009. Inadvertent climate modification due to anthropogenic lead. Nature Geoscience 2, 333–336. Publisher Full Text
- Davlson W. & Zhang H. 1994. In situ speciation measurements of trace components in natural waters using thin-film gels. Nature 367, 546–548. Publisher Full Text
- DeMott P.J., Prenni A.J., Liu X., Kreidenweis S.M., Petters M.D., Twohy C.H., Richardson M.S., Eidhammer T. & Rogers D.C. 2010. Predicting global atmospheric ice nuclei distributions and their impacts on climate. Proceedings of the National Academy of Sciences of the United States of America 25, 11217–11222. Publisher Full Text
- DeMott P.J., Sassen K., Poellot M.R., Baumgardner D., Rogers D.C., Brooks S.D., Prenni A.J. & Kreidenweis S.M. 2003. African dust aerosols as atmospheric ice nuclei. Geophysical Research Letters 30, L07808, doi: 10.1029/2009GL037639. Publisher Full Text
- Dentener F.J., Carmichael G.R., Zhang Y., Lelieveld J. & Crutzen P.J. 1996. Role of mineral aerosol as a reactive surface in the global troposphere. Journal of Geophysical Research—Atmospheres 101, 22869–22889. Publisher Full Text
- Dick A.L. 1991. Concentrations and sources of metals in the Antarctic Peninsula aerosol. Geochimica et Cosmochimica Acta 55, 1827–1836. Publisher Full Text
- Draxler R.R. & Rolph G.D. 2014. HYSPLIT—Hybrid Single-Particle Lagrangian Integrated Trajectory—Model. Silver Spring, MD: National Ocean and Atmospheric Air Resources Laboratory.
- Duce R.A., Hoffman G.L. & Zoller W.H. 1975. Atmospheric trace metals at remote Northern and Southern Hemisphere sites: pollution or natural? Science 187, 59–61. Publisher Full Text
- Dusek U., Frank G.P., Hildebrandt L., Curtius J., Schneider J., Walter S., Chand D., Drewnick F., Hings S., Jung D., Borrmann S. & Andreae M.O. 2006. Size matters more than chemistry for cloud-nucleating ability of aerosol particles. Science 312, 1375–1378. Publisher Full Text
- Echeveste P., Tovar-Sánchez A. & Agustí S. 2014. Tolerance of polar phytoplankton communities to metals. Environmental Pollution 185, 188–195. Publisher Full Text
- Ezat U., Cachier H., Polian G. & Ardouin B. 1994. Long-range atmospheric transport of aerosols to the Southern Indian Ocean (Amsterdam Island: 37° 48′ S 77° 34′ E). Journal of Aerosol Science 25, 133–134. Publisher Full Text
- Fattori I., Becagli S., Bellandi S., Castellano E., Innocenti M., Mannini A., Severi M., Vitale V. & Udisti R. 2005. Chemical composition and physical features of summer aerosol at Terra Nova Bay and Dome C, Antarctica. Journal of Environmental Monitoring 7, 1265–1274. Publisher Full Text
- Frew R., Bowie A., Croot P. & Pickmere S. 2001. Macronutrient and trace-metal geochemistry of an in situ iron-induced Southern Ocean bloom. Deep-Sea Research Part II 48, 2467–2481. Publisher Full Text
- Gao Y., Xu G., Zhan J., Zhang J., Li W., Lin Q., Chen L. & Lin H. 2013. Spatial and particle size distributions of atmospheric dissolvable iron in aerosols and its input to the Southern Ocean and coastal East Antarctica. Journal of Geophysical Research—Atmospheres 118, 12634–12648. Publisher Full Text
- Gassó S. & Stein A.F. 2007. Does dust from Patagonia reach the sub-Antarctic Atlantic Ocean? Geophysical Research Letters 34, L01801, doi: 10.1029/2006GL027693. Publisher Full Text
- Grgić I. 2009. Metals in aerosols. In I. Colbeck (ed.): Environmental chemistry of aerosols. Pp. 117–139. Oxford: Blackwell.
- Hara K., Osada K., Yabuki M. & Yamanouchi T. 2012. Seasonal variation of fractionated sea-salt particles on the Antarctic coast. Geophysical Research Letters 39, L18801, doi: 10.1029/2012GL052761. Publisher Full Text
- Heimburger A., Losno R. & Triquet S. 2013. Solubility of iron and other trace elements in rainwater collected on the Kerguelen Islands (South Indian Ocean). Biogeosciences 10, 6617–6628. Publisher Full Text
- Heimburger A., Losno R., Triquet S., Dulac F. & Mahowald N. 2012. Direct measurements of atmospheric iron, cobalt, and aluminum-derived dust deposition at Kerguelen Islands. Global Biogeochemical Cycles 26, GB4016, doi: 10.1029/2012GB004301. Publisher Full Text
- Heintzenberg J., Covert D.C. & Dingenen R.V. 2000. Size distribution and chemical composition of marine aerosols: a compilation and review. Tellus B 52, 1104–22. Publisher Full Text
- Hogan A.W. 1975. Antarctic aerosols. Journal of Applied Meteorology 14, 550–559. Publisher Full Text
- Hur S.D., Xiao C., Hong S., Barbante C., Gabrielli P., Lee K., Boutron C.F. & Ming Y. 2007. Seasonal patterns of heavy metal deposition to the snow on Lambert Glacier basin, East Antarctica. Atmospheric Environment 41, 8567–8578. Publisher Full Text
- Jickells T.D., An Z.S., Andersen K.K., Baker A.R., Bergametti G., Brooks N., Cao J.J., Boyd P.W., Duce R.A., Hunter K.A., Kawahata H., Kubilay N., laRoche J., Liss P.S., Mahowald N., Prospero J.M., Ridgwell A.J., Tegen I. & Torres R. 2005. Global iron connections between desert dust, ocean biogeochemistry, and climate. Science 308, 67–71. Publisher Full Text
- Johnson M.S., Meskhidze N., Kiliyanpilakkil V.P. & Gassó S. 2011. Understanding the transport of Patagonian dust and its influence on marine biological activity in the South Atlantic Ocean. Atmospheric Chemistry and Physics 11, 2487–2502. Publisher Full Text
- Jourdain B. & Legrand M. 2001. Seasonal variations of atmospheric dimethylsulfide, dimethylsulfoxide, sulfur dioxide, methanesulfonate, and non-sea-salt sulfate aerosols at Dumont d’Urville (coastal Antarctica) (December 1998 to July 1999). Journal of Geophysical Research—Atmospheres 106, 14391–14408. Publisher Full Text
- Kalnajs L.E., Avallone L.M. & Toohey D.W. 2013. Correlated measurements of ozone and particulates in the Ross Island region, Antarctica. Geophysical Research Letters 40, 6319–6323. Publisher Full Text
- Kyle P.R., Meeker K. & Finnegan D. 1990. Emission rates of sulfur dioxide, trace gases and metals from Mount Erebus, Antarctica. Geophysical Research Letters 17, 2125–2128. Publisher Full Text
- Lane T.W. & Morel F.M.M. 2000. A biological function for cadmium in marine diatoms. Proceedings of the National Academy of Sciences of the United States of America 97, 4627–4631. Publisher Full Text
- Levin Z., Teller A., Ganor E. & Yin Y. 2005. On the interactions of mineral dust, sea-salt particles, and clouds: a measurement and modeling study from the Mediterranean Israeli Dust Experiment campaign. Journal of Geophysical Research—Atmospheres 110, D20202, doi: 10.1029/2005JD005810. Publisher Full Text
- Maenhaut W., Zoller W.H., Duce R.A. & Hoffman G.L. 1979. Concentration and size distribution of particulate trace elements in the south polar atmosphere. Journal of Geophysical Research 84, 2421–2431. Publisher Full Text
- Mahowald N. 2011. Aerosol indirect effect on biogeochemical cycles and climate. Science 334, 794–796. Publisher Full Text
- Mazzera D.M., Lowenthal D.H., Chow J.C. & Watson J.G. 2001. Sources of PM10 and sulfate aerosol at McMurdo station, Antarctica. Chemosphere 45, 347–356. Publisher Full Text
- Millero F.J. 2013. Chemical oceanography. 4th edn. Boca Raton, FL: CRC Press.
- Minikin A., Legrand M., Hall J., Wagenbach D., Kleefeld C., Wolff E., Pasteur E.C. & Ducroz F. 1998. Sulfur-containing species (sulfate and methanesulfonate) in coastal Antarctic aerosol and precipitation. Journal of Geophysical Research—Atmospheres 103, 10975–10990. Publisher Full Text
- Mishra V.K., Kim K.-H., Hong S. & Lee K. 2004. Aerosol composition and its sources at the King Sejong Station, Antarctic Peninsula. Atmospheric Environment 38, 4069–4084. Publisher Full Text
- Moore C.M., Mills M.M., Arrigo K.R., Berman-Frank I., Bopp L., Boyd P.W., Galbraith E.D., Geider R.J., Guieu C. & Jaccard S.L. 2013. Processes and patterns of oceanic nutrient limitation. Nature Geoscience 6, 701–710. Publisher Full Text
- Morel F.M. & Price N.M. 2003. The biogeochemical cycles of trace metals in the oceans. Science 300, 944–947. Publisher Full Text
- Mosher B.W., Duce R.A., Prospero J.M. & Savoie D.L. 1987. Atmospheric selenium: geographical distribution and ocean to atmosphere flux in the Pacific. Journal of Geophysical Research—Atmospheres 92, 13277–13287. Publisher Full Text
- Mouri H., Nagao I., Okada K., Koga S. & Tanaka H. 1997. Elemental compositions of individual aerosol particles collected over the Southern Ocean: a case study. Atmospheric Research 43, 183–195. Publisher Full Text
- Murphy D.M., Anderson J.R., Quinn P.K., McInnes L.M., Brechtel F.J., Kreidenweis S.M., Middlebrook A.M., Posfai M., Thomson D.S. & Buseck P.R. 1998. Influence of sea-salt on aerosol radiative properties in the Southern Ocean marine boundary layer. Nature 392, 62–65. Publisher Full Text
- Nicol S., Pauly T., Bindoff N.L., Wright S., Thiele D., Hosie G.W., Strutton P.G. & Woehler E. 2000. Ocean circulation off East Antarctica affects ecosystem structure and sea-ice extent. Nature 406, 504–507. Publisher Full Text
- Norisuye K., Ezoe M., Nakatsuka S., Umetani S. & Sohrin Y. 2007. Distribution of bioactive trace metals (Fe, Co, Ni, Cu, Zn and Cd) in the Sulu Sea and its adjacent seas. Deep-Sea Research Part II 54, 14–37. Publisher Full Text
- O’Dowd C.D. & Leeuw G.D. 2007. Marine aerosol production: a review of the current knowledge. Philosophical Transactions of the Royal Society A 365, 1753–1774. Publisher Full Text
- O’Dowd C.D., Smith M.H., Consterdine I.E. & Lowe J.A. 1997. Marine aerosol, sea-salt, and the marine sulphur cycle: a short review. Atmospheric Environment 31, 73–80. Publisher Full Text
- Pacyna J.M. & Pacyna E.G. 2001. An assessment of global and regional emissions of trace metals to the atmosphere from anthropogenic sources worldwide. Environmental Reviews 9, 269–298. Publisher Full Text
- Pierce J.R. & Adams P.J. 2006. Global evaluation of CCN formation by direct emission of sea salt and growth of ultrafine sea salt. Journal of Geophysical Research—Atmospheres 111, D06203, doi: 10.1029/2005JD006186. Publisher Full Text
- Price N.M. & Morel F.M.M. 1990. Cadmium and cobalt substitution for zinc in a marine diatom. Nature 344, 658–660. Publisher Full Text
- Price N.M. & Morel F.M.M. 1991. Colimitation of phytoplankton growth by nickel and nitrogen. Limnology and Oceanography 36, 1071–1077. Publisher Full Text
- Rädlein N. & Heumann K.G. 1992. Trace analysis of heavy metals in aerosols over the Atlantic Ocean from Antarctica to Europe. International Journal of Environmental Analytical Chemistry 48, 127–150. Publisher Full Text
- Rädlein N. & Heumann K.G. 1995. Size fractionated impactor sampling of aerosol particles over the Atlantic Ocean from Europe to Antarctica as a methodology for source identification of Cd, Pb, Tl, Ni, Cr, and Fe. Fresenius’ Journal of Analytical Chemistry 352, 748–755. Publisher Full Text
- Rankin A.M. & Wolff E.W. 2003. A year-long record of size-segregated aerosol composition at Halley, Antarctica. Journal of Geophysical Research—Atmospheres 108, article no. 4775, doi: 10.1029/2003JD003993. Publisher Full Text
- Reid P.C., Fischer A.C., Lewis-Brown E., Meredith M.P., Sparrow M., Andersson A.J., Antia A., Bates N.R., Bathmann U. & Beaugrand G. 2009. Impacts of the oceans on climate change. San Diego: Elsevier.
- Sarthou G., Bucciarelli E., Chever F., Hansard S.P., González-Dávila M., Santana-Casiano J.M., Planchon F. & Speich S. 2011. Labile Fe(II) concentrations in the Atlantic sector of the Southern Ocean along a transect from the subtropical domain to the Weddell Sea Gyre. Biogeosciences 8, 2461–2479. Publisher Full Text
- Saxena V.K. & Ruggiero F.H. 2013. Aerosol measurements at Palmer Station, Antarctica. In C.R. Bentley (ed.): Contributions to Antarctic Research I. Antarctic Research Series 50. Pp. 1–5. Washington, DC: American Geophysical Union.
- Schneider B. 1985. Sources of atmospheric trace metals over the subtropical North Atlantic. Journal of Geophysical Research—Atmospheres 90, 10744–10746. Publisher Full Text
- Sedwick P.N., Bowie A.R. & Trull T.W. 2008. Dissolved iron in the Australian sector of the Southern Ocean (CLIVAR SR3 section): meridional and seasonal trends. Deep-Sea Research Part I 55, 911–925. Publisher Full Text
- Seinfeld J.H. & Pandis S.N. 2006. Atmospheric chemistry and physics. Hoboken, NJ: John Wiley.
- Smith W.O. & Comiso J.C. 2008. Influence of sea ice on primary production in the Southern Ocean: a satellite perspective. Journal of Geophysical Research—Oceans 113, C05S93, doi: 10.1029/2007JC004251.
- Tanaka T.Y. & Chiba M. 2006. A numerical study of the contributions of dust source regions to the global dust budget. Global and Planetary Change 52, 88–104. Publisher Full Text
- Taylor S.R. 1964. Abundance of chemical elements in the continental crust: a new table. Geochimica et Cosmochimica Acta 28, 1273–1285. Publisher Full Text
- Trevena A. & Jones G. 2012. DMS flux over the Antarctic sea ice zone. Marine Chemistry 134, 47–58. Publisher Full Text
- Turner J. & Thomas J.P. 1994. Summer-season mesoscale cyclones in the Bellingshausen–Weddell region of the Antarctic and links with the synoptic-scale environment. International Journal of Climatology 14, 871–894. Publisher Full Text
- Twining B.S. & Baines S.B. 2013. The trace metal composition of marine phytoplankton. Annual Review of Marine Science 5, 191–215. Publisher Full Text
- Wagenbach D., Görlach U., Moser K. & Münnich K.O. 1988. Coastal Antarctic aerosol: the seasonal pattern of its chemical composition and radionuclide content. Tellus B 40, 426–436. Publisher Full Text
- Wagenbach D., Legrand M., Fischer H., Pichlmayer F. & Wolff E.W. 1998. Atmospheric near-surface nitrate at coastal Antarctic sites. Journal of Geophysical Research—Atmospheres 103, 11007–11020. Publisher Full Text
- Weller R., Wöltjen J., Piel C., Resenberg R., Wagenbach D., König-Langlo G. & Kriews M. 2008. Seasonal variability of crustal and marine trace elements in the aerosol at Neumayer Station, Antarctica. Tellus B 60, 742–752. Publisher Full Text
- Wells M.L. 2002. Marine colloids and trace metals. In D.A. Hansell & C.A. Carlson (eds.): Biogeochemistry of marine dissolved organic matter. Pp. 367–404. Amsterdam: Elsevier.
- Whitfield M. 2001. Interactions between phytoplankton and trace metals in the ocean. In A.J. Southward et al. (eds.): Advances in Marine Biology. Vol. 41. Pp. 1–128. London: Academic Press.
- Witt M., Baker A. & Jickells T.D. 2006. Atmospheric trace metals over the Atlantic and South Indian oceans: investigation of metal concentrations and lead isotope ratios in coastal and remote marine aerosols. Atmospheric Environment 40, 5435–5451. Publisher Full Text
- Xu G., Gao Y., Lin Q., Li W. & Chen L. 2013. Characteristics of water-soluble inorganic and organic ions in aerosols over the Southern Ocean and coastal East Antarctica during austral summer. Journal of Geophysical Research—Atmospheres 118, 13303–13318. Publisher Full Text
- Yang X., Pyle J.A. & Cox R.A. 2008. Sea salt aerosol production and bromine release: role of snow on sea ice. Geophysical Research Letters 35, L16815, doi: 10.1029/2008GL034536. Publisher Full Text
- Zoller W.H., Gladney E.S. & Duce R.A. 1974. Atmospheric concentrations and sources of trace metals at the South Pole. Science 183, 198–200. Publisher Full Text
Похожие статьи
Alfred Uchman
Nils-Martin Hanken
Jesper Kresten Nielsen
Sten-Andreas Grundvåg
и другие.
Katarzyna Kozak
Krystyna Kozioł
Bartłomiej Luks
Stanisław Chmiel
и другие.
Intae Kim
Guebuem Kim
Eun Jung Choy