Эта статья опубликована под лицензией Creative Commons и не автором статьи. Поэтому если вы найдете какие-либо неточности, вы можете исправить их, обновив статью.

Performance measurement by small and medium enterprises in Cape Metropolis, South Africa


Caroline Chidinma Maduekwe
Peter Kamala
Опубликована Май 11, 2016
Последнее обновление статьи Дек. 9, 2022
Эта статья опубликована под лицензией
")


Abstract
High failure rate of small and medium enterprises (SMEs) has been partly attributed to the use of inappropriate performance measures. This study seeks to determine the types of performance measures employed by SMEs, purpose for which performance measures are used, perceived effectiveness of performance measures used and factors that may inhibit SMEs from using both financial and non-financial performance measures. Data are collected using a questionnaire and analyzed using descriptive and inferential statistics. The findings of this study reveal that most of the sampled SMEs measure their performance using both financial and non-financial performance measures, albeit financial performance measures are used more frequently than the non-financial ones. Of the financial performance measures, the most popular ones are sales growth, cash flows, operating income and net profit margin. The most popular non-financial measures are customer focused. These include response time, customers’ satisfaction, percentage of repeat customers and customers’ complaints. The findings also reveal that performance measurement reports are used by the sampled SMEs mostly for monitoring the business, gauging the performance of the business, improving business processes, identifying problems and optimizing the use of resources. The findings further reveal that the performance measures used are perceived to be effective but that the lack of awareness, qualified personnel, top management support, required resources such as computers, had, to some extent, inhibit SMEs from using the appropriate performance measures. This study not only fills in the gap in the literature on performance measurement by SMEs, but also provides invaluable insights on the extent to which these entities use different performance measures. These insights could inform future government interventions meant to avert the high failure rates of these entities and also aid SMEs to gauge their performance measurement practices with a view to adopt the best practices or avoid factors that could inhibit them from using these practices
Ключевые слова
Performance, SMEs, FMCG, financial, measures, non-financial
Introduction
The importance of small and medium enterprises (SMEs) in creating employment opportunities and in contributing to economic growth of a country has for long been acknowledged by governments and researchers alike (International Labor Organization, 2013, p. 1). Notwithstanding the importance of these entities, they have been characterized by a high failure rate, which has led researchers to question the management practices of these entities in an increasingly competitive business environment (Fatoki, 2014, p. 922). One of the practices that have been questioned is how these entities measure their performance. In fact, some researchers have partly attributed the relatively high failure rate of SMEs to the use of inappropriate performance measures (Harif, Hoe & Ahmad, 2013, p. 87; Matsotso & Benedict, 2014, p. 247). These researchers have criticized the SMEs for overreliance on financial performance measures with little to no regard for the non-financial ones, which are the real drivers of value. The over-reliance on Caroline Chidinma Maduekwe, Department of management accounting, Cape Peninsula University of Technology, South Africa.
Peter Kamala, Ph.D., Department of management accounting, Cape Peninsula University of Technology, South Africa. financial measures of performance has meant that SMEs management’s attention is directed towards the results of past actions rather than towards determinants of success (Chavan, 2009, p. 394). Given their lagging nature, financial measures only inform managers of what happened in the past, thus, do not provide any forward-looking information or indication of future performance (Kaplan Publishing, 2012, p. 1).
In addition, over-reliance on financial measures results in a scenario whereby critical decisions are made without a proper appreciation of their implications (Gijsel, 2012, p. 1). Furthermore, it does not present a broad or complete picture of the SMEs’ performance, neither does it ensure accuracy, neutrality and relevance of these measures in a dynamic business environment (Kaplan Publishing, 2012, p. 1). Financial performance measures also typically fail to relate to a business’ corporate strategy and may be counterproductive by inducing managers to maximize short-term performance at the expense of their business’ long-term effectiveness and competitiveness (Zigan & Zeglat, 2010, p. 600). Even when the ultimate goal is maximizing financial performance, financial measures may not capture long-term benefits from decisions made now (Kaplan Publishing, 2012, p. 1).
By contrast, non-financial performance measures can be better indicators of future financial performance (Gallani, Krishnan & Kajiwara, 2015, p. 6). They do so by providing the missing link between business activities and financial results by providing forward- looking information on a business performance. For instance, a performance measure on customer satisfaction may offer an indication of future cash flows that would not be captured otherwise.
Given that financial measures generally focus on annual or short-term performance against accounting yardsticks, they do not deal with progress relative to competitors, no other non-financial objectives that may be important in achieving profitability, competitive strength and longer-term strategic goals (Kaplan Publishing, 2012, p. 1). By supplementing financial measures with non-financial measures about strategic performance and implementation of strategic plans, businesses can communicate objectives and provide incentives for managers to address long-term strategy (Chartered Global Management Accountant, 2015, p. 5). Besides, financial performance measures provide little to no support to SMEs that pursue quality improvement as a strategy, because they do not map process performance and improvements as seen by the customer (Zuriekat, Salameh & Alrawashde, 2011, p. 160). What’s more, some critics have argued that drivers of success in many industries are intangible assets such as intellectual capital and customer loyalty, rather than the tangible assets contained in the balance sheets (Pangarkar & Kirkwood, 2007, p. 1). Although it is difficult to quantify intangible assets in financial terms, non-financial measures data can provide indirect, quantitative indicators of a firm’s intangible assets (Scarpati, 2014, p. 1).
Despite all the above-mentioned flaws of financial measures, evidence suggests that SMEs continue to rely only on these measures, to their peril (Ladzani, Smith & Pretorius, 2012, p. 3998). In an attempt to address the shortcomings of financial measures, researchers have advocated for a more balanced approach to performance measurement, most notably, the Balanced Scorecard approach based on which financial measures are supplemented with non-financial measures (Jackson, 2015, p. 1; Kaplan Publishing, 2012, p. 1; Madsen, 2015, p. 1). The researchers have opined that balancing the measurement of performance of a business by using both financial and non-financial measures provides a holistic view of its operations and dynamic information that enables it to establish its current performance and to continuously monitor its progress over time.
In addition, the Balanced Scorecard approach of measuring performance exposes business’s weaknesses, as well as opportunities for improvement, which are, then, used to review and clarify its objectives and priorities (Sarkissian, 2015, p. 1). As a result, a business is able to understand its internal and external contexts, which can compel it to adopt better strategies for improving its management processes, as well as its business performance in general. Besides, a Balanced Scorecard approach to performance measurement can capture non-financial indicators such as customer loyalty, employee satisfaction, internal processes and innovation, which are the real strategic drivers of value within a modem business that make its future performance predictable (Hakkak & Ghodsi, 2015, p. 302). The approach, thus, aids in identifying the key indicators that contribute to a SMEs’ success by limiting measurement to the strategic drivers that really matter (Ingalls, 2011, p. 36). By doing so, the Balanced Scorecard approach focuses the whole organization on the few key areas that are needed to create a breakthrough performance.
The Balance Scorecard approach also aids in setting goals that give appropriate weight to financial and non-financial measures (Ahmed, Bahamman & Ibrahim, 2015, p. 132). It does this by starting with the vision and strategy that drives the business (Pietrzak, Paliszkiewicz & Klepacki, 2015, p. 153). From this, it identifies the drivers of success for that vision, and, then, develops targets that measure progress towards that success. It also breaks down strategic measures to local levels, so that managers and employees can see what’s required at their level to roll into excellent performance overall (Nagarajan, 2014, p. 194). By so doing, it aids businesses to achieve their strategic objectives, as opposed to being bogged down by their daily routine.
Although performance measurement has been lengthily researched over the years in developed countries, little has been done in South Africa (Maduekwe, 2015, p. 7). For the few studies investigating performance measurement practices within companies in South Africa, they have primarily focused on large organizations (Van Staden, 2009; Brunette, 2010; Mels, 2010). Even worse, only a few of these studies have examined the use of non-financial performance measures, particularly among the SMEs (Pooe, 2007; Mabesele, 2009; Matsotso & Benedict, 2014). Therefore, there is a dearth of research on non-financial performance measurement practices of SMEs. Given the importance of the SMEs in creating jobs and in contributing to economic growth of the country, it is imperative that their performance measurement practices be investigated. This article fills the gap the prior literature by providing the answer to the following research question:
To what extent do SMEs in the Cape Metropole use financial and non-financial performance measures to manage their businesses?
1. Literature review
In general, prior studies on performance measurement by SMEs are scarce (Maduekwe, 2015, p. 19). In one such study, Ahmad (2014) who investigated performance measurement among 160 SMEs in Malaysia found that 79% of these entities had a performance measurement system, and that both financial and non-financial measures were used. Ahmad (2014) further found that the most popular financial measures used by the SMEs were sales growth (76%), operating income (75%), cash flow measure (74%), and return on investment (73%). On the other hand, the most popular non-financial measures were on-time delivery (77%) and number of customer complaints (77%). Other popular non- financial measures used by the Malaysian SMEs included employee turnover (75%), defect rate and employee absenteeism (74%), as well as manufacturing lead time, customer satisfaction survey (73%) and warranty claims (73%). The least popular non-financial measures were profitability analysis used by 60% of the sampled SMEs, stock control model used by 59%. Although insightful, Ahmad’s (2014) study was conducted in Malaysia, thus, its findings may not be generalizable to the SMEs operating in South Africa.
In yet another Malaysian study, Harif, Hoe & Ahmad (2013) investigated the use of performance measures by 27 SMEs from the agricultural sectors. Their findings revealed that the sampled SMEs preferred using financial measures as opposed to non-financial measures. Specifically, 78% of the sampled SMEs used profitability measures, 74% used cash flows, while 44% used a comparison of a financial budget to the actual financial performance. As far as the use of non-financial performance measures is concerned, Harif, Hoe & Ahmad (2013) study revealed that 63% of the SMEs used product and service quality measures, while 30% used customer satisfaction measures. Although informative, preceding study was conducted in Malaysia, an Asian country, and it employed a limited sample. Therefore, its findings cannot be generalized to South African SMEs.
Elsewhere in Asia, Hanif and Manarvi (2010) evaluated the usage of a Balanced Scorecard approach in 38 Pakistani SMEs from the manufacturing and service sectors. The researchers revealed, that despite the limited knowledge of managers on this approach, performance measurement in the SMEs was not purely financial. Indeed, manufacturing companies were more concerned about quality and productivity measures such as product functionality, product quality and the input/output ratio. By contrast, customer satisfaction as measured by percentage of repeat customers, ratings from customer surveys and handling of complaints, scored higher within the SMEs in the service sector. However, the innovation and learning perspectives of the Balanced Scorecard were ignored as new product/service development and design were not considered to be critical success factors by most SMEs. The study was, however, conducted in Pakistan, therefore, the findings may not be generalized to the South African context.
So far, all studies reviewed were conducted in Asia. In an African study conducted in Kenya, Wadongo, Odhuno, Kambona and Othuon (2010) investigated the key performance measures utilized by six five- star hotels. The researchers reported that most hotel managers highly monitored financial performance using measures such as total revenue, food and beverage sales, and total operating cost. The customer perspective of performance was also actively measured through customer satisfaction surveys, customer profitability and market share. On the contrary, little attention was being paid to the measurement of internal business processes such as resource utilization and supplier performance. Similarly, innovation and learning perspectives of the Balanced Scorecard approach were disregarded. Although enlightening, this study employed a limited sample of six hotels. Hence, its findings may neither be generalized to the Kenyan hotels nor be applicable to the South African context.
In a unique case study conducted in the South African province of Limpopo, Naude (2007) assessed the performance measurement practices of seven SMEs in the ICT sector. The researcher found that most SMEs did not measure their non-financial performance. Indeed, the sampled SMEs relied mostly on financial measures such as cash flow, gross profit, and tumover/revenue for performance measurement. Nevertheless, some SMEs had integrated measures such as customer satisfaction ratings, client service, number of orders and new businesses, which fall under the ambit of the customer and internal process perspectives of the Balanced Scorecard approach. By contrast, only one SME used employee turnover as a performance measure. Although informative, Naude’s (2007) study only focused on the ICT sector in Limpopo province of South Africa and employed a case study approach of seven SMEs. Therefore, the findings of Naude’s (2007) study may not be generalizable to SMEs in other provinces of South Africa, particularly those from other sectors.
In another South African survey, Pooe (2007) investigated the strategic performance measurement practices of 13 SMEs operating in the construction industry. The researcher established that, although financial performance measurement was the common practice, most SMEs were unwittingly using some form of the Balanced Scorecard approach. Specifically, financial measures such as profit margin and cash flow were the most preferred and more frequently used performance measures. Nevertheless, over 50% of the respondents utilized project cost variance, project duration variance, incident rate and accident rate to measure the effectiveness and efficiency of their internal processes. In addition, 70% of the respondents measured their customers’ satisfaction mostly by means of finished product satisfaction ratings. The learning and growth perspective was also implemented through training and development plans and the measurement of employee absenteeism and employee turnover. Although this study was conducted in the Western Cape, its limited sample size prevents the generalization of its findings to the entire construction industry. Besides, this study is dated as it was conducted more than eight years ago. Thus, its findings may not be applicable at present.
Given the scarcity of studies on performance measurement by SMEs and considering the gaps identified in the literature review above, it is imperative that the performance measurement practices by South African SMEs be investigated further. This study aims to fill in the gap in the literature by investigating the performance measurement practices of SMEs operating in the Fast Moving Consumer Goods (FMCG) sector in the Cape Metropolis, in South Africa.
2. Methodology
A questionnaire was employed to collect data from decision-makers of SMEs, namely owners, managers and accountants. Only descriptive statistics was employed to analyze the data collected from the questionnaire, given that the study was of an exploratory nature.
2.1. Questionnaire design. The perceptions of the decision-makers of SMEs located in the Cape Metropolis who comprised owners, managers and accountants were elicited on performance measurement practices of their businesses. A closed- ended questionnaire was designed that comprised 12 questions in five sections. The questionnaire which was in form of multiple-choice, yes/no questions and Likert scale questions was designed to be easy to answer, a strategy deployed to maximize the response rate by minimizing the time required to complete it, which ideally should have been 15 minutes.
Section one of the questionnaire elicited information on the types of performance measures used by SMEs. Section two elicited information on how frequently performance measurement reports were used for various purposes. Section three elicited respondents’ perceptions on the effectiveness of the performance measures used, while section four elicited their perceptions on factors that may inhibit their businesses from using performance measures. Section five dealt with the background of the respondents, as well that of their businesses.
Before disseminating the questionnaire, a pilot test was conducted whereby the questionnaire was completed and critically evaluated by ten academics with vast experience in designing questionnaires. The questionnaire was, then, adjusted to reflect the recommendations of the academics and, when resubmitted to them, was found to be clear and concise.
2.1. Population and sample selection. The population comprised owners, managers and accountants of SMEs operating in the FMCG sector in the Cape Metropolis as these were deemed to be the decisionmakers of SMEs who ought to be familiar with performance measurement in their entities. A target sample of 100 SMEs was set, given a lack of a comprehensive fist of all FMCG SMEs operating in the Cape Metropolis. To achieve this target, 170 respondents were approached. An accidental-sampling technique was employed to select the sample, given that it advocates the drawing of a sample from the part of the population that is conveniently accessible to the researcher (Farook, 2013, p. 1).
2.2. Questionnaire distribution. Upon completion of the pilot test, the data collection process commenced with the identification of potential respondents. The researcher visited the premises of the potential respondents, explained the purpose of the study, the research methodology employed, and ethical considerations such as anonymity of respondents, confidentiality of information divulged, as well as the limited risk in participating in this research. The potential respondents were, then, requested to indicate their willingness to participate in the study. Where the potential respondents agreed to participate, the researcher hand delivered the questionnaires to them to complete at their own convenient time. This approach gave the researcher an opportunity to explain the purpose of the study and to encourage respondents to participate with a view to increase the response rate.
2.3. Response rate and test for non-response bias. Out of the 170 respondents that were approached to participate in this survey, 100 agreed to participate in the study. Of the 98 questionnaires that were returned, six had been completed by respondents from micro enterprises and were, thus, excluded from the study as it only targeted respondents from SMEs. This left 92 usable questionnaires resulting in a response rate of 54.1%.
To minimize the effect of a non-response bias, diverse respondents that ranged from owners, managers and accountants, male and female, from different industries were approached and encouraged to participate in the survey. In addition, the profile of the respondents, as well as that of their businesses was analyzed and found to indicate that respondents of different persuasions had answered the questionnaire (De Villiers & Van Staden, 2010). Furthermore, respondents were persuaded to participate in the survey using the face to face approach even if they had little interest in performance measurement (De Villiers & Van Staden, 2010). Given the diverse respondents approached and a high response rate, the risk for nonresponse bias was mitigated.
3. Results and discussions
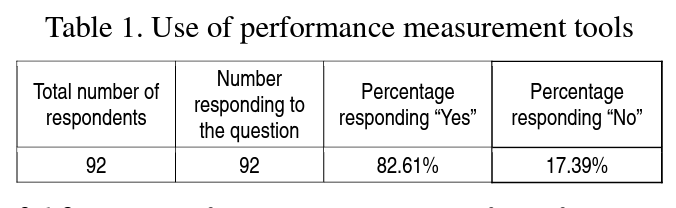
3.1. Performance measurement reports and types of performance measures used. 3.1.1 Whether a respondent’s business prepares performance measurement reports. Respondents were asked to indicate by way of yes or no question whether their SMEs prepare performance measurement reports. As summarized in Table 1, 82.61% of the respondents indicated that their businesses prepare performance measurement reports, while 17.39% indicated that their businesses did not do the same.
The above results are consistent with those of Abdel-Kader & Luther (2006), Ahmad (2012), Waweru and Spraakman (2012), and Naude (2007) who found that most businesses prepared and used performance measurement reports.
3.1.2. How often various types of performance measures are used. Respondents that had indicated that their businesses prepared performance measurement reports were required to specify how often their businesses had used two types of performance measures, namely, financial performance measures and non-financial performance measures. The financial performance measures included sales growth, cash flows, operating income, net profit margin and return on investment. The non-financial performance measures included customers’ complaints, employees’ turnover rate, percentage of repeat customers, growth in market share, percentage of returned products, average hours of employees’ training, employees’ absenteeism rate, job satisfaction survey, staff competency rate and response time to customers. A five-point Likert scale was used with weightings of one for never, two for rarely, three for sometimes, four for frequently, and five for very frequently. Therefore, the closer the mean was to five, the more often a performance measurement tool was used.
As summarized in Table 2, financial performance measures were more frequently used than non- financial performance measures. Among the financial measures investigated, sales growth (85.14%) was the most frequently used measure of performance, followed by cash flows (85.13%), then, operating income (79.73%) and net profit margin (79.73%). The least frequently used financial performance measure was return on investment (52.70%). The above results of the current study are consistent with the findings of Ahmad (2014), Harif et al. (2013), Hanif and Manarvi (2010) who observed that SMEs preferred and frequently used financial measures.
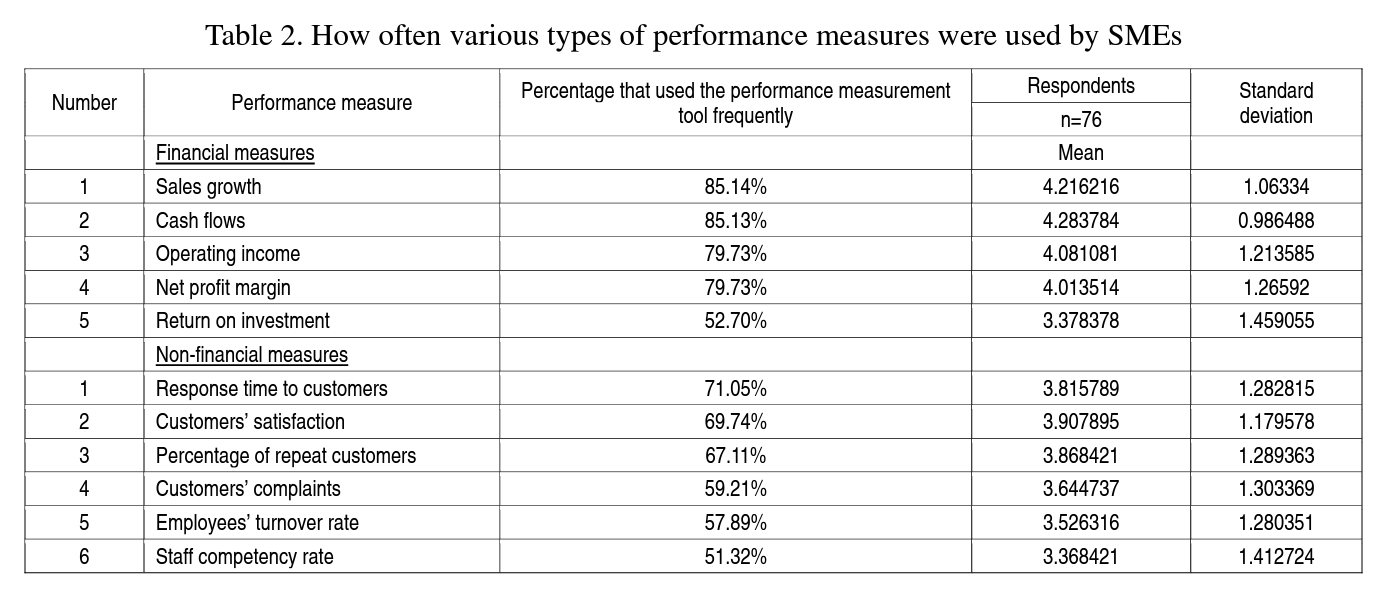
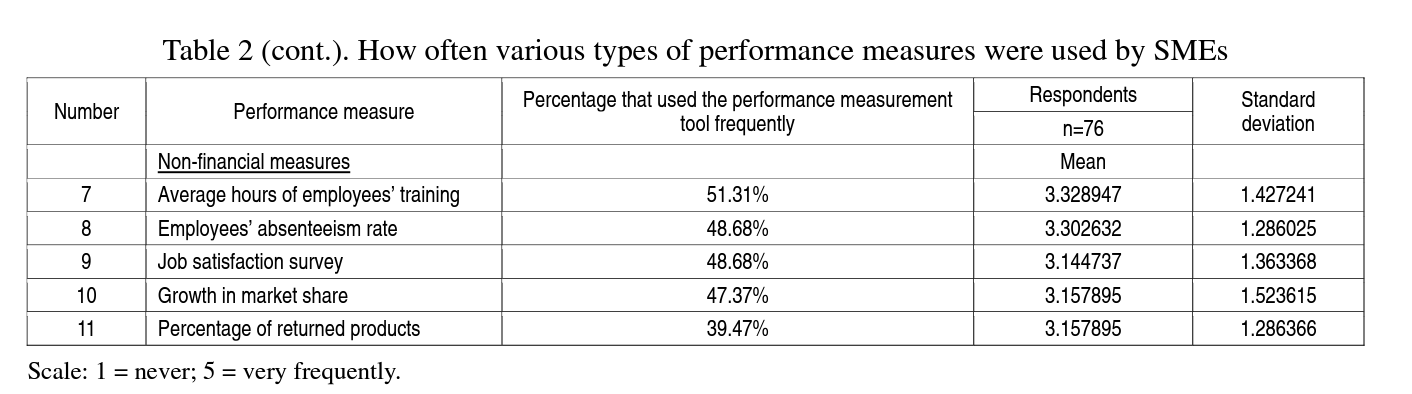
With regard to non-financial performance measures, the results of the current study revealed that response time to customers (71.05%) was the most frequently used measure followed by customers’ satisfaction (69.74%), and, then, the percentage of repeat customers (67.11%). The fourth most frequently used non-financial performance measure was customers’ complaints (59.21%), followed by employees’ turnover rate (57.89%), then, staff competency rate (51.32%) and average hours of employees’ training (51.31%).
The other lesser frequently used non-financial performance measures were employees’ absenteeism rate (48.68%), job satisfaction survey (48.68%), growth in market share (47.37%) and percentage of returned products (39.47%).
It is interesting to note that response time to customers (a non-financial performance measure) was more frequently used than return on investment (a financial performance measure). The frequent usage of customer related non-financial performance measures is, perhaps, a reflection of the increasing customer focus that organizations are increasingly prioritizing in order to obtain and maintain a competitive advantage. The immediately preceding results of the current study concur with those of Ahmad (2014), Abdel-Kader and Luther (2006) who found that measures related to customers were the most frequently used non- financial performance measures and that employee job satisfaction rate was among the least frequently used non-financial performance measures.
3.2. How often performance measurement reports are used for various purposes. Respondents that had indicated that their businesses prepare performance measurement reports were also asked to indicate how often their businesses used the reports for various purposes, summarized in Table 3. The purposes include for: future planning, control purposes, monitoring the business, measuring performance, motivating employees, improving communication, developing tactical strategies, problem identification, improving decision-making, optimizing the usage of resources and for the improvement of their business processes. A five- point Likert scale was used with weightings of one for never, two for rarely, three for sometimes, four for frequently, and five for very frequently. Therefore, the closer the mean was to five, the more frequently the performance measurement reports were used for a particular purpose.
The percentages of those who indicated that their business used performance measurement reports for a particular purpose either frequently or very frequently were added up together, and reported as “percentage that used performance measurement reports for this particular purpose frequently” in the third column of Table 3. In essence, therefore, those who indicated that their business used performance measurement reports for a particular purpose sometimes or rarely were conservatively reported as having indicated that their business did not use the report for the stated purpose, as the words “sometimes” and “rarely” suggest infrequent to almost non-usage of a performance measurement report for the given purpose. This approach is justified, because it ensures that only those whose businesses frequently use performance measurement reports for a particular purpose are reported as such, and it has also been used in prior studies (see De Villiers & Van Staden, 2010).
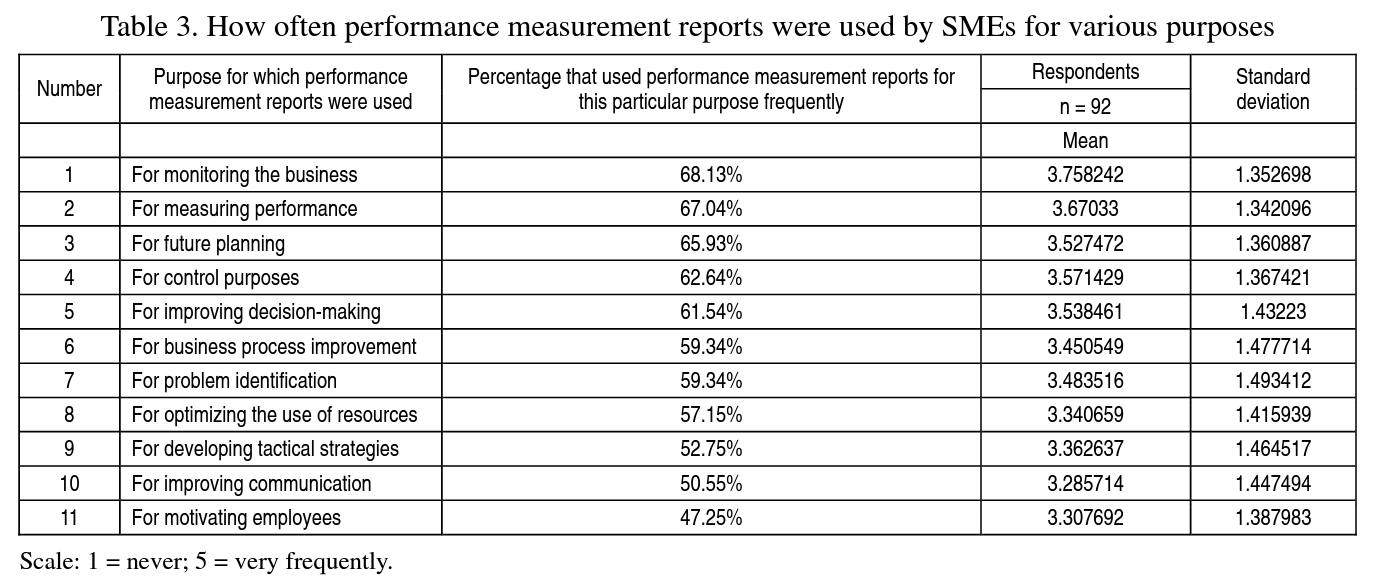
As summarized in Table 3, performance measurement reports were most frequently used for monitoring the business (68.13%), followed by measuring performance (67.04%), then, future planning (65.93%). The fourth most frequent purpose for which performance measurement reports were used was for controlling purposes (62.64%), followed by improving decision-making (61.54%), then, problem identification (59.34%) and business process improvement (59.34%). Other purposes for which performance measurement reports were used by order of frequency include for optimizing the use of resources accounted (57.15%), for developing tactical strategies (52.75%) and for improving communication (50.55%). The least frequent purpose for which the reports were used was for motivating employees (47.25%). The mean value of the above results also corroborated the above results, while the standard deviation of more than one suggests a disagreement among respondents with regard to the purpose for which the reports are used. The above results are consistent with those of Alleyne and Marshall (2011), Abdel-Kader and Luther (2006), and those of Ahmad (2012).
3.3. Perceived effectiveness of performance measures used. Respondents that had indicated that their businesses prepare performance measurement reports were asked to indicate how effective the performance measures included in the reports were for the purpose which they were used. A five-point Likert scale was used with weightings of one for very ineffective, two for ineffective, three for neutral, four for effective and five for very effective. The percentages of the respondents who perceived the reports to be either effective or very effective were added up together and reported as “percentage that perceive performance measures to be effective” in the third column of Table 4.
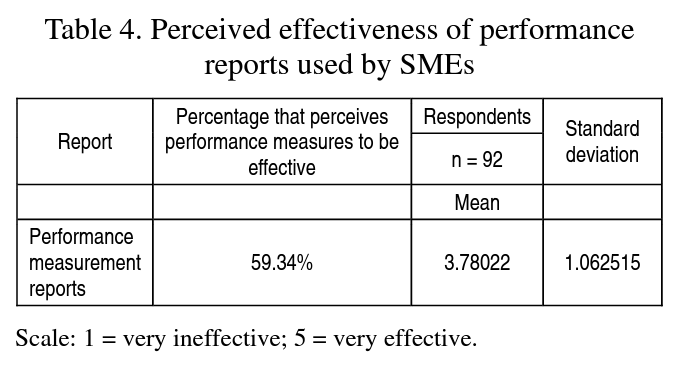
In essence, therefore, those who were neutral with regard to their perceived effectiveness of the performance measures used were conservatively reported as having perceived the measures to be ineffective, as the word neutral suggests a lack of certainty with regard to the effectiveness of the performance measures. This approach is justified, because it ensures that only those who perceived the performance measures to be effective are reported as such. A similar approach has also been used in prior studies (see De Villiers & Van Staden, 2010).
As illustrated in Table 4, 59.34% of the respondents perceived the performance measures used by their entities to be effective, while 40.66% did not. These results were affirmed by the mean value (3.78022), however, the standard deviation of above one suggests a disagreement among the respondents’ perceived effectiveness of performance measures used. The foregoing results concur with those of Alleyne and Marshall (2011) who found that Barbadian companies perceived the performance measures they used to be very effective. In addition, the current study’s results agree with those of Abogun and Fagbemi (2011) who revealed that performance measures used by SMEs were effective for the purpose of planning and controlling.
3.4. Factors that inhibit SMEs from measuring their performance in a balanced manner. Respondents were asked to indicate the extent to which they agreed with four statements about factors that inhibit SMEs from using both financial and non- financial measures for measuring performance. The statements included a lack of required resources such as computers, a lack of top management support, a lack of qualified personnel and a lack of expertise on how to measure performance. A five-point Likert scale was used with weightings of one for strongly disagree, two for disagree, three for neither agree nor disagree, four for agree and five for strongly agree.
The percentages of the respondents who either agreed or strongly agreed to a particular statement were added up together, and reported as “percentage that agreed with the statement” in the third column of Table 5. In essence, therefore, those who neither agreed nor disagreed to a statement were conservatively reported as having disagreed with the statement; as the words neither agree nor disagree suggest a reservation to agree with a statement. This approach is justified, because it ensures that only those who agreed with a particular statement on factors that inhibit SMEs from measuring their performance in a balanced manner are reported as such, and it has also been used in prior studies (see De Villiers & Van Staden, 2010).
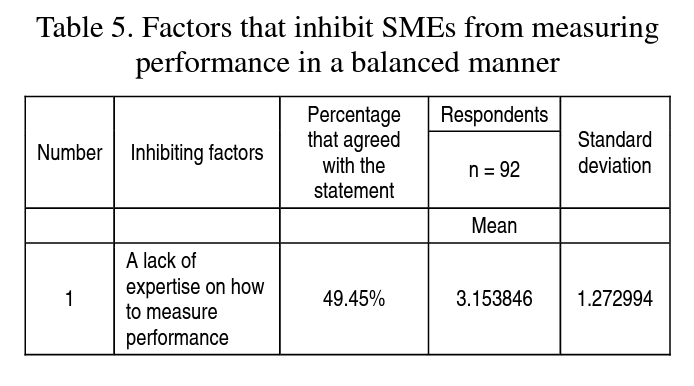
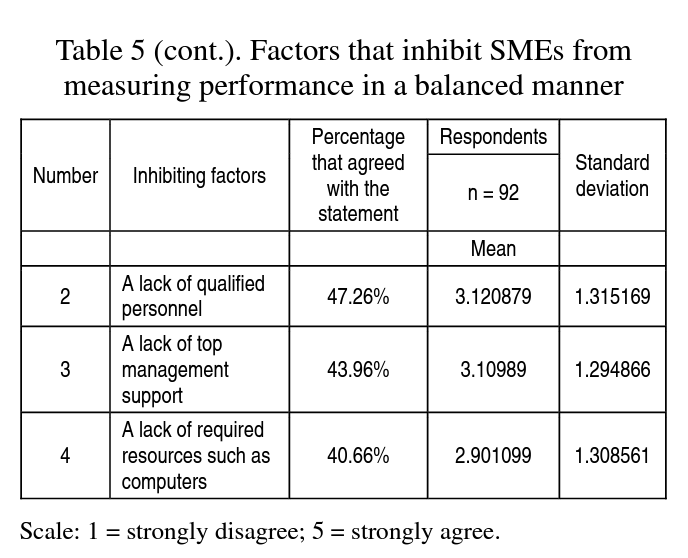
As summarized in Table 5, most respondents cited a lack of awareness (49.45%) as an inhibiting factor, followed by a lack of qualified personnel (47.26%), then, a lack of top management support (43.96%), and a lack of required resources such as computers (40.66%). These results were also corroborated by the mean values. The standard deviation of more than one on all factors indicates that the respondents were in disagreement about the factors that inhibit SMEs from using both financial and non-financial measures. The above results are inconsistent with those of Al Smirat (2013) who found that a lack of resources was a key inhibiting factor to the use of balanced performance measures. The difference could be attributed to the fact that Al Smirat’s (2013) study was conducted in Jordan and, thus, the factors inhibiting SMEs from measuring performance in that country could be different to those inhibiting South African SMEs, given the vast support that South African SMEs get from the government.
3.5 Respondents’ person and their businesses’ profile. Of the respondents, 63.33% were managers, 27.78% were owners, while 8.89% were accountants (see Table 6). About 37.78% of the respondents had one to five years’ experience in their positions, 37.78% had six to ten years’ experience, while 22.22% had more than ten years’ experience. Only 2.22% had less than a year of experience (see Table 6). Thus, 60% of the respondents had more than six years of experience in their respective positions and were, thus, expected to be knowledgeable about performance measurement in their businesses.
With respect to respondents’ highest level of education, the analysis of the results indicated that 25.27% of the respondents had a Bachelor degree (see Table 6). Similarly, 25.27% of the respondents had a matric qualification, while 23.08% had a diploma. Of the respondents, 18.68% had attended some short courses, while 6.60% had a Master degree. Only 1.10% had other qualifications. Accordingly, most of the respondents had some form of academic qualification.
Concerning whether the respondents’ highest level of education was accounting related, the analysis of the results indicated that 45.56% of respondents’ highest level of education was accounting related, while 54.44% of the respondents’ highest level of education was not (see Table 6). Although a majority of the respondents’ highest level of education was not accounting related, quite a significant percentage had been exposed to accounting and, thus, should have been familiar with how performance measurement was done in their businesses.
As far as the respondents’ business industry is concerned, the results indicated that 51.65% of the respondents’ businesses operated in the food and beverage industry, while 20.88% of the respondents’ businesses operated in other unspecified FMCG industries (see Table 6). Of the respondents’ businesses, 10.99% operated in the household accessories industry, while 8.79% operated in the pharmaceutical industry. Only 7.69% of the respondents’ businesses operated in the cosmetics industry. The above results confirmed that the sampled respondents were from the FMCG sector and, thus, were the appropriate participants for this survey.
In relation to the number of employees of the respondents’ businesses, 32.61% of the respondents indicated that their businesses had six to ten employees, while 28.26% indicated that then- businesses had 11 to 20 employees. Of the respondents, 22.83% indicated that their businesses had 21 to 50 employees, while 16.30% indicated that their businesses had 51 to 100 employees. Therefore, 83.69% of the respondents were from small enterprises (with less than 50, but more than five employees), whereas 16.30% of the respondents were from medium enterprises (with 51 to 100 employees). Accordingly, the respondents included in this study were all from SMEs which were the enterprises targeted by this study.
Summary and conclusion
The problem that this paper sought to investigate was that the failure rate of SMEs can be partly attributed to their use of inappropriate performance measures, namely, financial measures as opposed to the non- financial ones. The results of this study show that most of these entities used both financial and non-financial performance measures, however, financial performance measures were used more frequently than the non-financial ones. Of the financial performance measures, the most popular ones were sales growth, cash flows, operating income and net profit margin. The most popular non-financial measures were mostly customer focused. These included response time, customer’ satisfaction, percentage of repeat customers and customers’ complaints.
The results also show that performance measurement reports were used by the sampled SMEs mostly for monitoring business performance, gauging the performance, improving business processes, identifying problems and optimizing on the use of resources. The results further revealed that the performance measures used were perceived to be effective, but that the lack of awareness, qualified personnel, top management support, required resources such as computers had, to some extent, inhibited SMEs from using the appropriate performance measures.
The above results have implications for decisionmakers of SMEs as they will be made aware of the various types of performance measures that are being used by other SMEs. The decision-makers will also be enlightened on various uses of performance measures, the perceived effectiveness of performance measures used and the factors that inhibit SMEs from using these measures. This information should not only enhance their buy-in on the importance of a balanced approach to measuring performance, but also should enable them to evaluate their own use of both financial and non- financial performance measures, in order to decide whether to improve, change or continue with their current practice. The South African government, whose initiatives to promote SMEs are widely perceived to be ineffective, may also draw on the findings of this research to inform its future intervention strategies, particularly relating to developing expertise on how to measure performance using a Balanced approach to performance measurement. This could be done via training meant to impart skills on both financial and non-financial performance measurement, with a view to increase the uptake of both, which should enhance the survival rate of SMEs.
References
- Abdel-Kader, M. & Luther, R. (2006). Management Accounting Practices in the British Food and Drinks Industry, British Food Journal, 108 (5), pp. 336-357.
- Abogun, S. & Fagbemi, T O. (2012). The Efficacy of Budgeting as a Control Measure in Developing Economies: A Study from Nigeria, Asian Social Science, 8 (1), pp. 176-182.
- Ahmad, K. (2014). The adoption of Management accounting practices in Malaysian Small and Medium-sized Enterprises, Asian Social Science, 10 (2), pp. 236-249.
- Ahmad, K. (2012). The use of management accounting practices in Malaysian SMEs. Unpublished Doctor of Philosophy thesis, Exeter, University of Exeter.
- Ahmed, A.D., Bahamman, S.M. & Ibrahim, M. (2015). Assessment of the non-financial measures of performance of deposit money banks in Nigeria, Journal of Accounting and Taxation, 7 (8), pp. 131-136.
- Alleyne, P. & Marshall, D.W. (2011). An exploratory study of management accounting practices in manufacturing companies in Barbados, International Journal of Business and Social Science, 2 (9), pp. 49-58.
- Al Smirat, B.Y. (2013). The Use of Accounting Information by Small and Medium Enterprises in South district of Jordan, A research of Finance and accounting, 4 (6), pp. 169-175.
- Brunette, Z. (2010). Balanced Scorecard development of a strategic business unit. Unpublished MBA Dissertation. North-West University.
- Chartered Global Management Accountant. (2015). KPIs - financial and non-financial. Available at: http://www.cgma.org/resources/tools/essential-tools/pages/kpis.aspx. Accessed on 12 December 2015.
- Chavan, M. (2009). The balanced scorecard: a new challenge, Journal of Management Development, 28 (5), pp. 393-406.
- De Villiers C.J., Van Staden, C.J. (2010). Shareholders’ corporate environmental disclosure need, South African Journal of Economic and Management Sciences, 13 (4), pp. 436-445.
- Farook, U. (2013). Definition and types of non-probability sampling. Available at: http://www.studylecturenotes.com/social-research-methodology/definition-types-of-non-probability-sampling. Accessed on 13 November 2015.
- Fatoki, O. (2014). The Causes of the Failure of New Small and Medium Enterprises in South Africa, Mediterranean Journal of Social Sciences, 5 (20), pp. 922-927.
- Gallani, S., Krishnan, R. & Kajiwara, T. (2015). Is Mandatory Nonfinancial Performance Measurement Beneficial? Available at: http://www.hbs.edu/faculty/Publication%20Files/16-018_c6277204-f5ba-4fac-bef9- 15791ece301c.pdf. Accessed on 12 December 2015.
- Gijsel, P.V. (2012). The importance of non-financial performance measures during the economic crisis. Masters Thesis, Unpublished. Tilburg Netherlands: Tilburg University.
- Hanif, A. & Manarvi, LA. (2010). Investigating the implementation of Balanced Scorecard in Pakistani small enterprises. Presented at the International Conference on Advanced Management Sciences, 9-11 July 2012, Chendu.
- Harif, M.M., Hoe, C.H. & Ahmad, M I. (2013). The Financial and Non-Financial Performance Indicators of Paddy Farmers’ Organizations in Kedah, World Review of Business Research, 3 (I), pp. 80-102.
- Ingalls, P. (2011). Using the Balanced Scorecard and Key Performance Indicators to Drive Your Business. Available at: http://www.leanexpertise.com/MTL/MGT_Scorecard_02.pdf. Accessed on 13 December 2015.
- International Labor Organization. (2013). Is small still beautiful? Available at: http://www.ilo.org/global /aboutthe-ilo/newsroom/comment-analysis/WCMS_218252/lang--en/index.htm. Accessed on 12 December 2015
- Jackson, T. (2015). 10 Companies Using The Balanced Scorecard (& Why). Available at: https://www.clearpointstrategy.com/companies-using-the-balanced-scorecard/. Accessed on 13 December 2015.
- Hakkak, M. & Ghodsi, M. (2015). Development of a Sustainable Competitive Advantage Model Based On Balanced Scorecard, International Journal of Asian Social Science, 5 (5), pp. 298-308.
- Kaplan Publishing. (2012). Kaplan Financial Knowledge Bank. Available at; http://kfknowledgebank.kaplan.co.uk/KFKB/Wiki%20Pages/NonFinancial%20Performance%20Indicators%20%2 8NFPIs%29.aspx. Accessed on 12 December 2015.
- Ladzani, W., Smith, N. & Pretorias, L. (2012). Using leadership and strategic planning functions to improve management performance: the progress made by small, medium and micro enterprises (SMMEs) in the province of Gauteng, South Africa, African Journal of Business Management, 6 (11), рр. 3988-3999.
- Mabesele, L. (2009). The role of performance measures in the fast food franchisee industry to sustain positive growth: Cape Metropole - South Africa. Unpublished Masters Thesis, Cape Peninsula University of Technology.
- Madsen, D O. (2015). The Balanced Scorecard in the Context of SMEs: A Literature Review. Available at: http://papers.ssm.com/sol3/papers.cfm7abstraeOd-2673096. Accessed on 12 December 2015.
- Maduekwe, C O. (2015). The usage of management accounting tools by small and medium enterprises in Cape Metropole, South Africa. Masters Thesis, Unpublished. Cape Town: Cape Peninsula University of Technology.
- Matsotso, M.L. & Benedict, H.O. (2014). Non-Financial Performance Measures in Small Medium Enterprises’ Supply Chain Management, Journal of Economics, 5 (3), pp. 247-257.
- Mels, J.J. (2010). Designing a Balanced Scorecard for a mining supply company. Unpublished MBA Dissertation, North-West University.
- Nagarajan, S. (2014). Balanced Scorecard framework for knowledge management solution implementation. Available at: http://shodhganga.inflibnet.ac.in/bitstream/10603/25319/13/13_chapter8.pdf. Accessed on 13 December 2015.
- Naude, D. (2007). The degree of organizational performance measurement in SMEs - A focus on ICT enterprises. Available at: http://uir.unisa.ac.za/xmlui/bitstream/handle/10500/106/2007%20MBL%203%20Research%20Report%20D%20Naude.pdf?sequence=l. Accessed on 06/12/2013.
- Pangarkar, A.M. & Kirkwood, T. (2007). New Accountabilities: Non-Financial Measures of Performance. Available at: http://www.talentmgt.com/articles/print/new_accountabilities_nonfinancial_measures_of_performance. Accessed on 12 December 2015.
- Pietrzak, M, Paliszkiewicz, J. & Klepacki, B. (2015). The application of the balanced scorecard (BSC) in the higher education setting of a Polish university, Online Journal of Applied Knowledge Management, 3 (1), pp. 151-164.
- Pooe, M. (2007). The development of a strategic performance measurement tool for SMEs in the construction industry. Unpublished MBA Dissertation, Nelson Mandela Metropolitan University.
- Sarkissian, A. (2015). Advantages of a Balanced Scorecard. Available at: http://smallbusiness.chron.com/advantages-balanced-scorecard-59821.html. Accessed on 13 December 2015.
- Scarpati, P. (2014). Non-Financial rewards. Available at: http://documents.mx/documents/non-financial-rewards.html. Accessed on 12 December 2015.
- Van Staden, A. (2009). The Balanced scorecard as a performance measurement and personal development tool in a steel organization. Unpublished MBA Dissertation, North-West University.
- Wadongo, B., Odhuno, E., Kambona, O. & Othuon, L. (2010). Key performance indicators in the Kenyan hospitality industry: a managerial perspective. Benchmarking, An International Journal, 17 (6), pp. 858-875.
- Waweru, N. & Spraakman, G. (2012). The use of performance measures: case studies from the microfinance sector in Kenya, Qualitative Research in Accounting & Management, 9 (1), pp. 44-65.
- Zigan, K. & Zeglat, D. (2010). Intangible resources in performance measurement systems of the hotel industry, Facilities, 28 (13-14), pp. 597-610.
- Zuriekat, M. Salameh, R. & Alrawashdeh, S. (2011). Participation in Performance Measurement Systems and Level of Satisfaction, International Journal of Business and Social Science, 2 (8), pp. 159-169.
Похожие статьи
Adekunle Oluwole Binuyo
Rafiu Adewale Aregbeshola
Thea Visser
Evelyn Chiloane-Tsoka
Linh Chi Vo
Pietro Gottardo
Anna Maria Moisello
Michael C. Cant
Johannes A. Wiid