This article is published under a Creative Commons license and not by the author of the article. So if you find any inaccuracies, you can correct them by updating the article.

Arctic plants are capable of sustained responses to long-term warming


Robert T. Barrett
Robert D. Hollister
Published: May 5, 2016
Latest article update: Aug. 13, 2023
This article is published under the license


Abstract
Previous studies have shown that Arctic plants typically respond to warming with increased growth and reproductive effort and accelerated phenology, and that the magnitude of these responses is likely to change over time. We investigated the effects of long-term experimental warming on plant growth (leaf length) and reproduction (inflorescence height, reproductive phenology and reproductive effort) using 17–19 years of measurements collected as part of the International Tundra Experiment (ITEX) at sites near Barrow and Atqasuk, Alaska. During the study period, linear regressions indicated non-significant tendencies towards warming air temperatures at our study sites. Results of our meta-analyses on the effect size of experimental warming (calculated as Hedges’ d) indicated species generally responded to warming by increasing inflorescence height, increasing leaf length and flowering earlier, while reproductive effort did not respond consistently. Using weighted least-squares regressions on effect sizes, we found a significant trend towards dampened response to experimental warming over time for reproductive phenology. This tendency was consistent, though non-significant, across all traits. A separate analysis revealed significant trends towards reduced responses to experimental warming during warmer summers for all traits. We therefore propose that tendencies towards dampened plant responses to experimental warming over time are the result of regional warming. These results show that Arctic plants are capable of sustained responses to warming over long periods of time but also suggest that, as the region continues to warm, factors such as nutrient availability, competition and herbivory will become more limiting to plant growth and reproduction than temperature.
Keywords
Meta-analysis, plant–climate interactions, Species traits, tundra vegetation, International Tundra Experiment, warming response
In assessing the impacts of climate change on plant species, one factor that remains unclear is how long the response of plants to warming can be maintained. Although ambient temperatures in the Arctic are typically lower than those optimal for photosynthesis in tundra species, it has been assumed that Arctic ecotypes are poorly equipped to respond to long-term warming as a result of their metabolic and photosynthetic adaptations to life in cold climates (Billings & Mooney 1968; Bliss 1971; Chapin & Chapin 1981; Chapin & Shaver 1985a). This idea has been supported by transplant studies, which indicated that tundra species are likely to have difficulty surviving, growing and reproducing in significantly warmer conditions (Chapin & Chapin 1981; Shaver & Kummerow 1992; Bennington et al. 2012). Hence, a prevailing thought has been that, when subjected to warmer temperatures, Arctic plants would exhibit short-term gains in growth and reproduction, followed by a diminished response as the plants exhausted their below-ground carbohydrate and nutrient stores (Shaver & Kummerow 1992; Chapin et al. 1995; Shaver & Jonasson 1999). Previous studies have seemingly supported this hypothesis as initial plant responses to warming decreased after a few years of exposure to experimental warming (Chapin & Chapin 1981; Arft et al. 1999). However, this line of thought is not supported by long-term field studies that have shown that Arctic plants continue to respond to warming after two decades of consistent exposure (Hudson & Henry 2009; Hudson et al. 2011; Elmendorf et al. 2012). While more studies have focused on how long-term warming affects Arctic plant community composition (Elmendorf et al. 2012; Hedenås et al. 2012; Michelsen et al. 2012), less attention has been given to the how growth, reproduction and phenological responses of individual species are affected by long-term warming (Hudson et al. 2011; Klady et al. 2011; Campioli et al. 2013).
To better understand how plant trait responses to warming change over time, we examined the responses of Arctic plants to 17–19 years of experimental warming using four study sites that are part of ITEX. Data from these sites have been used in previous analyses examining short-term community and species-level responses to warming (Hollister, Webber & Bay 2005; Hollister, Webber & Tweedie 2005; Oberbauer et al. 2007), and in more recent studies examining longer term responses of tundra plants to temperature (Elmendorf et al. 2012; Oberbauer et al. 2013). By examining findings from these long-term research sites, we sought to answer the following questions: (1) How did plants at these sites respond to long-term experimental warming and are responses comparable to those found in other studies? (2) How did responses to experimental warming vary over time and with respect to summer temperature?
Materials and methods
Study sites and experimental design
This study took place at field sites near Barrow and Atqasuk, Alaska. We collected data at two sites at each location—one in dry heath tundra and the other in wet meadow tundra. The BD and BW sites were established in 1994 and 1995, respectively, while the AD and AW sites were established in 1996. For this analysis, we used plant trait data from the following years: 1994–2001, 2007–08 and 2010–12. Each site included 48 permanently established plots of vegetation (ca. 1 m2), half of which were randomly assigned to be experimentally warmed using open-top chambers. For comprehensive details on these sites, see Hollister (2003).
Temperature measures
We collected temperatures at each site using sensors—Model 107 Temperature Probe (Campbell Scientific), HOBO Temperature Logger (Onset Computer Corporation) or StowAway Temperature Logger (Onset Computer Corporation)—placed in six-plate radiation shields at 10–15 cm above ground surface. Readings were taken every 10–60 min, then averaged and recorded every hour (Campbell Scientific CR10X Datalogger, HOBO or StowAway Temperature Logger). As noted above, we used a number of different sensors to measure canopy height temperature in a plot. In 1998, data loggers were installed at the sites which measured screen and canopy height temperature as well as a host of other metrics. Prior to 1998, screen height temperatures were estimated from weather stations located within 3 km of the sites. Snowmelt dates were determined through visual confirmation or, when researchers were not present for this event, using the day of year that the average soil surface temperatures remained above 0°C at the site. Soil temperature at each site was measured with probes reported elsewhere (Hollister et al. 2006). In cases where temperature readings were not available because of instrument malfunction, readings from the paired site or the nearby weather station were substituted (Hollister et al. 2006). These cases were less than 5% of all readings. The resulting hourly temperature readings for the site were used to calculate TDD by summing average temperatures above 0°C daily from first snow-free date until August 15.
Plant traits
This study was designed to examine traits of many species over many years. Therefore, only a few plant traits were monitored annually based on the comparability across species and the ease of measuring consistently. Traits were chosen from those which other researchers agreed to collect using a common protocol for ITEX study sites (Molau 1993; Arft et al. 1999). The following traits were examined: inflorescence height, leaf length, reproductive effort and reproductive phenology. Inflorescence height was measured as distance from ground to the tip of the inflorescence in forbs and graminoids and as the length from inflorescence base to tip in shrubs. Leaf lengths were measured as the length from the base of a plant to the tip of its longest leaf in graminoids and forbs, except Potentilla hyparctica and Stellaria laeta, for which leaf length was described as the distance from the base to the tip of the longest leaf. This same method was used for shrubs, except Cassiope tetragona, for which annual growth increments were used as leaf length. For both traits, we used the average maximum size of an individual based on one to six individuals per plot, depending on abundance (we monitored up to three marked individuals per plot and to ensure that we recorded reproductive traits we measured the three largest flowering individuals per plot). We defined reproductive effort as either the number of flowers or number of inflorescences produced by a species in a given plot, depending on the morphology of the species. Similarly, reproductive phenology was defined as either the first day of year an inflorescence appeared or first day of year anthesis or stigma activation was observed in a plot. Plants were monitored for each trait multiple times per week in each plot, with the exception of plots during 2001 when only 10 plots of each treatment could be observed owing to logistical constraints. Detailed information on the plant trait measured for each species is provided in Hollister (2003).
Statistical analyses
We used simple linear regressions performed in R to investigate the possible trends in ambient summer temperatures, represented as TDD, at each study site over time (R Development Core Team 2005).
Not all measurements were made each year on each plant species and only a few species were abundant across a site. Thus, analysis was constrained to species for which a given trait was measured in at least five plots per treatment during a given year and met this criterion for at least five years during the study period (see Supplementary Table S1 for mean, SD and sample size of all plant traits included in the analysis organized by trait, site, species and year). Response to experimental warming was determined for each species and trait using effect sizes calculated as Hedges’ d, which is the difference between the averages of the control () and warmed () traits for each species divided by their pooled SD (S) and multiplied by a term to correct for small sample size. This test statistic is found as
where ne and nc are the sample sizes of the control and warmed plants, respectively. This method treated each species, trait and year as an individual study. The studies were then also pooled by site and growth form within a site. Performing analyses this way allowed us to directly compare our findings to those of similar studies (Arft et al. 1999; Rosenberg et al. 2000; Dormann & Woodin 2002). We performed two additional analyses; one to assess whether effect sizes of experimental warming were changing over time and another to discern if there was a relationship between effect sizes of experimental warming and summer temperature. Both analyses were performed using effect sizes calculated as Hedges’ d as described above, but here the average plant trait values for each study site and year were treated as an individual study (thus the sample size for each point was the number of species that occurred at the site). We then used weighted least-squares regressions to assess trends in effect sizes for each site over time and with respect to summer temperatures (TDD). Metawin version 2.1 was used for these analyses (Rosenberg et al. 2000). Effect sizes were considered significant when their 95% confidence interval did not overlap with an effect size of zero.
Results
Temperature measurements
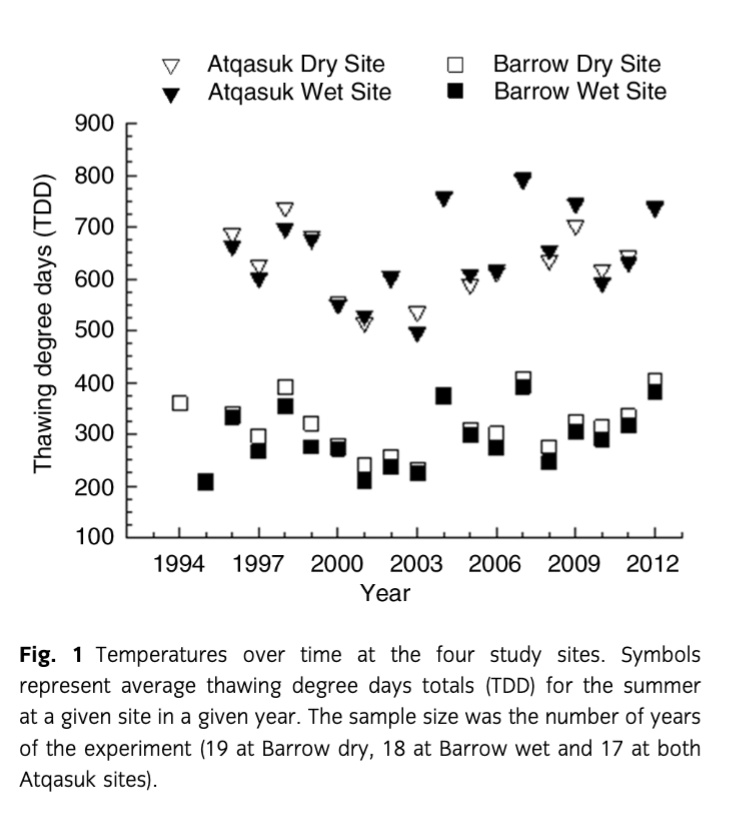
During the time of this study, temperatures in control plots showed non-significant warming tendencies over time at all four sites (Fig. 1; AD P=0.50, AW P=0.28, BD P=0.31, BW P=0.15). The chambers warmed the plots on average for the summer between 0.4 and 2.2°C depending on the site and year (see Supplementary Table S2).
Plant responses to long-term experimental warming
Species generally responded to experimental warming with increased inflorescence heights, earlier reproductive phenology and increased leaf lengths, but responses of reproductive effort were not consistent (Supplementary Table S3). When experimentally warmed, 79% of the species grew taller inflorescences and 51% grew longer leaves. Fewer species responded to experimental warming with a change in reproductive phenology (35%), but significant responders always flowered earlier when warmed. Even fewer species (29%) showed a significant response to experimental warming with respect to reproductive effort, and roughly equal numbers of species had increased or decreased reproductive efforts when warmed.
Variation in response to experimental warming over time and with summer temperature
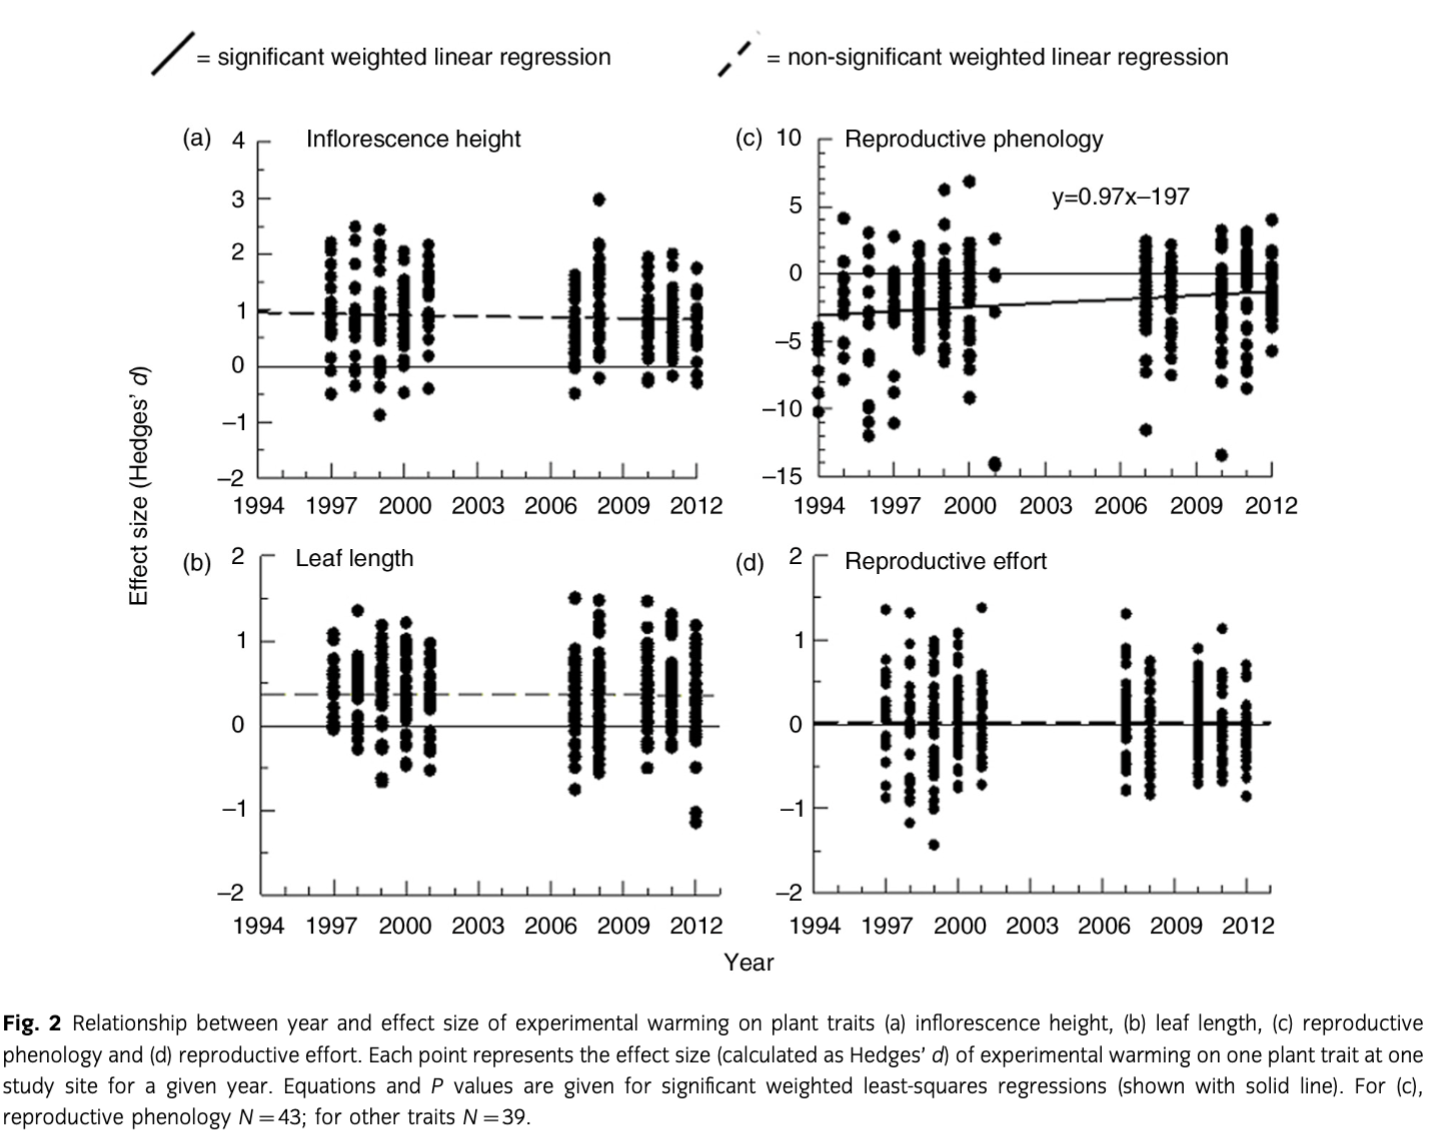
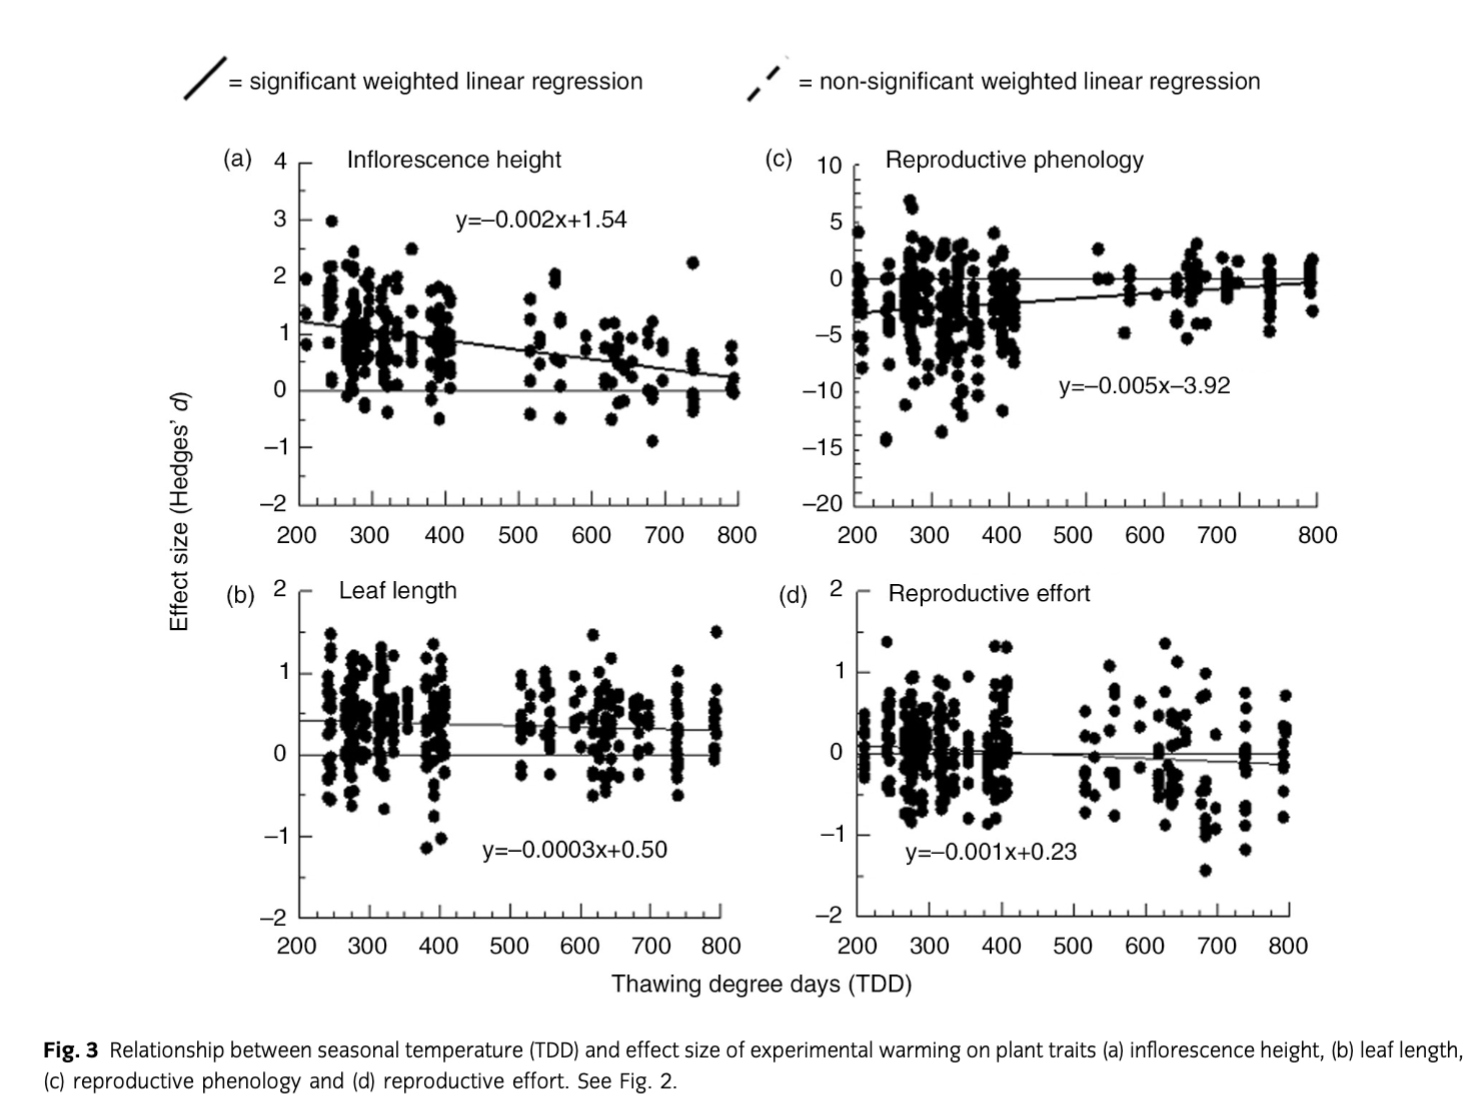
Plant responses to experimental warming were mostly consistent, with the exception of reproductive phenology, which showed a significant (P=0.03) trend towards decreasing effect sizes over time (Fig. 2c). However, we also note that inflorescence height, leaf length and reproductive effort each showed non-significant tendencies towards reduced effect sizes over time (Fig. 2). For all four traits, we found significant trends towards reduced response to experimental warming during warmer summers (Fig. 3).
Discussion
The results of this study are generally consistent with, or confirm, previous studies. What makes this study unique and of interest is not that the findings are novel, but rather that they are consistent with earlier studies despite the fact that this study has now examined response over 17–19 years of experimental treatment. This study suggests that the overall response of tundra plants to experimental warming is relatively constant. Like previous studies, the most consistent response to experimental warming observed was an increase in inflorescence heights; this has been observed in earlier studies on the same plots (Hollister, Webber & Bay 2005; Hollister, Webber & Tweedie 2005) and in previous short-term studies on tundra plants (Arft et al. 1999; Gugerli & Bauert 2001). While few long-term studies report the effects of experimental warming on the inflorescence heights of individual species, other data from long-term studies are consistent with our results, showing that overall plant height increases with warming (Hudson et al. 2011) and that reproductive biomass typically increases with warming (Klady et al. 2011; Campioli et al. 2013).
Experimental warming significantly increased the leaf lengths of many of our plant species equating to an average increase of 9% in total leaf length. Similarly, Dormann & Woodin (2002) found that warming increased plant leaf traits (e.g., size and length) by approximately 15% over a shorter period of time as the studies they included in their analysis had been warmed for typically fewer than five years. The overall effect size we report for warming on leaf length over 17–19 years of treatment was also similar to that reported in the earlier short-term study by Arft et al. (1999), which found an effect size of approximately 0.4 during the second and third years of warming treatment. Hudson et al. (2011) reported significant increases in leaf length and size over 16 years of warming in Arctic Canada. Other studies have also noted an increase in photosynthetic biomass and productivity over extended periods of warming (Boelman et al. 2003; Michelsen et al. 2012; Natali et al. 2012). These results, combined with those of our study, suggest that vegetative growth is capable of responding to warming over extended periods of time until temperatures are no longer a limiting factor.
Reproductive phenology typically accelerated with warming, significantly so for 35% of species at our sites. Arft et al. (1999) also found that warming over a short period of time significantly accelerated flowering for many species, resulting in relatively large effect sizes, especially after the first year of treatment. Similar results have been found in earlier studies where warming led to earlier flowering (Dunne et al. 2003; Hollister, Webber & Bay 2005) and in numerous observational studies where warmer air temperatures were associated with earlier flowering (Thórhallsdóttir 1998; Post & Forchhammer 2008). However, some studies have also found a delay in flowering date under warmer conditions (Dorji et al. 2013). It should also be noted that some species appear to be reaching a threshold whereby flower timing cannot accelerate further, as has been suggested by Iler & Inouye (2013).
Reproductive effort was not typically affected by warming treatment at our sites. Arft et al. (1999) also found that overall reproductive effort was not significantly impacted by warming across a variety of sites over four years of warming. Similar results have been observed in other short-term studies on tundra and sub-alpine plants where effects of warming on reproductive effort showed a high degree of variability between species and years (Lambrecht et al. 2007; Dorji et al. 2013). In contrast to our findings, a long-term study in Arctic Canada (Klady et al. 2011) found that plants exposed to 12 years of warming had significant increases in reproductive effort. Conflicting results between these studies could be explained by the differences in geographic location. Arft et al. (1999) proposed that it would be more beneficial for plants in the High Arctic to respond to warming with increased reproductive efforts as they presumably faced less competition over resources from their neighbours, reducing the advantage to producing a taller canopy whereas Low Arctic plants would face such competition and be in need of a more immediate growth response to outcompete neighbouring species. Our study was consistent with this hypothesis as our colder sites in Barrow showed significant effect sizes for warming on average inflorescence heights (BD=0.98, BW=0.69) and average flowering dates (BD=−3.84, BW=−1.48) while our relatively warmer sites in Atqasuk did not. Compared to our sites, those examined in Klady et al. (2011) are much farther north and future studies could help discern whether these differences are plastic responses to environmental factors or genetic adaptations within different ecotypes.
Plant responses to warming remained largely consistent over the study period. However, reproductive phenology showed a significant trend towards reduced responses to warming over time. Although the results of regression analyses on other plant traits were non-significant, they were consistent with a diminishing experimental warming response over time (Fig. 2). The general warming trend of the region is the likely explanation for this trend towards a diminished magnitude of response over time given the strong evidence that the effect of warming on plant traits decreases with warming ambient conditions. In other words, plants respond less to experimental warming in warmer years, and the later years of the study were generally warmer. Earlier studies (Chapin et al. 1995; Arft et al. 1999) anticipated, and found evidence of, transient warming responses whereby plants initially responded to warming through an increase in growth and reproduction followed by a greatly diminished response. This pattern was expected because Arctic plants are adapted to respond to improved summer conditions through accelerated growth and reproduction, at the cost of resources in underground storage (Shaver & Kummerow 1992). However, warmed plants at sites with low average temperatures and high interannual variability could still be receiving the recovery time necessary to replenish their nutrient and carbohydrate stores during cooler years, utilizing these stores during warmer years. This could explain discrepancies between our results and those of transplant studies where plants in drastically and consistently warmer conditions may not have adequate time to replenish resources.
Given that the magnitude of warming response showed a much stronger trend with seasonal temperature than the duration of experimental warming, we conclude that plants are able to sustain their responses to warming for longer periods of time than previously suggested. Yet, we also note that temperatures are nearing thresholds where other factors will become limiting. Therefore, we forecast that plants at our sites will shift from being temperature-limited to being constrained by other abiotic factors as the region warms due to climate change. This may already be the case for reproductive phenology at our sites and suggests that some plant species are reaching a threshold in warm years where they are incapable of flowering earlier, as Iler & Inouye (2013) have proposed.
While we present evidence that summer growing temperatures will become less limiting for plant growth and reproduction over time, we have yet to quantify the impacts of abiotic conditions during the winter and spring seasons, both of which can dramatically affect plant species during the growing season (Starr et al. 2000; Bokhorst et al. 2008). Previous studies from other regions in the Arctic indicate that plants at our sites will likely shift from being temperature-limited to being more nutrient and competition-limited (Chapin & Shaver 1985b; Dormann & Woodin 2002). Beyond seasonal weather, nutrient availability, and competition, we recognize that many Arctic ecotypes are likely to face limitations brought on by genetic constraints making them less able to respond to what would otherwise be considered more favourable growing conditions (Starr et al. 2000; Mazer et al. 2013). Future studies across a greater range of time, latitudes and experimental treatments would help establish the relative importance each of these biotic and abiotic factors has on plant species, ultimately improving our ability to predict and understand the impacts of climate change in tundra ecosystems.
The response of plants documented here has complex implications for energy balance, community compositions and trophic interactions. For example, as plants grow taller and increase canopy complexity they absorb more energy, which will further accelerate warming (Chapin et al. 2000). However, increasing canopy complexity may also enhance the insulating effect of the vegetation layer, in some cases cooling soils, and may stabilize permafrost (Hollister et al. 2008). Changes in plant species composition will subsequently influence decomposition rates, in turn affecting carbon and nutrient cycling (Aerts 2006). Changes in plant phenology, growth and community compositions will affect quality and availability of food for herbivores and pollinators, a phenomenon that has already been documented in some parts of the Arctic (Post & Forchhammer 2008; Gilg et al. 2009; Gauthier et al. 2013). Future work to link the results of studies on the traits of individual species to shifts in community composition will prove highly useful in better forecasting and understanding changes in the Arctic due to climate change.
Acknowledgements
We are greatly indebted to the efforts of Pat Webber, Christian Bay, Craig Tweedie and Steve Oberbauer. We thank the many field assistants who aided in collecting these data, especially J. May, J. Liebig, K. Kremers and T. Botting. We also thank the National Science Foundation Office of Polar Programs (OPP #9714103, #0632263, #0856516 and #1432277) for support, the Barrow Arctic Science Consortium and UMIAQ LLC for logistics, the ITEX network for collaborations and anonymous reviewers for their suggestions. All data are archived and available at Advanced Cooperative Arctic Data and Information Service managed by the National Snow and Iced Data Center (www.nsidc.org/acadis/).
References
- Aerts R. 2006. The freezer defrosting: global warming and litter decomposition rates in cold biomes. Journal of Ecology 94, 713–724. Publisher Full Text
- Arft A.M., Walker M.D., Gurevitch J., Alatalo J.M., Bret-Harte M.S., Dale M.R.T., Diemer M.C., Gugerli F., Henry G.H.R., Jones M.H., Hollister R.D., Jónsdóttir I.S., Laine K., Lévesque E., Marion G.M., Molau U., Mølgaard P., Nordenhall U., Raszhivin V., Robinson C.H., Starr G., Stenström A., Stenström M., Totland Ø., Turner P.L., Walker L.J., Webber P.J., Welker J.M. & Wookey P.A. 1999. Responses of tundra plants to experimental warming: meta-analysis of the International Tundra Experiment. Ecological Monographs 64, 491–511.
- Bennington C.C., Fetcher N., Vavrek M.C., Shaver G.R., Cummings K.J. & McGraw J.B. 2012. Home site advantage in two long-lived Arctic plant species: results from two 30-year reciprocal transplant studies. Journal of Ecology 100, 841–851. Publisher Full Text
- Billings W.D. & Mooney H.A. 1968. The ecology of Arctic and alpine plants. Biological Review 43, 481–529. Publisher Full Text
- Bliss L.C. 1971. Arctic and alpine plant life cycles. Annual Review of Ecology and Systematics 2, 405–438. Publisher Full Text
- Boelman N.T., Stieglitz M., Rueth H.M., Sommerkorn M., Griffin K.L., Shaver G.R. & Gamon J.A. 2003. Response of NDVI, biomass, and ecosystem gas exchange to long-term warming and fertilization in wet sedge tundra. Oecologia 135, 414–421. PubMed Abstract | Publisher Full Text
- Bokhorst S., Bjerke J.W., Bowles F.W., Melillo J., Callaghan T.V. & Phoenix G.K. 2008. Impacts of extreme winter warming in the sub-Arctic: growing season responses of dwarf shrub heathland. Global Change Biology 14, 2603–2612.
- Campioli M., Schmidt N.M., Albert K.R., Leblans N., Ro-Poulsen H. & Michelsen A. 2013. Does warming affect growth rate and biomass production of shrubs in the High Arctic? Plant Ecology 214, 1049–1058. Publisher Full Text
- Chapin F.S. III & Chapin M.C. 1981. Ecotypic differentiation of growth processes in Carex aquatilis along latitudinal and local gradients. Ecology 62, 1000–1009. Publisher Full Text
- Chapin F.S. III, McGuire A.D., Randerson J., Pielke R., Baldocchi D., Hobbie S.E., Roulet N., Eugster W., Kasischke E., Rastetter E.B., Zimov S.A. & Running S.W. 2000. Arctic and boreal ecosystems of western North America as components of the climate system. Global Change Biology 6, 211–223. Publisher Full Text
- Chapin F.S. III & Shaver G.R. 1985a. Arctic. In B.F. Chabot & H.A. Mooney (eds.): Physiological ecology of North American plant communities. Pp. 16–40. New York: Chapman and Hall.
- Chapin F.S. III & Shaver G.R. 1985b. Individualistic growth response of tundra plant species to environmental manipulations in the field. Ecology 66, 564–576. Publisher Full Text
- Chapin F.S. III, Shaver G.R., Giblin A.E., Nadelhoffer K.J. & Laundre J.A. 1995. Response of Arctic tundra to experimental and observed changes in climate. Ecology 76, 696–711. Publisher Full Text
- Chapin F.S. III, Sturm M., Serreze M.C., McFadden J.P., Key J.R., Lloyd A.H., McGuire A.D., Rupp T.S., Lynch A.H., Schimel J.P., Beringer J., Chapman W.L., Epstein H.E., Euskirchen E.S., Hinzman L.D., Jia G., Ping C.L., Tape K.D., Thompson C.D.C., Walker D.A. & Welker J.M. 2005. Role of land-surface changes in Arctic summer warming. Science 310, 657–660. PubMed Abstract | Publisher Full Text
- Dorji T., Totland Ø., Moe S.R., Hopping K.A., Pan J.B. & Klein J.A. 2013. Plant functional traits mediate reproductive phenology and success in response to experimental warming and snow addition in Tibet. Global Change Biology 19, 459–472. PubMed Abstract | Publisher Full Text
- Dormann C.F. & Woodin S.J. 2002. Climate change in the Arctic: using plant functional types in a meta-analysis of field experiments. Functional Ecology 16, 4–17. Publisher Full Text
- Dunne J.A., Harte J. & Taylor K.J. 2003. Subalpine meadow flowering phenology responses to climate change: integrating experimental and gradient methods. Ecological Monographs 73, 69–86.
- Elmendorf S.C., Henry G.H.R., Hollister R.D., Bjork R.G., Bjorkman A.D., Callaghan T.V., Collier L.S., Cooper E.J., Cornelissen J.H.C., Day T.A., Fosaa A.M., Gould W.A., Grétarsdóttir J., Harte J., Hermanutz L., Hik D.S., Hofgaard A., Jarrad F., Jónsdóttir I.S., Keuper F., Klanderud K., Klein J.A., Koh S., Kudo G., Lang S.I., Loewen V., May J.L., Mercado J., Michelsen A., Molau U., Myers-Smith I.H., Oberbauer S.F., Pieper S., Post E., Rixen C., Robinson C.H., Schmidt N.M., Shaver G.R., Stenström A., Tolvanen A., Totland Ø., Troxler T., Wahren C.H., Webber P.J., Welker J.M. & Wookey P.A. 2012. Global assessment of experimental climate warming on tundra vegetation: heterogeneity over space and time. Ecology Letters 15, 164–175. PubMed Abstract | Publisher Full Text
- Gauthier G., Bety J., Cadieux M.C., Legagneux P., Doiron M., Chevallier C., Lai S., Tarroux A. & Berteaux D. 2013. Long-term monitoring at multiple trophic levels suggests heterogeneity in responses to climate change in the Canadian Arctic tundra. Philosophical Transactions of the Royal Society B 368, article no. 20120482, doi: http://dx.doi.org/10.1098/rstb.2012.0482
- Gilg O., Sittler B. & Hanski I. 2009. Climate change and cyclic predator–prey population dynamics in the High Arctic. Global Change Biology 15, 2634–2652. Publisher Full Text
- Gugerli F. & Bauert M.R. 2001. Growth and reproduction of Polygonum viviparum show weak responses to experimentally increased temperature at a Swiss alpine site. Botanica Helvetica 111, 169–180.
- Hedenås H., Carlsson B.Å., Emanuelsson U., Headley A.D., Jonasson C., Svensson B.M. & Callaghan T.V. 2012. Changes versus homeostasis in alpine and sub-alpine vegetation over three decades in the sub-Arctic. Ambio 41, 187–196. Publisher Full Text
- Hollister R.D. 2003. Response of tundra vegetation to temperature: implications for forecasting vegetation change. PhD thesis, Michigan State University.
- Hollister R.D., Webber P.J. & Bay C. 2005. Plant response to temperature in northern Alaska: implications for predicting vegetation change. Ecology 86, 1562–1570. Publisher Full Text
- Hollister R.D., Webber P.J., Nelson F.E. & Tweedie C.E. 2006. Soil thaw and temperature response to air warming varies by plant community: results from an open-top chamber experiment in northern Alaska. Arctic Antarctic and Alpine Research 38, 206–215.
- Hollister R.D., Webber P.J., Slider R.T., Nelson F.E. & Tweedie C.E. 2008. Soil temperature and thaw response to manipulated air temperature and plant cover at Barrow and Atqasuk, Alaska. In D.L. Kane & K.M. Hinkel (eds.): Ninth International Conference on Permafrost. Vol. 2. Pp. 729–734. Fairbanks: Institute of Northern Engineering.
- Hollister R.D., Webber P.J. & Tweedie C.E. 2005. The response of Alaskan Arctic tundra to experimental warming: differences between short- and long-term responses. Global Change Biology 11, 525–536. Publisher Full Text
- Hudson J.M.G. & Henry G.H.R. 2009. Increased plant biomass in a High Arctic heath community from 1981 to 2008. Ecology 90, 2657–2663. PubMed Abstract | Publisher Full Text
- Hudson J.M.G., Henry G.H.R. & Cornwell W.K. 2011. Taller and larger: shifts in Arctic tundra leaf traits after 16 years of experimental warming. Global Change Biology 17, 1013–1021. Publisher Full Text
- Iler A.M. & Inouye D.W. 2013. Effects of climate change on mast-flowering cues in a clonal montane herb, Veratrum tenuipetalum (Melanthiaceae). American Journal of Botany 100, 519–525. PubMed Abstract | Publisher Full Text
- Klady R.A., Henry G.H.R. & Lemay V. 2011. Changes in High Arctic tundra plant reproduction in response to long-term experimental warming. Global Change Biology 17, 1611–1624. Publisher Full Text
- Lambrecht S.C., Loik M.E., Inouye D.W. & Harte J. 2007. Reproductive and physiological responses to simulated climate warming for four subalpine species. New Phytologist 173, 121–134. PubMed Abstract | Publisher Full Text
- Mazer S.J., Travers S.E., Cook B.I., Davies T.J., Bolmgren K., Kraft N.J.B., Salamin N. & Inouye D.W. 2013. Flowering date of taxonomic families predicts phenological sensitivity to temperature: implications for forecasting the effects of climate change on unstudied taxa. American Journal of Botany 100, 1381–1397. PubMed Abstract | Publisher Full Text
- Michelsen A., Rinnan R. & Jonasson S. 2012. Two decades of experimental manipulations of heaths and forest understory in the Subarctic. Ambio 41, 218–230. PubMed Abstract | PubMed Central Full Text | Publisher Full Text
- Molau U. (ed.) 1993. International Tundra Experiment (ITEX) manual. Copenhagen: Danish Polar Center.
- Natali S.M., Schuur E.A.G. & Rubin R.L. 2012. Increased plant productivity in Alaskan tundra as a result of experimental warming of soil and permafrost. Journal of Ecology 100, 488–498. Publisher Full Text
- Oberbauer S.F., Elmendorf S.C., Troxler T.G., Hollister R.D., Rocha A.V., Bret-Harte M.S., Dawes M.A., Fosaa A.M., Henry G.H.R., Høye T.T., Jarrad F.C., Jónsdóttir I.S., Klanderud K., Klein J.A., Molau U., Rixen C., Schmidt N.M., Shaver G.R., Slider R.T., Totland Ø., Wahren C.-H. & Welker J.M. 2013. Phenological response of tundra plants to background climate variation tested using the International Tundra Experiment. Philosophical Transactions of the Royal Society B 368, 1–13. Publisher Full Text
- Oberbauer S.F., Tweedie C.E., Welker J.M., Fahnestock J.T., Henry G.H.R., Webber P.J., Hollister R.D., Walker M.D., Kuchy A., Elmore E. & Starr G. 2007. Tundra CO2 fluxes in response to experimental warming across latitudinal and moisture gradients. Ecological Monographs 77, 221–238. Publisher Full Text
- Post E. & Forchhammer M.C. 2008. Climate change reduces reproductive success of an Arctic herbivore through trophic mismatch. Philosophical Transactions of the Royal Society B 363, 2369–2375. Publisher Full Text
- Post E., Pedersen C., Wilmers C.C. & Forchhammer M.C. 2008. Warming, plant phenology and the spatial dimension of trophic mismatch for large herbivores. Proceedings of the Royal Society B 275, 2005–2013. PubMed Abstract | PubMed Central Full Text | Publisher Full Text
- R Development Core Team 2005. R: a language and environment for statistical computing. Vienna: R Foundation for Statistical Computing.
- Rosenberg M.S., Adams D.C. & Gurevitch J. 2000. Metawin: statistical software for meta-analysis with resampling tests. Version 2.0. Sunderland, MA: Sinauer Associates.
- Shaver G.R. & Jonasson S. 1999. Response of Arctic ecosystems to climate change: results of long-term field experiments in Sweden and Alaska. Polar Research 18, 245–252. Publisher Full Text
- Shaver G.R. & Kummerow J. 1992. Phenology, resource allocation, and growth of Arctic vascular plants. In F.S. Chapin III et al. (eds.): Arctic ecosystems in a changing climate an ecophysiological perspective. Pp. 193–211. San Diego, CA: Academic Press.
- Starr G., Oberbauer S.F. & Pop E.W. 2000. Effects of lengthened growing season and soil warming on the phenology and physiology of Polygonum bistorta. Global Change Biology 6, 357–369. Publisher Full Text
- Stocker T.F., Qin D., Plattner G.-K., Tignor M., Allen S.K., Boschung J., Nauels A., Xia Y., Bex V. & Midgley P.M. (eds.) 2013. Climate change 2013. The physical science basis. Contribution of Working Group I to the fifth assessment report of the Intergovernmental Panel on Climate Change. Cambridge: Cambridge University Press.
- Symon C., Arris L & Heal B. (eds.) 2005. Arctic climate impact assessment. Cambridge: Cambridge University Press.
- Thórhallsdóttir T.E. 1998. Flowering phenology in the central highland of Iceland and implications for climatic warming in the Arctic. Oecologia 114, 43–49. Publisher Full Text