This article is published under a Creative Commons license and not by the author of the article. So if you find any inaccuracies, you can correct them by updating the article.

Graphic Language in Law


Isakov Vladimir Borisovich
Published: Nov. 2, 2022
Latest article update: Sept. 23, 2023
This article is published under the license


Abstract
Language in this paper is understood as a system of signs of various physical nature, which serves cognitive and communicative functions in human thinking. Languages are formed naturally or created by man artificially for certain purposes. The graphic language as a class belongs to artificial language systems. Graphic language in law is not a unique phenomenon. The system of state symbols studied by heraldry is a variety of the graphical language, just as traffic signs and other signs in transport — water, sea, air, rail, pipeline. The military have a system of symbols of their own such as grade and branch insignia. Industrial signs and designs (for radiation, high tension, magnetic fields) is another example. This paper will attempt to disclose the concept of graphic language and to justify its role in law. The functions of the graphics language and the main types of schemes are considered. The main stages of the schematization process are shown. The author's point of view on the ratio of schematization and visualization, graphic concept and grapheme is expressed. Specific examples are used to demonstrate the possibilities of multi-layered visuals as one of the most promising contemporary varieties of schematization. According to the author, artificial intelligence and natural intelligence are complementary and should interact and mutually develop — co-develop. It means that not only machines should master various functions of human thinking but man equally needs to learn from machines in certain cases — in order to be able to form ontologies, synthesize algorithms, understand the language and operational logic of artificial intelligence.
The graphic language, the one of drawings, schemes, graphs, which is quite abstract and formalized but at the same time understandable and proportionate to ordinary human thinking, could thus become a "bridge" between artificial and natural intelligence. From this point of view, there is obvious promise in the development and use of different types of graphic languages in law, as well as in other humanitarian areas of human activity.
Keywords
Graphic language functions, graphic language, visualization, types of schematization, legal language
Background
The study of legal language1 has always been considered a promising strand both in linguistics and jurisprudence which has noticeably gained in relevance over the last few years as artificial intelligence rapidly progressed in all spheres of life including law. Like many other academics, jurists need a language to communicate with Al systems to solve specific problems through their help.
We believe that Al and human intelligence are complementary and should interact and develop each other (co-develop). This means that, while machines are to learn from man and master different functions of human thinking, man also has to learn from machines in certain cases in order to at least understand the language and logic of artificial intelligence. In our opinion, the graphic language — the one of drawings, diagrams and charts — could bridge the gap between Al and human intelligence as it is fairly abstract and formalized while at the same time adequate to human thinking as we know it. From this point of view, the development and use of graphic language in law like in other arts and humanities hold an obvious promise.
A language means a system of symbols of various physical nature serving a cognitive and communicative function in process of human activities. Languages emerge naturally or are created artificially for purposes. Hence, natural ethnic and artificial languages such as formal, computer, sign language etc. can be distinguished. The graphic language as a class belongs to artificial language systems.
Body text
A closer scrutiny reveals that graphic language in law is not an altogether unique phenomenon. The system of state symbols studied by heraldry, a special branch of science, is a variety of the graphical language. Another system is road signs — and other signs for water, maritime, air, railway, pipeline transport — which make up a special graphic language. The military have a system of symbols of their own such as grade and branch insignia. Industrial signs and designs (for radiation, high tension, magnetic fields) is another example. Some research papers in legal literature discuss systems of signs and symbols and study their legal importance [Ten Yu.P., 2008]. This paper will attempt to justify the composition and functions of the graphic language in law as a variety of graphic language designed to solve research and analytical problems in jurisprudence.
The terms scheme and schematization have their origin in the Greek word schema (appearance, form). In literature a scheme means drawing which shows components of an item, process or product and connections between them with the help of conventional graphical designations. In a more general sense, a scheme is a general description or outline2.
N. Yau, an American researcher, has observed in connection with the use of statistics: “Data could be rather frustrating and irritating, unless you know what you are looking for or understand what is there to look for in the first place. Otherwise they become a heap of numbers and words devoid of any sense except their explicit meaning. The profound sense of statistics and visualization is that it helps to see what is behind all this. Remember: data is a reflection of reality. It is not just a heap of numbers. This heap contains a lot of stories. It has a sense, truth and beauty. Like in real life, these stories might be at times simple and sincere, at times complex and metaphorical. Some are as if borrowed from a textbook, others read like a novel. How to tell this or another story depends on you, statisticians, programmers, designers, data processing specialists” [Yau N., 2013:21].
Graphs, maps, tables, flow charts, diagrams, timelines are among visual aids in teaching jurisprudence and other humanities. They bring clarity and expression to texts and add a touch of modernity and respectability. Statistical software packages and PC applications abound with graphical forms virtually for every occasion. However, choosing the one which fits
the matter to be studied and which is best for visualization is not that simple [Logunova O.S., 2015].
In the schematization process, the following stages can be distinguished:
The object of schematization is analyzed to identify its structural elements (features) to be represented in a scheme.
The relationships between these parts, elements, features are identified.
The language of schematization — a system of graphemes, symbols and images to adequately describe the item in question — is selected.
The type of schematization — associative, ontological objective, tech- nico-organizational, procedural, methodological etc. (see further on) — is selected;
A scheme — graphical model — of an item, phenomenon, process is created using the selected language and type of schematization.
In philosophy, science analysis and in practical jurisprudence the language of schematization has a number of functions to be divided into general and specific one. While the first group of functions is proper of any language, the second is a feature of graphic languages including that of diagrams. We believe the first group to have the following functions:
Ontological function — a language will record, describe and name a reality. This function is sometimes called nominative as one of the purposes of a language is to give names to things of reality. In our view, this function has a wider content. Naming is just a sub-function in the context of a wider task of creating a picture of reality and shaping the specific ontology.
Cognitive function — a language will arrange and support thinking processes. It is stressed in literature that a language is a thinking medium [Kolshansky G.V., 2011: 15-31]; [Pesina S.A., 2016: 51-77] which is true for both natural and artificial languages including schemes. Schemes have the merit of allowing to keep a view of things which is extremely important when dealing with complex things. Schemes considerably expand the capability of human short-term memory while at the same time being a mne- motechnic tool, a means of packing information into long-term memory.
Like any other language, schemes perform a communicative function, that is, ensure communication and exchange of information between people and — over the last few years — between man and machines as well. The practice of teaching confirms that the use of diagrams and charts will largely intensify the exchange of information and make it more efficient. There is a recorded experiment of teaching radio operators in 1970s when one group learned in a traditional way by studying text instructions and the other by using diagrams showing the operator’s actions. The use of diagrams reduced the learning time by almost one half, decision-making time by 30 percent, and error rate by 15 percent [Bowman W., Venda V., 1971: 6].
As a means of communication, graphic languages have the advantage that no translation is required, as they are perceived almost identically by individuals with approximately the same level of development irrespective of linguistic and cultural environment.
Lastly, accumulation and storage of information are also a general function of graphic language. Information will be accumulated and stored not only in word descriptions but also in figures, diagrams and schematics. Moreover, the meaning of graphical images is much less subject to change with time than the meaning of words of a natural language. Thus, our knowledge of Leonardo da Vinci’s creative genius largely comes from his drawings and schemes preserved exclusively thanks to the graphical language.
Apart from general functions, graphic languages have some specific ones.
Firstly, it is a function of generalization and abstraction which, being proper of other languages as well, is immanent to the graphic language. A scheme is not a picture of a thing. Its purpose is not just to describe a thing but to show its essence, identify the underlying features and, most importantly, help separate the necessary from the accidental and secondary [Zhukovsky V.I., Pivovarov P.S., 1998].
Secondly, the schematization will reveal the invisible by making it visible. Properties, relationships, essential features of a phenomenon are not evident since they are the result of our cognitive activities. The schematization will extract them from the depth of a phenomenon for a study, albeit in a conventional graphical form.
Thirdly, schemes are a simple and accessible means of graphical modeling. A scheme can be used as a model to identify an optimal structure of the thing, add new elements, relationships, connections, remove individual fragments and directly observe the outcome of these changes.
Fourthly, schemes are a perfect visualization tool, visual aid widely used in a variety of spheres such as governance, education, science, marketing, road traffic management, etc.
Depending on their purpose and graphic language specifics, schemes could be divided into a number of classes:
Associative schemes — a class of schemes representing a free, informal map of content related to a thing, problem or subject, the most obvious example being the so-called intelligent maps (connectivity maps, memory maps, association maps, mind maps) [Buzen T., 2005]; [Buzen T., Buzen B., 2008]; [Bekhterev S, 2011]; [Nast D, 2008]; [Sibbet D, 2013].
As the main advantage, intelligent maps are able to bring together a host of various phenomena, properties, relationships and facts. Figuratively speaking, they could be called a buffet of associations. While intelligent maps are effective for primary, prior review and analysis of phenomena, their omnivorous nature does not allow to use them for solving complex analytical problems.
Flow charts are probably the most widely used type of schematization. It can be asserted with a good deal of confidence they make up a majority of practically used schemes. With modest pictorial means (circles, rectangles, connection lines and, where possible, colour), flow charts allow to decompose a phenomenon into elements and to show basic relationships between them (parts vs. whole, sequence, subordination) as well as the stage of an ongoing process.
Ontology charts are a class of schemes which attempt to describe the reality as is, the examples being the atomic structure, DNA spiral, star chart etc. A class register with a list of students and the grades they have for each subject is also a kind of operating ontology being that of academic performance. Ontology charts are designed to identify the structure and functions of things and their dynamics, as well as to record the acquired knowledge and explain the observed phenomena.
Organizational charts reflect the arrangements in a certain activity area such as management of a sector, business, research or analytical study, the examples being document flow management charts, car assembly diagrams or business game plans which allow participants to get their bearings and find a place in a complex gaming environment. Organizational charts are among the most useful graphical tools for developing and implementing projects, programmes and plans.
Methodological schemes reflect the means of thinking and activities to be used to solve a specific problem. They rely on a special graphic language designed in philosophic methodology and, depending on the context, can perform a variety of functions such as descriptive, ontological, project, organizational etc. [Zinchenko A. 2004].
A specific example of schematization is the legal regulation diagram widely used in scholarly and academic literature (Fig. 1). It is of ontology chart type since it reflects a general vision of legal reality. The word ontology derived from Latin (ontologia) and several other Greek words means a branch of philosophy dealing with the nature of being and the idea of reality as is. In attempting to observe the reality as is, we always look at it through a system of concepts and representations, that is, theoretical or conceptual lens. A regulatory mechanism represented in Fig. 1 claims to reflect the core structural elements through which the law affects social relationships. Hence, it shows legal provisions, legal facts and actual structures, enactments, legal relationships, exercise of rights and duties, legal awareness, as well as their functional interrelations.
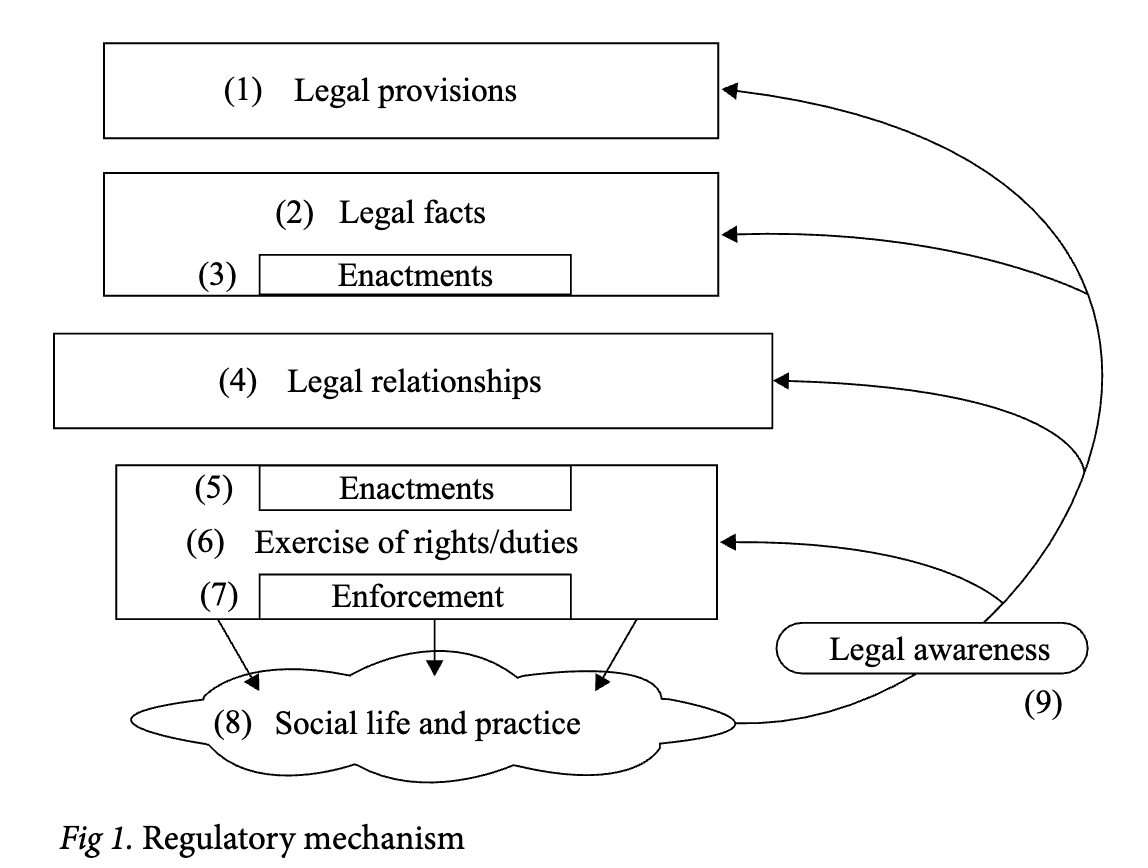
This diagram reflects the main elements of the legal regulatory mechanism and their interrelations.
Legal provisions: the root of regulation (in this model).
Facts (including components thereof) of legal importance. A legal fact, once reported, will trigger a legal provision, that is, activate it.
There are cases where facts will not suffice for legal relationships to arise: for example, an enactment is required for relationships of pension provision, public service, administrative and criminal liability, etc. By publishing a relevant enactment, the government will be involved in regulation for the second time at the level of exercise of legal provisions.
Legal relationship: a legal link arising on the basis of legal provisions between the parties to social relationships. Its distinctive feature is rights and duties of the parties and legal basis for their exercise.
Exercise of a right: another hub of the government’s involvement in regulation of social relationships. Exercising a right is needed to resolve possible disputes between the parties to legal relationships (in respect of the existence of such legal relationships, existence of legal facts, amount of rights and duties and procedure for their exercise etc.).
Acts of exercise of rights and duties by the parties: exercise of rights, performance of duties, compliance with prohibitions.
Conclusive hub of the government’s involvement in legal regulation: possible enforcement of duties (such as collecting debts, damages, fines, penalties; applying administrative or penal sanctions) and also possible use of legal remedies (restituting a property, home, business; securing the right to communication with children etc.).
Positive changes to social life triggered by adequate operation of the regulatory mechanism: final effect achieved by the government in establishing a legal provision.
Feedback from practice to all main elements of regulatory mechanism via legal awareness. It will tell whether the RM is effective and whether it needs to be amended/adjusted.
The diagram of the regulatory mechanism (RM) demonstrates the systemic interrelation between the elements of regulation. It allows to run an analysis of the RM, take steps to make it more efficient, and also identify failures when regulation does not achieve a positive outcome for this or another reason.
The legal practice also makes use of other types of schematization such as procedural, lifecycle, ideological schemes, scientific worldviews etc. “Making the schematization part of verbal communication, P. Mrdulyash wrote, will extinguish the ambiguity which complicates the understanding. Once a scheme is there, the subject matter will be rid of the superfluous such as verbal polysemy, ambiguous terms. Schematics leave no wiggle room for interpretation of text or demonstration of purpose other than stated... A correct scheme contains only the crucial, essential elements and their linkages that, on the one hand, exhaustively define the content and, on the other hand, hide what is secondary. In this sense, a scheme will make the conversation dull but more exact. Figuratively (but not simplisti- cally) speaking, a person drawing a schematic resembles a sculptor who cuts away the superfluous from the verbal block of a conversation” (Mrdulyash P, 2005:41).
The expressions schematism and schematic thinking sometimes have a negative connotation as a feature of simplistic, primitive, dogmatic thinking unable to reflect the complex and contradictory reality in its entirety. Unfortunately, the Soviet social and political practices gave rise to a good many examples of ugly and dogmatic schematization. Authoritatively imposing dogmatic schemes on science, culture, ideology, education, labeling those who did not share them as enemies and renegades has done a colossal harm to the nation. However, no society is immune from relapses of authoritarian dogmatism. Hence, it should be made clear that the schematization is just a tool of legal thinking and, like with any tool, one should be aware of its limits beyond which its use is harmful rather than beneficial.
A distinction between schematization and visualization has to be made in the context of this paper. Visualization has multiple meanings: visual representation of an idea, concept, design in architecture; use of visual aids in education; display of internal organs in a picture, photograph or screen in medicine; external expression of psychic processes proper of human consciousness in psychology; a system of images to express an artistic idea in arts; external manifestation of hopes, dreams and subconscious drives in occultism; vivid representation of an analytical content in analytics. Being an auxiliary carrier of information relative to text, visualization helps identify the essential, fundamental ideas, show the relevance of intellectual operations and communicate as much information as possible. Schematization is, in our view, a form of visualization.
Visualization is a tricky stage of the research process in its own way. At this stage, the shabbiness of ideas, conceptual faults, logical gaps, weak evidence base etc. are difficult to hide. All these deficiencies will find their way out and become visible.
In the process of graphical visualization researchers, teachers and students will face problems of dual nature. Firstly, they need to choose a graphic language and a type of schematization that will best express the idea of research. Secondly, they need to present a graphic scheme in a modern design form to make it vivid. While the schematization is focused on modeling a thing and identifying its essence with graphic means, the visualization purports to represent, demonstrate in a vivid form.
The difference between the former and the latter could be demonstrated on specific examples. Suppose an author, having tried various concepts, finally resorts to use the graphic image of a house. As a graphical concept, the grapheme “house” may look as follows (Fig. 2):
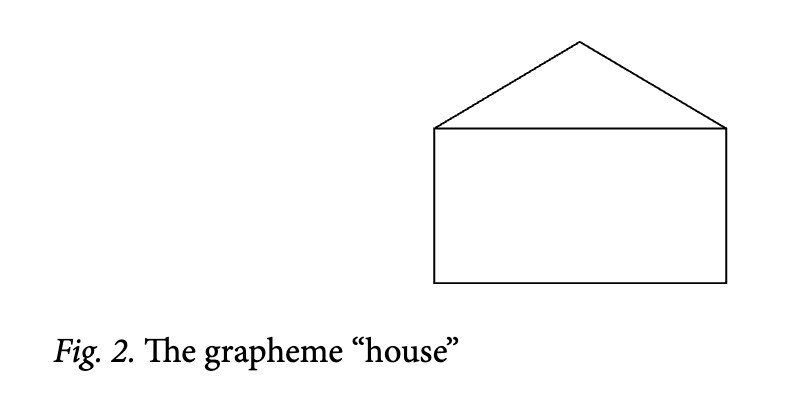
Will this suffice? For an academic discussion in most cases — yes; but where a presentation is expected to be public, the graphic concept needs to be made more expressive in its artistic form which are abundant in this case (Fig. 3):
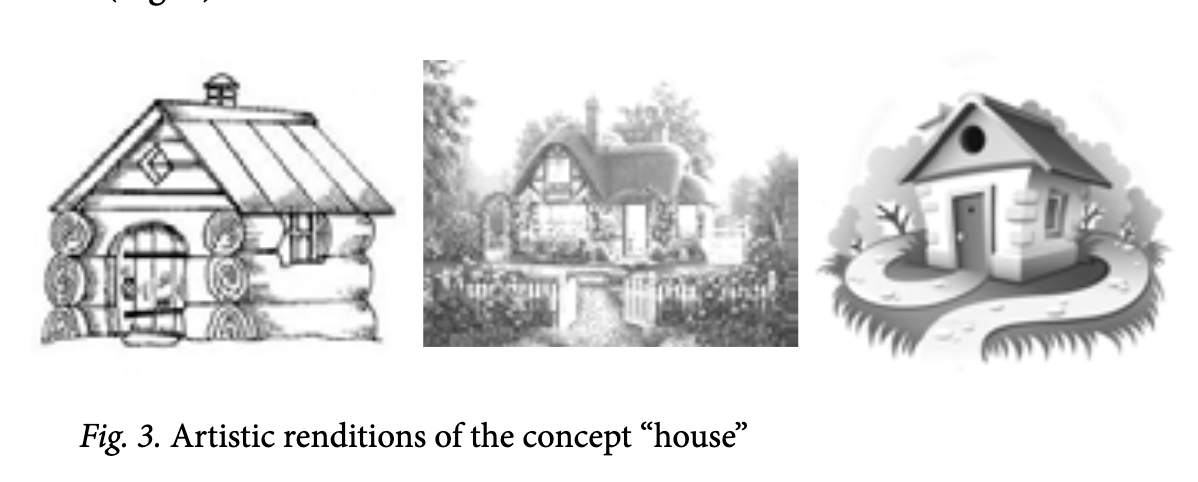
The problem is to choose from this variety a graphical form which would be up to the challenge. This will require to call on a professional artist or designer, or, as the first step, to open up an album with samples of decorative design.
The scholarly and analytical practice will make use of various visualization means, the most widespread being the following.
Original text design. Scholarly and analytical documents often take the form of printed sheets of paper, only to make one expect hours of boredom and tedium. Clearly structured documents with alternating typesets and colours where graphs, quotes, definitions, conclusions and other major elements are placed in colourful boxes are much more attractive. With modern computer technologies and ready-made design patterns, decorating a text is not problematic.
Drawings. Scholarly and analytical texts sometimes have drawings to serve different purposes: illustrating a text, signaling an important wording, conclusion, definition etc.
Morphological drawings of a cross-section or part sectional view of human organs, buildings, transport vehicles, technical facilities make up a special class. They are often used to illustrate popular science and technology magazines.
Bad at drawing or cannot draw at all? No problem. Try to draw always and everywhere with whatever means you have at hand. Even a mediocre drawing will make it easier to frame and communicate a thought.
Pictures make up another major means of visualization. Large companies will normally have objects of art, paintings, watercolours and lithographic prints in their offices to make the environment less official. Pictures in text documents (such as business reports) serve roughly the same purpose. Thus, an annual report of a major Russian bank suggested associations with a ballet performance. Apparently, there were a lot of parallels for a nice, original and meaningful presentation. Such a report will not be left on the table or thrown into the waste basket. Importantly, a “picture gallery” should echo, not contradict, the document’s content. The thing is to bring aesthetic dimension to a business document, add a touch of beauty, and to introduce unexpected associations and allegories, give the reader an opportunity to lay back without departing from the subject in question.
Cartoons are an excellent means of visualization for stressing the main idea of the document, and creating an atmosphere of an alternative critical view on the discussed problem. Cartoons are very informative as they invoke whole strata of social experience with limited graphical means and appeal not just to the reader’s intellect, but to his emotional mindset and values.
Moreover, it should be borne in mind that the provocative nature of cartoons is differently perceived by people, sometimes giving rise to hostility and negative attitude. We believe this provocativeness to help rather than obstruct the perception of text by triggering an internal dialogue and by engaging the reader in a tug of war between a serious text and a funny, ironic cartoon inserted in it.
Pictograms and infographics as a means of visualization of business, science and analytical texts have become popular over the last few years. Of course, they provide a simplified and at times even primitive picture of a pro- cess/phenomenon. But they have an important merit of covering the whole of the picture on a single sheet of paper. For example, an infographical image of the thesis defense gives an idea of the main stages, turning points and traps of this complex process, and thus helps to better prepare for it.
Digests, comics perform largely the same function as infographics but using other graphical means such as drawings and sketches of a specific artistic style to illustrate the turning points of a dramatic storyline. Digests and comics could be useful when the purpose is to expand the readership and achieve their support not only through logical argumentation but also emotional impact. Visualization of this type is best effective in marketing, PR and public analytics.
Presentations are probably the most affordable and popular form of visual representation of research and analytical documents. While a good many quality literature is devoted to the art of computer-aided presentations, the general level of analytical presentations is deplorably low. Some authors, failing to find adequate graphic images, burden their presentations with text fragments to read out later, something which is, in our opinion, absolutely inefficient. Others are lured by rich opportunities of color, light, graphics, animation and hypertext, only to transform the presentation into a gaudy circus show. And only a few manage to achieve an organic fusion of pictorial and oral performance where the presentation does not distract or dominate but complements oral speech helping to make the performed work more meaningful.
Animation in the form of a standalone film or animated drawings and charts can be a good complement to a serious research material. Animation is especially useful where a dynamic representation of interrelated processes is necessary. Thus, for example, the operating principles of a sophisticated technical system are much better visible in animated images than static drawings and schematics. Computer animation is also widely used to accompany TV news items (video images of the weather, accidents, crime, disasters, natural phenomena).
Motion pictures and video films are the most effective but also most complex means of visualization of research materials. The problem is that neither research and analytical ideas nor ideological principles are transposable to screenplay. Any such attempts (there were some) give birth to monster movies which discredit as much as impose the ideas they convey. Rather than being a simple illustration, a motion picture or video film should be a creative product of its own on the same subject as the principal document but — as in the case of cartoons — sometimes in constructive opposition to conclusions and proposals of government officers. The more independent and creative a film is, the greater impact it will make — not as a visual supplement or promotional video but as a standalone artistic production on the same subject.
3D models, as a means of visualization, are three-dimensional full-scale replica. This method is most often used to represent landscapes and architectural objects, as well as for industrial and military applications. But with the invention of 3D printing it became possible to “print” three-dimensional replica of machines, units, buildings, research models, and to provide three-dimensional visualization of abstract structural images.
Virtual and extended reality as an altogether new category of visualization emerged in the late 20th century relies on computer-generated visual effects to create artificial visual imagery replacing/extending the reality in an increasingly vivid and convincing way. The objects of virtual/extended reality are widely used in cinema, television and entertainment business including computer games. There is an active search for the forms in which they could be used in science, analytics and education.
Visualization is a powerful tool to put the outcomes of research and analysis into practice but to be used with a sense of moderation. It is well known that live metaphoric speech attracts the listener’s attention and improves the understanding and memorizing. The same speech overburdened with imagery, ostentatious and pretentious, will produce an opposite effect. Practice and critical assessment of the achieved results is permanently needed to strike an optimal balance between the textual and visual, rational and emotional.
To conclude, let us consider a promising but not yet mastered and actively used form of visualization such as multi-layered visualization. It would be safe to define it as a graphical model of a process/phenomenon whose various aspects and elements are represented in the form of relatively independent, interrelated and interacting layers of a model, map or chart.
Multi-layered visualization can be widely used in a modern environment: in medicine as a sequence of photo/X-ray prints or layered CTT scans showing the structure of the studied object and/or different progression stages of a disease; in social/political sciences as a multiple aspect description of a process/phenomenon; in history as different descriptions of the same event viewed by different parties or researchers; in archaeology as a sequence of interrelated cultural layers; in cultural studies as a multidimensional description of a cultural process or phenomenon; in jurisprudence as a set of witness statements on the same event; in analytics as a multiple aspect model of a situation to be analyzed etc.
The multi-layered structure of technological systems can be demonstrated on the example of electric power engineering. “This is a complex object which has a technological layer (in industrial engineers’ paradigm, it is about kilowatts, physics and process technology); a business organization layer (it is about economic agents which transform fuel and other resources into heat and light at particular homes); an economic layer (the same business processes are regarded as the transformation of money and goods, as consumption and production); a financial layer (it is about cash flows viewed outside pipes and power transmission lines). One can probably name a dozen other paradigms as prisms to view electric power engineering and its reform. However, bringing them together is only possible by configuring various knowledge and identifying the stakeholders’ positions in respect of this entity to be analyzed” [Schedrovitsky ?., 2008: 61].
Scholarly and reference literature makes a wide use of the terms aspect, side, viewpoint, sight angle. What new does the multi-layered visualization bring? Why is it there at all? Each of the above concepts has a domain of its own. While it is easy to write or say — side, aspect, viewpoint, sight angle — it is less evident how to depict them schematically. Unlike them, the concepts of layers and multi-layered visualization are also graphic language means are simple to schematize and understand.
Multi-layered visuals are a promising type of schematization with a wealth of capabilities allowing, in particular, to:
Bring together the various aspects of and approaches to a thing, situation, process or phenomenon.
Delineate these approaches without mixing them.
Identify deficiencies in a system of approaches or inadequate development of specific layers in a multi-layered visual and to make up for it.
Encourage new creative approaches and innovative ideas.
Demonstrate, as may be necessary, not only the structure but also the time dynamics of object interaction.
Identify interaction hubs in a multi-layered structure, that is, the points where the interrelated layers cross/exchange or clash/reject.
Communicate the information of various layers expressed in the language of different disciplines to the integrating layer to be enriched by adding up the interrelated aspects of a problem.
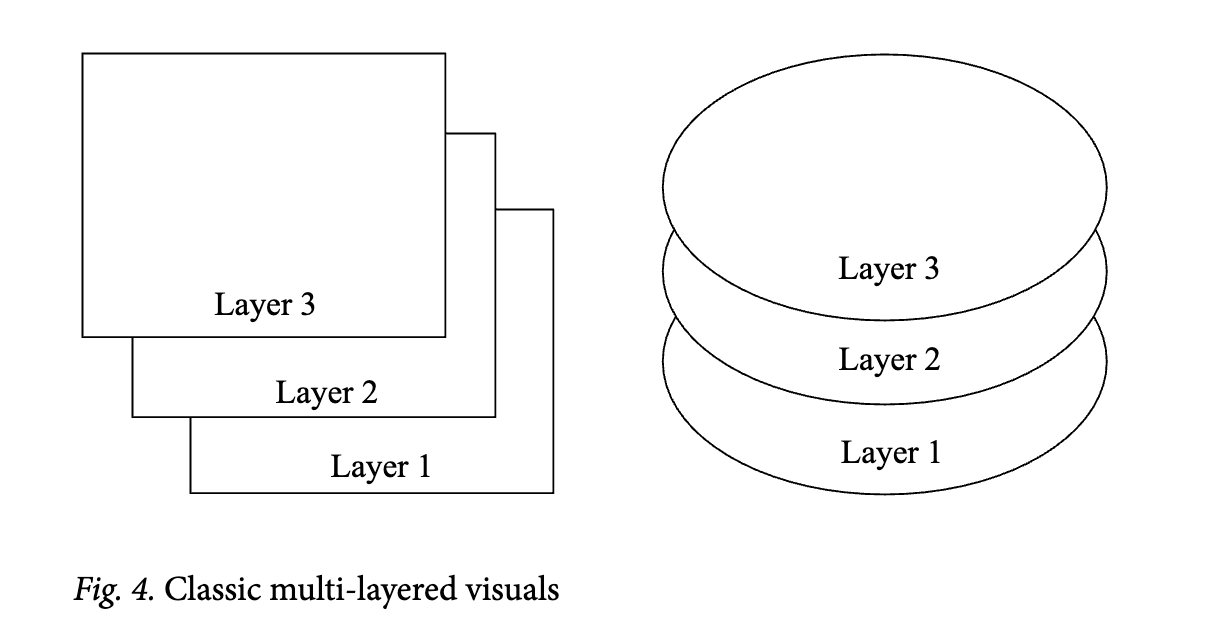
In practical research and analysis, multi-layered visuals might take different forms. Given below are examples of different types of representations of research situations.
Classic multi-layered visuals are the simplest and widely used type. From a graphical perspective, a classical multi-layered visual looks as follows (Fig. 4), its cognitive value being layers representing different sides, aspects, manifestations of a phenomenon under study, only to bring them together in a scheme which allows to consider them in relation to each other.
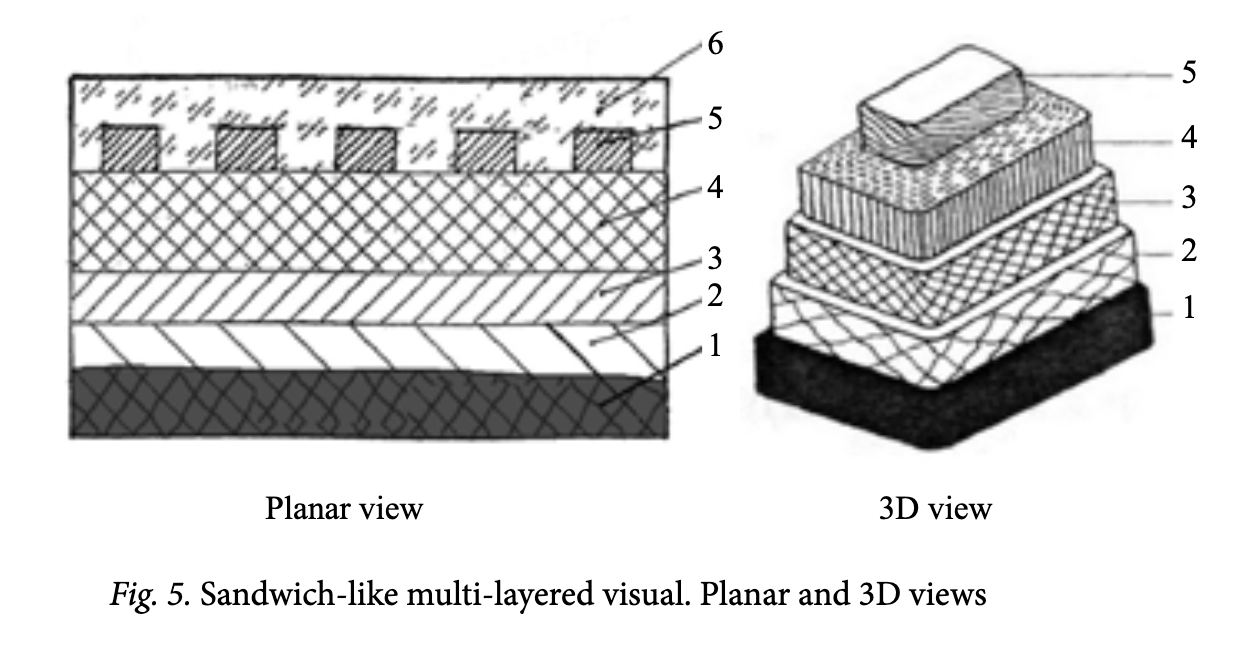
Sandwich-like multi-layered visuals are closer to the classic type, with the content of a problem schematized as layers of a “sandwich”. Moreover, the layers can be homogenous or heterogeneous and contain inclusions of various kind. The image of a sandwich is intuitively clear and does not require to be deciphered. In making a scheme, the number of layers could be increased or decreased without a major impact on the structure (Fig. 5).
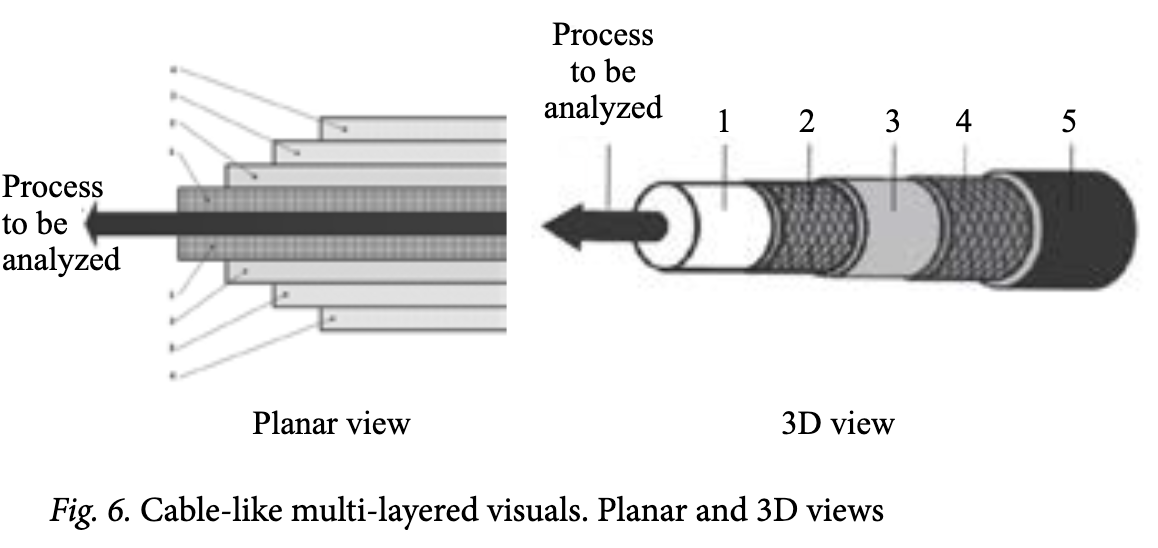
Cable-like multi-layered visuals respond to a frequent need to graphically represent processes with conditions and circumstances, as it were, twining round. This is an analytical task addressed by this type of multilayered visuals (Fig. 6) which graphically resemble a cable with the process to be analyzed in the center and external conditions and circumstances on the outside.
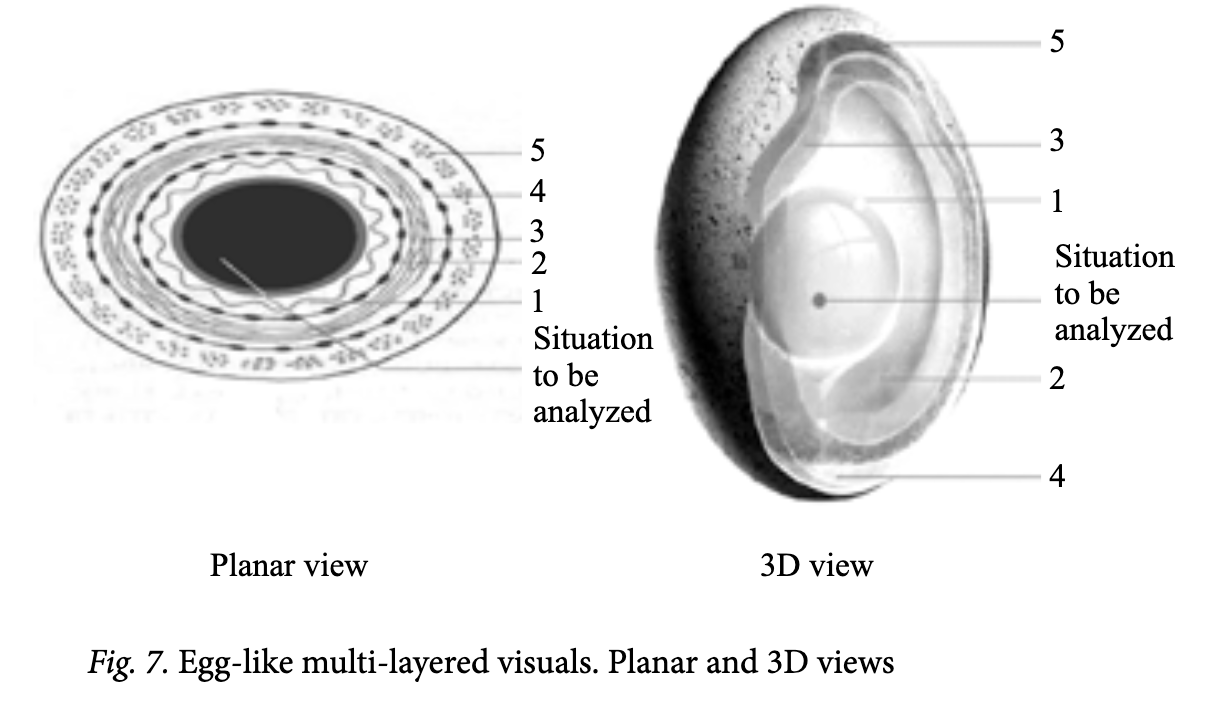
Egg-like multi-layered visuals. A multi-layered visual may be used to depict a multi-layered situation in a closed, secluded, isolated environment, for example, a camping trip, mountaineering group, sea vessel, submarine or spaceship. In this case, layers of the situation under study are concentrated around one or more centers, that is, form a kind of multi-layered egg subject to a minimum of outside effects. Graphically, this type of multilayered visuals may look as follows (Fig. 7).
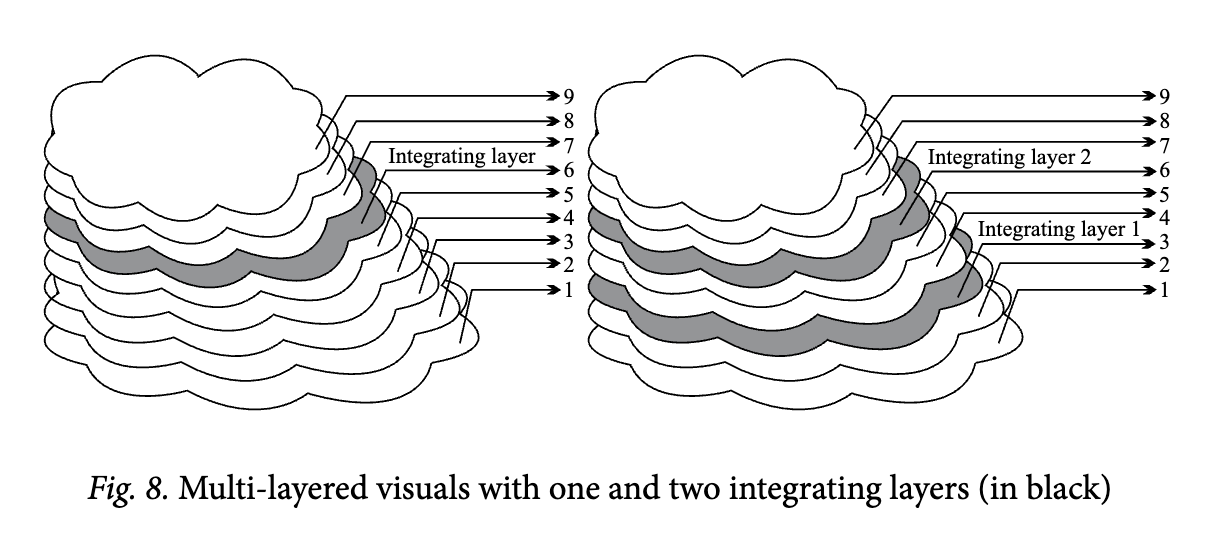
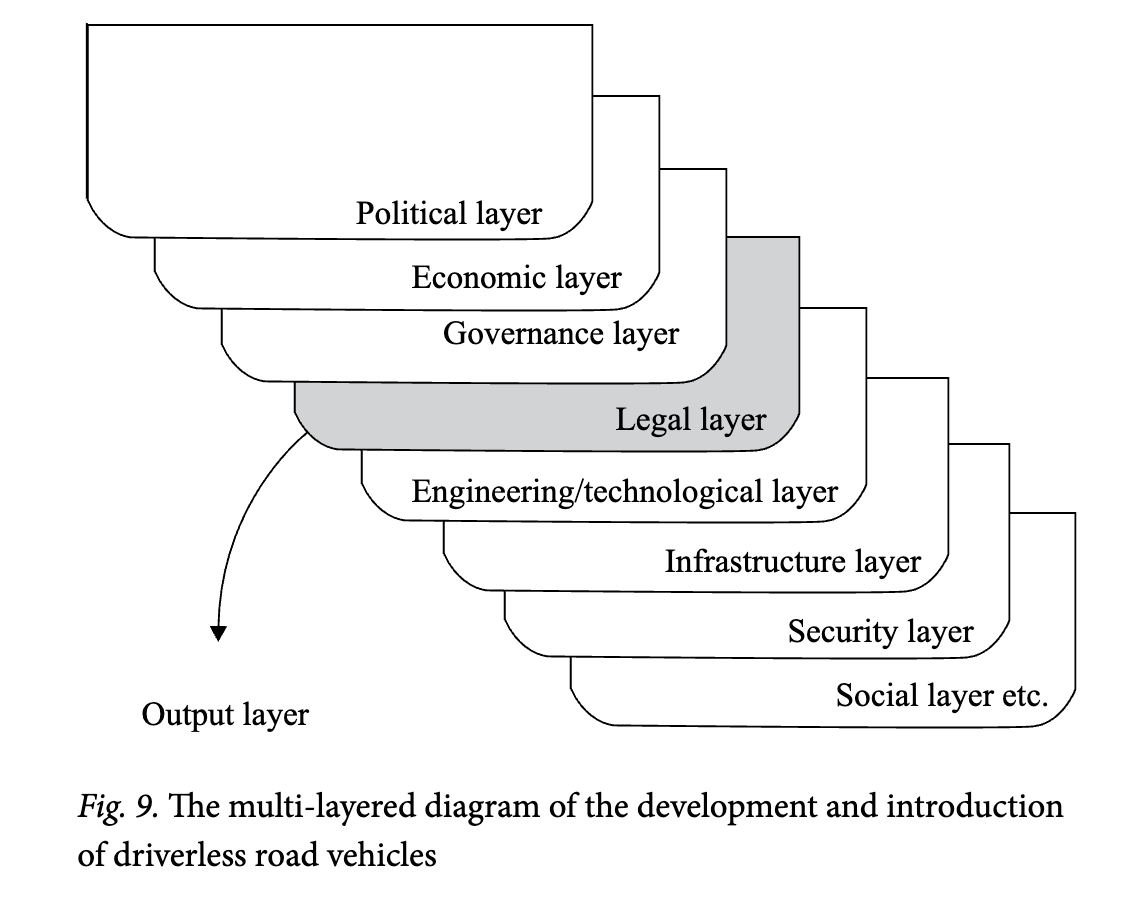
In using multi-layered visualizations, it should be borne in mind that their layers are normally non-equivalent, with one or more integrating layers which sum up the content. This layer is especially important for researchers, such as political layer in political studies, economic layer in economic studies, legal layer in legal studies etc. It could be called the “main”, “summarizing”, “integrating” or “output” layer (there is no definitive terminology yet). The integrating layer(s) provide(s) an insight into the whole content of a complex, multi-faceted, multi-layered structure (Fig. 8).
By connecting many diverse phenomena, multi-layered visuals will in most cases describe them in terms of different languages — economic, political, legal, technological etc. However, a vertical section view of a multilayered visual will always reveal interaction points where ideas and representations of one layer come into contact with other layers of reality. A multi-layered visual will merge various representations into a whole thanks to interaction points at different layers.
Practical application of multi-layered visualization can be demonstrated by a specific example. Driverless transportation is now rapidly progressing worldwide. According to the Skolkovo Foundation, Russia, driverless cars can account for 25 percent of all cars sold worldwide by 2035. As a result of their widespread use, the urban car fleet will decline by 60 percent, exhaust gases by 80 percent, and traffic accidents by 90 percent3. However, the development and introduction of driverless vehicles is a complex multi-sectoral problem which has a number of related sub-problems — economic, political, governance, legal, engineering and technological, infrastructure, security, fuel and energy, social etc. The range of problems for the development and introduction of driverless transportation could be represented by the following multi-layered diagram (Fig. 9):
To stress the principal point, multi-layered visuals are a promising form of schematization which allows to expressively visualize the object under study, make the related knowledge systemic and suggest new creative ideas to those who seek them. Multi-layered schematization could be used to make complex ontological, methodological and organizational charts. Meanwhile, multi-layered visualization should not be viewed as a “magic wand”: while allowing to systematize and make spectacular presentations of the available knowledge, it is by no means a substitute for an in-depth research or analytical study.
Conclusion
The author of that paper has developed and offered for practical use the graphic language Grafento 1 designed to solve analytical tasks in the domain of law. This manual contains graphemes (graphic language signs) and their meaning in the tabulated form. Number 1 means that what is proposed is the initial tentative version of the graphic language.
The Grafento 1 relies on the language of methodological schemes created by G. Schedrovitsky and his followers. A number of graphemes were borrowed from A.L. Yemelianov’s article “The Language of schematized images” [Yemelianov A.L., 2001: 414-459]. Graphic languages of this type can be used in legal research and legal education, as well as in the development of legal info charts, visualizations and presentations of various purpose.
The next step was the development of the Dictionary of Legal Analytical Graphics, a more advanced version of the graphic language in law which includes not only the “alphabet” but also graphic sentences, phrases, graphic descriptions and arguments. The Dictionary has samples of legal analytical schematizations of various purpose, some of which were created by students of the Legal Analytics course.
Finally, album “Legal Analytics in Definitions, Maps and Charts” can be regarded as the third step of advancing graphic language in the field of law. Its electronic version is available in the stock of HSE publications. Album brings together 200 of the most demanded schematizations in the field of legal analytics and the theory of state and law.
Like natural languages, the graphic language has a multitude of styles and sub-styles which, like its morphology and syntax, are not discussed in this paper. Those who are interested in this particular aspect may refer to William Bowman’s remarkable book “Graphic Communication” [Bowman W., Venda V, 1971] which describes the basic elements of a graphic language including dots, lines, colours, textures and where the author analyzes “graphic statements”, “phrases” and “intonations” and shows on numerous examples the wealth of graphical means to represent objects such as structures, organizations, systems, processes, dimensionalities etc.
Remarkably, apart from the graphic language in law, there are those created for other fields and practical applications — language of infographics, language of propaganda and campaigning, language of marketing etc.
Schematization and visualization in law are in constant progress to give birth to new forms, styles and fields of application. The graphic language in law is a new development which is actually at the stage of inception. Hence, everyone willing to work and think in this language can make an important contribution.
References
- Bekhterev 8., Arkhangelsky G. (2022) Mind Management: Solving Business Problems with Mind Maps. Moscow: Alpina, 312 p. (in Russ.)
- Bowman W., Venda V. (1971) Graphic Representation of Information. Moscow: Mir, 228 p. (in Russ.)
- Buzen T. (2014) The Superintellect. Minsk: Potpourri, 400 p. (in Russ.)
- Emelyanov A. L. (2001) Language of Schemes Images. In: Language of Activity Theory. O S. Anisimov (ed.). Moscow: Delo, pp. 414-459 (in Russ.)
- Isakov V.B. (2019) Speak in Schemes Language. Moscow: Norma, 144 p. (in Russ.)
- V. (2011) Logic and Structure of the Language. Moscow: Librokom, pp. 15-31 (in Russ.)
- Logunova O S. et al. (2015) Visualization of Research Activity Results: a manual. Magnitogorsk: State Technical University, 85 p. (in Russ.)
- Mrdulyash P. (2005) Operations with Schemes. Technicheskyi i igrovoy almanakh-Centaur. Technical and play almanac, no. 36, p. 41 (in Russ.)
- Nast D. (2008) The Effect of Visualization.: Eksmo, 254 p. (in Russ.)
- Pesina S.A. (2016) Philosophy of Language: a guide. Moscow: Nau- ka, pp. 51 -77 (in Russ.)
- Sibbet D. (2019) Visualize it! Howto Use Graphics, Stickersand Mind Maps for Teamwork. Moscow: Alpina, 280 p. (in Russ.)
- Ten YR (2009) Symbols of Russia and Foreign States: a textbook. Rostov: Phoenix, 336 p. (in Russ.)
- Yau N. (2013) The Art of Visualization in Business. How to Present Complex Information in Simple Images. Moscow: Mann, Ivanov and Farber, p. 21 (in Russ.)
- Zhukovsky VI., Pivovarov D. S. (1998) Intellectual Visualization of the Essence: a manual. Krasnoyarsk: University Press, 222 p. (in Russ.)
- Zinchenko A.P. (2004) A Guide to the Concepts and Schemes of Methodology of Organization and Management: a reader. Moscow: Delo, 208 p. (in Russ.)