This article is published under a Creative Commons license and not by the author of the article. So if you find any inaccuracies, you can correct them by updating the article.

Assessing regional populations of ground-nesting marine birds in the Canadian High Arctic


Mark Maftei
Shanti E. Davis
Mark L. Mallory
Published: April 7, 2015
Latest article update: Aug. 20, 2023
This article is published under the license


Abstract
The Queens Channel region of Nunavut is an ecologically distinct area within the Canadian High Arctic consisting of an extensive archipelago of small, low-lying gravel islands throughout which form several localized but highly productive polynyas. We used aerial survey and colony-monitoring data to assess regional- and colony-level fluctuations in the number of birds in this region between 2002 and 2013. Regional and colony-specific monitoring suggested that common eider (Somateria mollissima) numbers are increasing, while numbers of Arctic terns (Sterna paradisaea) may be in decline. Based on these data, we suggest that even infrequent comprehensive surveys are more useful than annual monitoring at specific sites in generating an accurate assessment of ground-nesting seabird populations at the regional level, and that dramatic fluctuations at individual colonies probably belie the overall stability of regional populations.
Keywords
Arctic tern, seabirds, common eider, Ground-nesting, High Arctic, Nunavut
Knowledge of the distribution and abundance of most avian species nesting in the Canadian High Arctic remains patchy and incomplete in part because of the extreme remoteness and large size of the region as well as the logistical difficulties inherent in conducting surveys there. Some catalogues of large seabird colonies, particularly cliff-nesting species, in the Canadian Arctic are available (Nettleship 1973; Mallory & Fontaine 2004), but species nesting in low densities or only in isolated areas of suitable habitat have probably been overlooked (Gaston et al. 2012). Current estimates of ground-nesting seabird populations in the Canadian Arctic are particularly uncertain due to partial or incomplete survey coverage, extrapolation from small sample sizes, and a general lack of understanding of how variability in local habitat suitability may affect annual numbers of breeders (Gaston et al. 2012). In the Arctic, mammalian predators exert strong predation pressure on ground-nesting birds (Birkhead & Nettleship 1995; Smith et al. 2010), and most species have adopted a strategy of nesting in low densities over large areas. This tendency makes most populations difficult to survey and monitor effectively, a problem further complicated by unpredictable changes in local abundance (Clark & Shutler 1999; Egevang & Frederiksen 2011) and the reduced detectability of cryptic or easily overlooked species (Meltofte 2001).
The ocean passage that extends from Penny Strait through Queens Channel to MacDougall Sound (hereafter collectively referred to as Queens Channel) contains an extensive archipelago of small, low-elevation gravel islands. The shallow bathymetry and strong tidal currents in this area lead to the formation of several localized and highly productive polynyas (Hannah et al. 2009), which provide important foraging habitat for many bird and mammal species (Stirling 1997). This region is unique within the Canadian High Arctic and is used by a large number of bird species which exploit the rich foraging opportunities provided by polynyas early in the breeding season when most of the surrounding water remains frozen (Mallory & Gilchrist 2003; Mallory & Fontaine 2004; Maftei et al. 2012). This area had already been recognized as an important breeding area for Ross's gull (Rhodostethia rosea) after the first nests in North America were found on the Cheyne Islands in north-western Queens Channel (MacDonald 1978), and more recent surveys have identified other islands in the area used by this species for nesting (Maftei et al. 2012). A partial survey of Queens Channel in 2002 and 2003 (Mallory & Gilchrist 2003) revealed that substantial numbers of Arctic terns (Sterna paradisaea) and common eiders (Somateria mollissima) also nest throughout the islands in this archipelago. The northernmost known North American colonies of Sabine's gull (Xema sabini) and the largest known ivory gull (Pagophila eburnea) colony are also found in the Queens Channel region. A more thorough understanding of the size, distribution and dynamics of ground-nesting seabird populations in this area is of critical importance in developing practical management and conservation measures for the region at a time of increasing interest in industrial development of the Arctic.
The objectives of this study were to (1) update and augment the Mallory & Gilchrist (2003) survey to examine potential breeding sites for marine birds in Queens Channel, and (2) assess the numbers and distribution of ground-nesting marine birds in this poorly known region.
Methods
Study area
We defined a study area extending between 75° N and 76°55′N and 102°40′W and 93°47′W, encompassing an archipelago of approximately 120 islands which run from southern Penny Strait through Queens Channel and MacDougall Sound into northern Barrow Strait. This area is bound by Bathurst Island to the west, Devon Island to the north-east and Cornwallis Island to the south-east (Fig. 1). After excluding islands that were very large (i.e., capable of supporting resident mammalian predators), those that were effectively extensions of much larger islands (i.e., would be joined by ice bridges for much of the year), and those that were covered at highest tides, we had 80 islands to choose from. We used ArcGIS software (version 10, Environmental Systems Research Institute, Redlands, CA) to compile topographic, land cover and digital elevation model maps of the study area, and from these data we selected our target islands to survey. These comprised sites that Mallory & Gilchrist (2003) had identified as important as well as sites that had similar physiographic features to those in the earlier study. We determined mean island elevation (m above sea level [asl]) and island area (ha) for these sites. Although elevation and area were correlated (rs31=0.89, p<0.001), we assessed these criteria separately. The region has numerous small polynyas in most years (Mallory & Gilchrist 2003), which are variable in annual size and shape (and which vary through the season), but islands in this study were generally 35±5 km (range 0–110 km) from typical polynya locations (polynyas from Hannah et al. 2009).

Surveys
We surveyed 30 islands in Queens Channel from a Bell 206 L4 helicopter on 19 and 23 June 2012 (Fig. 1). Seventeen of these islands had never been surveyed before, 10 had been previously surveyed on 16 July 2002 by Mallory & Gilchrist (2003), and one, Nasaruvaalik Island, has been surveyed and monitored with varying intensity of effort annually since 2002. While flying around the perimeter of small islands or transects over larger ones from an altitude of approximately 100 m, three observers independently recorded all birds seen on or in the immediate vicinity of each island, and the overall high count for each species was recorded. We also surveyed six islands on foot while searching for Ross's gull nests on the same dates as above. Observations from Nasaruvaalik Island were recorded on 25 June 2012 by three ground-based observers.
Assessment of regional populations
We assessed fluctuations in numbers of birds attending island colonies at the regional level by comparing the difference in observed numbers of birds at 10 islands surveyed in both 2002 and 2012 (Table 1). We also examined fluctuations in annual attendance at the colony level by comparing the variation in annual maximum and mean numbers for 25 regularly observed species over six years at Nasaruvaalik Island (Table 2). We calculated mean values based only on July observations to more accurately reflect the numbers of breeding birds which would be present and incubating at that time. The yearly maximum is a more accurate indication of the total number of birds (including non-breeders) using the island. For each year, we determined the total annual abundance representing the sum of the maximum high count for each of the 25 species as well as a total mean representing the mean of daily counts in July for each species (n=31 for all years). We then compared these values between years and across all six years. We also compared the per-year variation in annual maximum and mean observed numbers for Arctic terns and common eiders separately. Comparisons were conducted using Pearson r or Spearman rs. All means are presented±SE.
Table 1 Observed numbers of birds on islands in Queens Channel in July 2002 and June 2012. Bird species are as follows: red-throated loon (Gavia stellata; RTLO); brant (Branta hrota, BRAN); king eider (Somateria spectabilis; KIEI); long-tailed duck (Clangula hyemalis; LTDU); glaucous gull (Larus hyperboreus; GLGU); Sabine's gull (Xema sabini; SAGU); Ross's gull (Rhodostethia rosea; ROGU); black-legged kittiwake (Rissa tridactyla; BLKI); Arctic tern (Sterna paradisaea; ARTE); red phalarope (Phalaropus fulicarius; REPH); Baird's sandpiper (Calidris bairdii; BASA); parasitic jaeger (Stercorarius parasitica; PAJA); common raven (Corvus corax; CORA); snow goose (Chen caerulescens; SNGU); semipalmated sandpiper (Calidris pusilla; SESA); purple sandpiper (Calidris maritima; PUSA); snow bunting (Plectrophenax nivalis; SNBU); ivory gull (Pagophila eburnea; IVGU); black guillemot (Cepphus grylle; BLGU). | ||||||||||||||||||||
Map | Location |
| Survey year |
|
|
| Species observed 2002/2012 |
| ||||||||||||
# | N° | W° | Island | 2002 | 2012 | Species | Birds | % Change | RTLO | BRAN | COEI | KIEI | LTDU | GLGU | SAGU | ROGU | BLKI | ARTE | REPH | Other |
1 | 76.01 | 97.16 | Reid | X |
| 3 | 184 |
|
|
| 14 |
|
|
|
|
|
| 100 | 70 |
|
2 | 76.29 | 97.51 | South Cheyne | X |
| 5 | 782 | −67% | 2 |
| 164 |
| 10 | 6 |
|
|
| 600 |
|
|
|
|
|
|
| X | 10 | 467 |
| 2 | 60 | 175 | 60 |
| 11 | 2 | 4 |
| 50 | 100 | BASA(3) |
3 | 76.31 | 97.52 | Middle Cheyne | X |
| 4 | 227 | −41% | 2 |
|
|
|
|
|
|
|
| 212 | 11 | PAJA(2) |
|
|
|
|
| X | 4 | 135 |
| 2 |
| 50 |
|
| 2 |
|
|
|
| 81 |
|
4 | 76.33 | 97.52 | North Cheyne | X |
| 4 | 70 | +100% |
|
| 2 |
|
| 2 |
|
|
| 16 | 50 |
|
|
|
|
|
| X | 2 | 140 |
|
|
| 30 |
|
|
|
|
|
| 110 |
|
|
5 | 76.81 | 101.26 | Seymour | X |
| 0 | 0 |
|
|
|
|
|
|
|
|
|
|
|
|
|
6 | 76.68 | 99.73 | Harwood | X |
| 1 | 2 |
|
|
|
|
|
|
|
|
|
| 2 |
|
|
7 | 76.63 | 98.16 | North Hooker | X |
| 2 | 12 | +275% |
|
|
|
|
|
|
|
|
| 11 |
| CORA(1) |
|
|
|
|
| X | 3 | 45 |
|
| 23 | 21 |
|
| 1 |
|
|
|
|
|
|
8 | 76.61 | 98.10 | South Hooker | X |
| 4 | 118 | −74% |
|
| 13 |
| 3 |
|
|
|
| 100 | 2 |
|
|
|
|
|
| X | 3 | 68 |
|
|
| 65 |
|
| 2 |
|
|
| 1 |
|
|
9 | 76.55 | 97.72 | Irving | X |
| 3 | 176 | −110% |
|
| 12 |
|
| 24 |
|
|
| 140 |
|
|
|
|
|
|
| X | 4 | 84 |
|
| 1 | 50 |
|
| 31 |
|
|
|
|
| SNGO(2) |
10 | 76.49 | 97.12 | Hyde Parker | X |
| 2 | 42 |
|
|
| 34 |
|
|
|
|
|
| 8 |
|
|
11 | 76.35 | 96.22 | Assistance | X |
| 2 | 244 | −43% |
|
| 4 |
|
|
|
|
|
| 240 |
|
|
|
|
|
|
| X | 3 | 171 |
|
|
| 20 |
|
| 1 |
|
|
| 150 |
|
|
12 | 76.18 | 96.95 | Des Voeux | X |
| 1 | 2 | +1750% |
|
|
|
|
| 2 |
|
|
|
|
|
|
|
|
|
|
| X | 3 | 37 |
|
|
| 6 |
|
|
|
|
|
| 30 | 1 |
|
13 | 75.83 | 96.30 | Nasaruvaalik | X |
| 7 | 1417 | +11% | 3 | 6 | 375 |
|
|
| 30 |
|
| 900 | 100 | CORA(3) |
|
|
|
|
| X | 17 | 1579 |
| 3 | 175 | 400 | 20 | 8 | 2 | 60 | 8 | 520 | 350 | 22 | SESA(3); PUSA, CORA SNBU(2); IVGU, PAJA(1) |
14 | 75.79 | 96.56 | Crozier | X |
| 1 | 60 | −300% |
| 60 |
|
|
|
|
|
|
|
|
|
|
|
|
|
|
| X | 5 | 15 |
|
|
|
|
| 2 | 1 | 5 |
|
| 6 |
| PAJA(1) |
15 | 75.63 | 96.86 | Milne |
| X | 1 | 2 |
|
|
| 2 |
|
|
|
|
|
|
|
|
|
16 | 76.57 | 99.27 | Young Inlet | X |
| 2 | 180 |
|
| 120 |
|
|
|
|
|
|
| 60 |
|
|
17 | 76.60 | 101.80 | Mallory | X |
| 0 | 0 |
|
|
|
|
|
|
|
|
|
|
|
|
|
18 | 76.60 | 101.96 | Gilchrist | X |
| 0 | 0 |
|
|
|
|
|
|
|
|
|
|
|
|
|
19 | 75.54 | 97.21 | Kalivik |
| X | 7 | 86 |
| 2 |
| 9 | 1 | 1 |
| 1 |
|
| 65 | 7 |
|
20 | 75.49 | 97.23 | Emikutailaq |
| X | 7 | 383 |
|
|
|
|
| 1 | 9 | 10 | 2 |
| 350 | 7 | SNBU(4) |
21 | 75.39 | 97.53 | Chip |
| X | 1 | 2 |
|
|
| 2 |
|
|
|
|
|
|
|
|
|
22 | 75.35 | 97.59 | Big Neal |
| X | 4 | 18 |
| 2 | 12 |
|
|
|
|
|
|
|
|
| SNBU(3); PAJA(1) |
23 | 75.32 | 97.53 | Neal polynya |
| X | 4 | 141 |
| 2 |
| 130 |
| 8 | 1 |
|
|
|
|
|
|
24 | 75.31 | 97.50 | Little Neal |
| X | 0 | 0 |
|
|
|
|
|
|
|
|
|
|
|
|
|
25 | 75.25 | 97.16 | Truro |
| X | 2 | 7 |
|
|
| 4 |
|
| 3 |
|
|
|
|
|
|
26 | 75.27 | 97.84 | Outlier |
| X | 2 | 5 |
|
|
| 4 |
|
|
|
|
|
|
|
| PUSA(1) |
27 | 75.35 | 96.91 | Thomas Honey |
| X | 2 | 13 |
|
|
|
|
|
| 1 |
|
|
| 12 |
|
|
28 | 75.31 | 96.64 | Ikagguaq |
| X | 4 | 50 |
| 1 |
|
|
|
| 2 |
|
|
| 36 |
| BLGU(11) |
29 | 75.26 | 96.34 | Tadman |
| X | 3 | 5 |
|
|
|
| 2 | 2 |
|
|
|
|
|
| BLGU(1) |
30 | 75.23 | 96.37 | Little Tadman |
| X | 1 | 2 |
|
|
|
|
| 2 |
|
|
|
|
|
|
|
31 | 76.88 | 97.18 | Hornby |
| X | 4 | 145 |
|
| 5 | 65 |
|
|
|
|
|
| 60 | 15 |
|
32 | 76.90 | 96.97 | Russel |
| X | 3 | 262 |
|
| 2 | 60 |
|
|
|
|
|
| 200 |
|
|
33 | 76.66 | 96.70 | Cracroft |
| X | 4 | 300 |
|
| 12 | 180 |
|
| 8 |
|
|
| 100 |
|
|
34 | 76.64 | 96.54 | Toms |
| X | 4 | 189 |
|
| 8 | 170 |
|
| 5 |
|
|
| 6 |
|
|
35 | 76.62 | 96.46 | Kerr |
| X | 4 | 88 |
|
| 17 | 50 |
|
|
|
|
|
| 20 |
| PAJA(1) |
36 | 76.60 | 96.38 | Fairholme |
| X | 1 | 6 |
|
|
|
|
|
| 6 |
|
|
|
|
|
|
37 | 76.57 | 96.12 | Walrus |
| X | 2 | 6 |
|
|
| 4 |
|
|
|
|
|
|
|
| PAJA(2) |
Total observed | 3516 | 4451 | Avg. 3.3 | 1796 | ±277% | 7/7 | 66/259 | 570/817 | 0/80 | 13/10 | 34/51 | 30/67 | 0/12 | 0/520 | 2219/697 | 163/204 |
| |||
Table 2 Annual maximum and mean numbers of commonly observed species on Nasaruvaalik Island from 2007 to 2012. Boldface indicates maximum observed values across all six years. | |||||||||||||||||
| 2007 (na=37) | 2008 (na=62) | 2009 (na=43) | 2010 (na=52) | 2011 (na=87) | 2012 (na=60) | Across all years | ||||||||||
Species | Year | July | Year | July | Year | July | Year | July | Year | July | Year | July | Max | Max | July | SD ± | CVb |
| Max | Mean | Max | Mean | Max | Mean | Max | Mean | Max | Mean | Max | Mean |
| Year | Mean |
|
|
Red-throated loonc | 6 | 3 | 4 | 3 | 5 | 3 | 9 | 3 | 15 | 4 | 13 | 4 | 15 | 2011 | 3 | 1 | 20 |
Brantc | 48 | 5 | 15 | 6 | 92 | 40 | 100 | 21 | 80 | 10 | 180 | 50 | 180 | 2012 | 22 | 15 | 68 |
Snow goosed | 4 | 1 | 4 | 0 | 11 | 0 | 8 | 0 | 2 | 0 | 16 | 0 | 16 | 2012 | 0 | 2 | N/A |
Common eiderc | 200 | 91 | 400 | 205 | 400 | 288 | 440 | 188 | 800 | 249 | 600 | 268 | 800 | 2011 | 215 | 50 | 23 |
King eiderc | 60 | 24 | 18 | 1 | 7 | 1 | 50 | 1 | 130 | 1 | 150 | 1 | 150 | 2012 | 5 | 18 | 361 |
Long-tailed duckc | 65 | 14 | 40 | 20 | 51 | 26 | 30 | 12 | 120 | 25 | 50 | 17 | 120 | 2011 | 19 | 5 | 28 |
Glaucous gullc | 4 | 2 | 11 | 2 | 5 | 2 | 53 | 4 | 15 | 3 | 5 | 3 | 53 | 2010 | 3 | 3 | 99 |
Ivory gull | 0 | 0 | 2 | 1 | 1 | 1 | 1 | 0 | 4 | 2 | 1 | 0 | 4 | 2011 | 1 | 0 | 55 |
Sabine's gullc | 30 | 20 | 20 | 14 | 26 | 17 | 38 | 21 | 300 | 41 | 68 | 44 | 300 | 2011 | 26 | 14 | 52 |
Ross's gullc | 12 | 5 | 6 | 4 | 6 | 3 | 5 | 1 | 7 | 3 | 12 | 6 | 12 | '07/'12 | 4 | 1 | 17 |
Black-legged kittiwake | 160 | 47 | 30 | 2 | 6 | 1 | 30 | 0 | 48 | 5 | 520 | 21 | 520 | 2012 | 13 | 39 | 301 |
Arctic ternc | 402 | 275 | 750 | 250 | 500 | 374 | 500 | 333 | 900 | 583 | 700 | 403 | 900 | 2011 | 370 | 30 | 8 |
Parasitic jaegerc | 5 | 3 | 5 | 3 | 5 | 3 | 16 | 4 | 5 | 2 | 4 | 2 | 16 | 2010 | 3 | 1 | 19 |
Long-tailed jaeger | 2 | 2 | 2 | 1 | 3 | 1 | 5 | 1 | 10 | 2 | 6 | 2 | 10 | 2011 | 1 | 1 | 59 |
Pomarine jaeger | 2 | 0 | 2 | 2 | 2 | 1 | 26 | 7 | 2 | 1 | 2 | 1 | 26 | 2010 | 2 | 3 | 130 |
Peregrine falcon | 0 | 0 | 1 | 0 | 1 | 0 | 1 | 0 | 0 | 0 | 0 | 0 | 1 | N/A | 0 | 0 | N/A |
Red knot | 30 | 9 | 20 | 10 | 20 | 13 | 35 | 7 | 47 | 14 | 18 | 9 | 47 | 2011 | 10 | 3 | 27 |
Ruddy turnstone | 23 | 4 | 2 | 1 | 1 | 1 | 2 | 0 | 8 | 1 | 13 | 1 | 23 | 2007 | 1 | 3 | 213 |
Purple sandpiperd | 4 | 2 | 2 | 1 | 6 | 6 | 2 | 0 | 120 | 2 | 7 | 2 | 120 | 2011 | 2 | 10 | 472 |
Sanderling | 2 | 2 | 3 | 3 | 0 | 0 | 0 | 0 | 35 | 1 | 6 | 3 | 35 | 2011 | 1 | 3 | 248 |
Baird's sandpiper | 0 | 0 | 6 | 0 | 1 | 1 | 0 | 0 | 11 | 0 | 2 | 0 | 11 | 2011 | 0 | 2 | N/A |
Red phalarope | 18 | 7 | 16 | 6 | 14 | 3 | 7 | 2 | 160 | 10 | 2500 | 284 | 2500 | 2012 | 52 | 196 | 379 |
Common raven | 2 | 1 | 3 | 2 | 2 | 1 | 4 | 1 | 2 | 2 | 2 | 1 | 4 | 2010 | 1 | 0 | N/A |
Lapland longspur | 2 | 0 | 1 | 0 | 5 | 1 | 2 | 0 | 0 | 0 | 1 | 1 | 5 | 2009 | 0 | 1 | N/A |
Snow buntingd | 2 | 1 | 4 | 2 | 4 | 2 | 2 | 1 | 9 | 1 | 8 | 1 | 9 | 2011 | 1 | 1 | 52 |
Total | 1083 | 516 | 1368 | 537 | 1175 | 791 | 1378 | 607 | 2876 | 961 | 4906 | 1125 | 4906 |
| 755 |
|
|
aDays at site. bCoefficient of variation. cSpecies breeding in all years. dSpecies breeding in at least one year.
Results
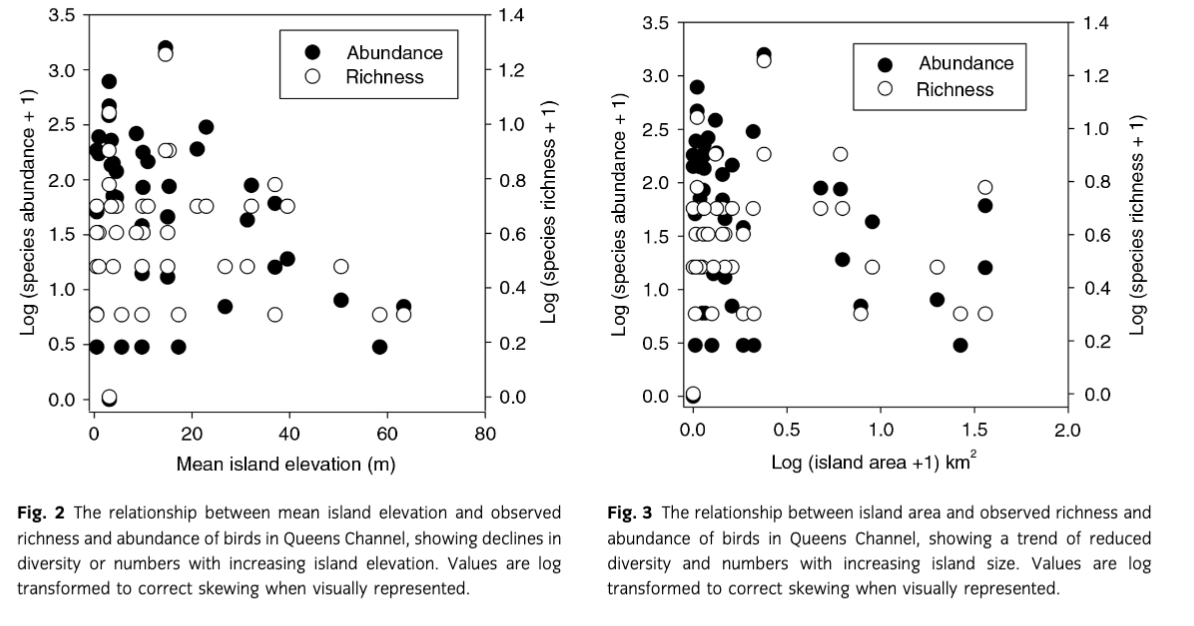
For each island surveyed (Table 1), we calculated species abundance and richness. The number of any species counted at a site tended to be higher for islands that had lower elevation (Fig. 2: rs=−0.23, n=30, p=0.071) and smaller island area (Fig. 3: rs=−0.26, p=0.048). However, species richness was not correlated with elevation or area (Figs. 2–4; all rs≤−0.13, all p>0.21). Species richness per island was low (mean 2.9±2.2, range=0–17), with a few notable exceptions: Nasaruvaalik (17 species), South Cheyne (10), Emikutailaq (8). These three islands also had the highest observed abundance of birds (n=1579, 467 and 383, respectively).
Surveys
We flew one-time surveys of 30 islands and observed 4451 individual birds of 20 species (Table 2). The most abundant and widely distributed species were Arctic terns (1546 individuals on 16 islands) and common eiders (1497 on 21 islands), whereas glaucous gulls (Larus hyperboreus), though far less numerous, were also broadly distributed (86 on 16 islands). Seventeen other species were also observed, including Sabine's gulls (Xema sabini; 60 on five islands), red phalaropes (Phalaropus fulicarius; 233 on seven islands), brant (Branta bernicla; 315 on 10 islands) and red-throated loons (Gavia stellata; 14 on seven islands). Five nesting pairs of Ross's gulls (14 on three islands) were also observed.
Assessment of regional populations
For survey data from 10 islands surveyed in both 2002 and 2012, there was a mean 185±177% increase per island in total birds observed over a decade (Table 1), but when this was weighted by the proportion of birds that each island represented out of the total birds from the 10 islands, this changed dramatically to a mean 1.2±1.3% decrease per island (or −0.12% per year). Not surprisingly, proportionately large increases in numbers of birds occurred on islands with relatively few birds in 2002—for example, the 18.5-fold difference for DesVoeux shown in Table 1—while large colonies showed much less change (e.g., Nasaruvaalik, with a 1.1-fold difference). The changes in total numbers of birds were driven by contrasting trends in the two most common species. Over the decade, data from one-day aerial surveys suggested that numbers of common eiders on the 10 islands increased overall by 43% (4.2±1.0% per island, weighted by initial colony size), with three islands that had no eiders in 2002 supporting colonies in 2012. In contrast, numbers of Arctic terns declined by 68% (6.9±3.2% per island), with changes in tern nesting distribution observed on the islands. Three islands supporting tern colonies in 2002 had none in 2012, while two islands had no terns in 2002, but had small colonies in 2012. Glaucous gulls showed an overall 50% increase (5.2±2.5% per island), with small colonies appearing on six islands in 2012, while two colonies from 2002 were not present in 2012.
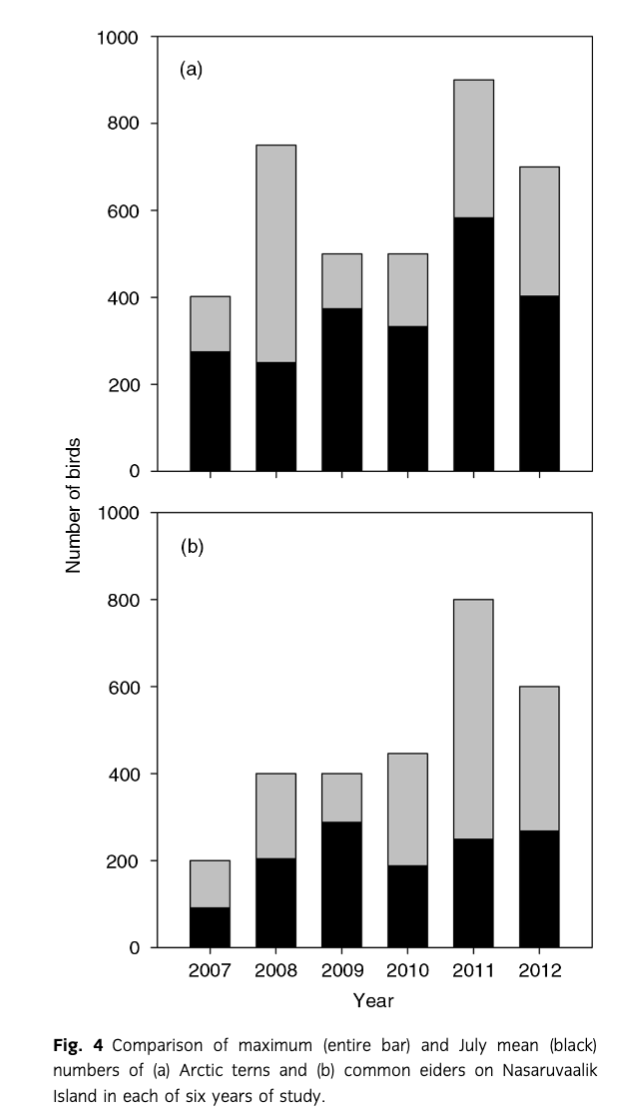
When we compared the information from the regional surveys a decade apart to the annual monitoring at Nasaruvaalik Island (using mean July numbers of birds), a different pattern emerged. The mean total number of birds observed daily at Nasaruvaalik Island in July increased 118% between 2007 and 2012 (r6=0.89, p=0.02), and would be even greater (353%) using maximum number of birds observed (Table 2). Daily counts of common eiders (rs=0.69, p=0.13), Arctic terns (rs=0.72, p=0.11) and glaucous gulls (rs=0.74, p=0.11) all suggested increases over this period (high positive correlations) although none of the patterns were statistically significant, likely a consequence of the small number of years studied. For 18 of 25 species (72%), highest counts occurred in the last two years of study (Table 2). The greatest variation tended to occur for species that rarely or never breed at Nasaruvaalik Island, and is attributable to counts from occasional occupation of the island by large flocks of non-breeding birds in some years (Table 2), such as red phalaropes (n=2500) in 2012. Non-breeding or failed breeders presumably also influenced counts of the main breeding species as well. For example, in some years, only one-third of the maximum count of terns or eider (Fig. 4) was presumed to be breeding, as indexed by the July mean count (which tended to reflect numbers of breeding birds on the island).
Discussion
Most of the islands supporting larger numbers of birds in Queens Channel share a suite of easily assessed physical and ecological characteristics; the greatest abundance and richness of nesting birds were found on small, low-lying islands and the two with the greatest abundance and diversity (South Cheyne, Nasaruvaalik) were situated beside open water (polynyas) during the early breeding season (Hannah et al. 2009). Such a habitat offers ground-nesting seabirds easy access to productive foraging areas (Maftei et al. 2012), and confers some degree of protection from mammalian predators (Mallory & Gilchrist 2003), probably because they are too small for mammals (e.g., mustelids, foxes) to reside year-round. Given the challenges of conducting surveys in the High Arctic, we recommend that a priori assessment and ranking of potential survey targets be conducted—effectively ecological niche factor analysis using even coarse habitat suitability models and GIS software (Danks & Klein 2002; Hirzel et al. 2002; Long et al. 2008), to maximize the likelihood of encountering birds while minimizing flight times and associated costs.
The snow cover conditions in the High Arctic can vary substantially across years, so discrete and limited patches of nesting habitat on small islands may be suitable for nesting in one year and unsuitable in the next (e.g., Meltofte 2001). As such, numbers of nesting birds at island sites are likely to vary significantly between years. Colonies of Arctic terns, for example (the most abundant species in our surveys), are known to fluctuate dramatically in numbers between years in response to local changes in habitat suitability, while the regional Queens Channel population may remain stable (e.g., Egevang & Frederiksen 2011). Similar patterns have been reported for a variety of other Arctic species (Falardeau et al. 2003; Gaston et al. 2005; Mallory & Forbes 2007; Moe et al. 2009). Long-term monitoring on Nasaruvaalik Island (Table 2) suggests that several species such as Ross's gulls, Sabine's gulls, brant and red phalaropes may defer breeding in years when regional conditions are sub-optimal, or may nest on neighbouring islands where local conditions are favourable (e.g., Hatch 2002; Levermann & Tøttrup 2007; Lewis et al. 2013), and our observations of banded Ross's gulls suggest that individuals move between nesting islands from year to year and probably also skip breeding seasons in response to local conditions (unpubl. data). In some years, large numbers of adult red phalaropes and brant congregating in feeding flocks at some island sites (Table 2) during the middle of the breeding season probably indicate widespread breeding deferral or failure by these species at the regional level (MacDonald et al. 1998; Latour et al. 2005).
Ground-nesting seabirds in the Queens Channel area are particularly dependent on ready access to open water to forage. In 2012, the distribution of open water (i.e., polynyas) during surveys was clearly different than predictions based on the polynya centres derived from Hannah et al. (2009), which would influence the suitability of neighbouring islands for nesting birds. Since ground-nesting marine birds in the High Arctic appear to be plastic in their fidelity to specific breeding sites within a larger region, and are strongly influenced by interannual fluctuations in ice cover and its effect on both food availability and predation risk (Egevang et al. 2004; Egevang & Frederiksen 2011; Maftei et al. 2012), future surveys in similar habitat would likely benefit from using current satellite imagery of sea ice and snow cover to prioritize survey targets based on local conditions at the time that surveys are being conducted.
Detectability is a major factor that limits the accuracy of estimates of regional populations of some ground-nesting species. Some species can be difficult to detect even during ground-based surveys, and are probably drastically under-represented in aerial surveys. For example, female eiders are highly cryptic and may remain undetected on their nests even when closely approached on foot. In 2012 a one-time aerial survey of Nasaruvaalik Island recorded approximately 200 common eiders, and daily high counts made by ground-based observers over the course of the entire breeding season never exceeded 600 individuals. Thorough searches, however, found 799 nests, indicating that more than 1000 individuals used this island in that year (see also Falardeau et al. 2003). A substantial proportion of these individuals went undetected: 33 and 78% during ground-based and aerial surveys, respectively. Highly cryptic species such as eiders are unlikely to be accurately represented in one-time surveys, and extrapolations of regional populations based on such counts would likely compound this uncertainty. Even conspicuous species may be significantly over- or underestimated in one-time surveys depending on their daily pattern of attendance at colony sites. For example, numbers of nesting Arctic terns can be difficult to assess (Egevang & Frederiksen 2011), and daily average colony counts of terns conducted simultaneously by multiple observers on Nasaruvaalik Island sometimes differed between consecutive days by a factor of four or more, even during incubation when attendance would be presumed to be fairly consistent (M. Mallory, unpubl. data).
Despite these challenges with survey protocols, two important results from our work were that the common eider breeding population appears to be increasing in this region, while Arctic tern populations appear to be declining. Increasing eiders near our site is consistent with recent population increases found in West Greenland (Merkel 2010). Eiders from Queen's Channel probably overwinter in the same region as eiders from northern West Greenland (Mosbech et al. 2006), so the recent declines in the numbers of eiders harvested during the winter may explain why our breeding population has increased approximately three-fold in six years. For terns, population tracking is more difficult because breeding sites can shift within a region (Egevang & Frederiksen 2011). Indeed, our results were similar to those from Greenland, where colony-specific annual variability in counts was high for small colonies, but much lower for large colonies and for regional populations (Egevang & Frederiksen 2011). While numbers of terns have fluctuated at our main site (Nasaruvaalik Island), regionally we found a pattern of decline, consistent with other reports we have heard anecdotally from local hunters in the High Arctic and along western Hudson Bay (M. Mallory, unpubl. data), and from limited results elsewhere in Nunavut (e.g., Gilchrist & Robertson 1999).
Our surveys in 2012 combined with the results obtained by Mallory & Gilchrist (2003) decade earlier confirm that the Queens Channel region is an important breeding area for a variety of species (Mallory & Fontaine 2004), but there is substantial interannual variability in attendance at island colonies. Based on our observations, we conclude that partial surveys and extrapolations from those are unlikely to accurately reflect regional populations of ground-nesting species, and should only be used with caution in assessing regional trends in abundance. Comprehensive regional surveys, while not without limitations, provide more accurate and reliable breeding population trend estimates than extrapolations based on annual monitoring of specific sites or partial samples of suitable habitat. Although islands with particularly large colonies of certain species (e.g., Nasaruvaalik Island for Arctic terns and common eiders) may prove useful as general indicators of regional populations if monitored annually, they too are subject to significant annual fluctuations in attendance, and site-specific trends should not be assumed to reflect regional ones.
Of the 37 islands surveyed to date in Queens Channel, three in particular—Emikutailaq (75°29′N, 97°14′W), South Cheyne (76°29′N, 97°52′W) and Nasaruvaalik (76°49N′, 96°18′W)—support an unusually high abundance and richness of birds. Nasaruvaalik Island and its adjacent polynya may be one of the most important breeding and foraging sites for birds in the entire region, and supports one of the highest diversities of regularly occurring species (28) recorded at this latitude anywhere in the North American Arctic.
Acknowledgements
We thank all of the field crews who have participated in the Nasaruvaalik Island project since 2007. Financial and logistic support was provided by the Canadian Wildlife Federation, Environment Canada (Canadian Wildlife Service, Science & Technology Branch), Natural Resources Canada (Polar Continental Shelf Program), the Nasivvik Program, the Natural Sciences and Engineering Research Council, Acadia University and Carleton University.
References
- Birkhead T.R. & Nettleship D.N. 1995. Arctic fox influence on a seabird community in Labrador: a natural experiment. Wilson Bulletin 107, 397–412.
- Clark R.G. & Shutler D. 1999. Avian habitat selection: pattern from process in nest-site use by ducks? Ecology 80, 272–287.
- Danks F.S. & Klein D.R. 2002. Using GIS to predict potential wildlife habitat: a case study of muskoxen in northern Alaska. International Journal of Remote Sensing 23, 4611–4632. Publisher Full Text
- Egevang C. & Frederiksen M. 2011. Fluctuating breeding of Arctic terns (Sterna paradisaea) in Arctic and High-Arctic colonies in Greenland. Waterbirds 34, 107–111. Publisher Full Text
- Egevang C., Kampp K. & Boertmann D. 2004. The breeding association of red phalaropes with Arctic terns: response to a redistribution of terns in a major Greenland colony. Waterbirds 27, 406–410.
- Falardeau G., Rail J.-F., Gilliland S. & Savard J.-P.L. 2003. Breeding survey of common eiders along the west coast of Ungava Bay, in summer 2000, and a supplement on other nesting aquatic birds. Technical Report Series 405. Quebec City: Canadian Wildlife Service.
- Gaston A.J., Gilchrist H.G. & Hipfner J.M. 2005. Climate change, ice conditions and reproduction in an Arctic nesting marine birds: Brunnich's guillemot (Uria lomvia L.). Journal of Animal Ecology 74, 832–841. Publisher Full Text
- Gaston A.J., Mallory M.L. & Gilchrist H.G. 2012. Populations and trends of Canadian Arctic seabirds. Polar Biology 35, 1221–1232. Publisher Full Text
- Gilchrist H.G. & Robertson G.J. 1999. Population trends of gulls and Arctic terns nesting in the Belcher Islands, Nunavut. Arctic 52, 325–331. Publisher Full Text
- Hannah C.G., Dupont F. & Dunphy M. 2009. Polynyas and tidal currents in the Canadian Arctic Archipelago. Arctic 62, 83–95. Publisher Full Text
- Hatch J.J. 2002. Arctic tern (Sterna paradisaea). The birds of North America 707. Philadelphia, PA: The Birds of North America.
- Hirzel A.H., Hausser J., Chessel D. & Perrin N. 2002. Ecological-niche factor analysis: how to compute habitat-suitability maps without absence data? Ecology 83, 2027–2036.
- Latour P.B., Machtans C.S. & Beyersbergen G.W. 2005. Shorebird and passerine abundance and habitat use at a High Arctic breeding site: Cresswell Bay, Nunavut. Arctic 58, 55–65.
- Levermann N. & Tottrup A.P. 2007. Predator effects and bahavioral patterns in Arctic terns (Sterna paradisaea) and Sabine’s gulls (Xema sabini) during a failed breeding year. Waterbirds 30, 417–420.
- Lewis T.L., Ward D.H., Sedinger J.S., Reed A. & Derksen D.V. 2013. Brant (Branta bernicla). In A. Poole (ed.): The birds of North America online. Ithaca, NY: Cornell Lab of Ornithology. Accessed on the internet at http://bna.birds.cornell.edu/bna/species/337 on 15 August 2014
- Long P.R., Zefania S., French-Constant R.H. & Szekely T. 2008. Estimating the population size of an endangered shorebird, the Madagascar plover, using a habitat suitability model. Animal Conservation 11, 118–127. Publisher Full Text
- MacDonald S. 1978. First breeding record of Ross's gull in Canada. Proceedings of the Colonial Waterbird Group 2, 16.
- MacDonald S.D., Reed A. & O'Briain M. 1998. Breeding, moulting and site fidelity of Brant (Branta bernicla) on Bathurst and Seymour islands in the Canadian High Arctic. Arctic 51, 350–360.
- Maftei M., Davis S.E., Jones I.L. & Mallory M.L. 2012. Breeding habitats and new breeding locations for Ross's gull (Rhodostethia rosea) in the Canadian High Arctic. Arctic 65, 283–288. Publisher Full Text
- Mallory M.L., Boadway K.A., Davis S.E. & Maftei M. 2011. Breeding biology of Sabine's gull (Xema sabini) in the Canadian High Arctic. Polar Biology 35, 335–344. Publisher Full Text
- Mallory M.L. & Fontaine A.J. 2004. Key marine habitat sites for migratory birds in Nunavut and the Northwest Territories. Occasional Paper 109. Ottawa: Canadian Wildlife Service.
- Mallory M.L. & Forbes M.R. 2007. Does sea ice constrain the breeding schedules of High Arctic northern fulmars? Condor 109, 894–906.
- Mallory M.L. & Gilchrist H.G. 2003. Marine birds breeding in Penny Strait and Queens Channel, Nunavut, Canada. Polar Research 22, 399–403. Publisher Full Text
- Meltofte H. 2001. Wader population censuses in the Arctic: getting the timing right. Arctic 54, 367–376. Publisher Full Text
- Merkel F.R. 2010. Evidence of recent population recovery in common eiders breeding in western Greenland. Journal of Wildlife Management 74, 1869–1874. Publisher Full Text
- Moe B., Stempniewicz L., Jakubas D., Angelier F., Chastel O., Dinessen F., Gabrielsen G.W., Hanssen F., Karnovsky N.J., Ronning B., Welcker J., Wojczulanis-Jakubas K. & Bech C. 2009. Climate change and phenological responses of two seabird species breeding in the High-Arctic. Marine Ecology Progress Series 393, 235–246. Publisher Full Text
- Mosbech A., Gilchrist G., Merkel F., Sonne C., Flagstad A. & Nyegaard H. 2006. Year-round movements of northern common eiders Somateria mollissima borealis breeding in Arctic Canada and West Greenland followed by satellite telemetry. Ardea 94, 651–665.
- Nettleship D.N. 1973. Seabird colonies and distributions around Devon Island and vicinity. Arctic 27, 95–103.
- Smith P.A., Elliott K.H., Gaston A.J. & Gilchrist H.G. 2010. Has early ice clearance increased predation on breeding birds by polar bears? Polar Biology 33, 1149–1153. Publisher Full Text
- Stirling I. 1997. The importance of polynyas, ice edges, and leads to marine mammals and birds. Journal of Marine Systems 10, 9–21. Publisher Full Text
Related Articles
Aga Nowak
Andy Hodson