This article is published under a Creative Commons license and not by the author of the article. So if you find any inaccuracies, you can correct them by updating the article.

Changes in meltwater chemistry over a 20-year period following a thermal regime switch from polythermal to cold-based glaciation at Austre Brøggerbreen, Svalbard


Aga Nowak
Andy Hodson
Published: Oct. 23, 2014
Latest article update: Aug. 22, 2023
This article is published under the license


Abstract
Our long-term study gives a rare insight into meltwater hydrochemistry following the transition of Austre Brøggerbreen from polythermal to cold-based glaciation and its continued retreat. We find that the processes responsible for ion acquisition did not change throughout the period of records but became more productive. Two regimes before and after July/August 2000 were identified from changes in solute concentrations and pH. They resulted from increased chemical weathering occurring in ice-marginal and proglacial environments that have become progressively exposed by glacier retreat. Carbonate carbonation nearly doubled between 2000 and 2010, whilst increases in the weathering of silicate minerals were also marked. In addition, the end of ablation season chemistry was characterized by reactions in long residence time flow paths like those in subglacial environments, in spite of their absence in the watershed. Furthermore, the retreat of the glacier caused the sudden re-routing of meltwaters through its immediate forefield during 2009, which more than doubled crustal ion yields in this particular year and influenced chemical weathering in 2010 regardless of a low water flux. Such a “flush” of crustally derived ions can be meaningful for downstream terrestrial and marine ecosystems. We therefore find that, during glacier retreat, the recently exposed forefield is the most chemically active part of the watershed, making high rates of weathering possible, even when ice losses have caused a switch to cold-based conditions with no delayed subglacial drainage flowpaths. In addition, the drainage system reorganization events result in significant pCO2 depletion in an otherwise high pCO2 system.
Keywords
Climate change, High Arctic, Bayelva, meltwater geochemistry, glacier retreat, chemical weathering in glacierized catchment
Changes in the thermal regime of many High-Arctic glaciers are occurring in response to climate forcing (see Symon et al. 2005). In Svalbard, this has caused a loss of temperate basal ice and a shift towards cold-based conditions since the early 1900s (e.g., Hodgkins et al. 1999; Bælum & Benn 2011). The long-term biogeochemical response of such glacier thermal regime change is yet to be documented, which is a surprising oversight given the attention that is being given to the response of the High Arctic to changes in air temperature, precipitation (e.g., Førland et al. 2009), glacier retreat (Solomon et al. 2007) and permafrost degradation (e.g., Westermann et al. 2011). One can argue that there is no need for a long-term hydrochemistry study since modelled hydrological change due to warming climate could be potentially integrated with existing data from various glacial environments (e.g., Tranter, Huybrechts et al. 2002). This might then result in a prediction of watershed response to climatic changes if weathering environments remain similar throughout. However, it is becoming apparent that the weathering environments change drastically during the transition from polythermal to cold-based thermal conditions at the bed of Arctic glaciers, because subglacial sediments become inaccessible to dilute, chemically aggressive surface meltwaters (e.g., Rutter et al. 2011). Therefore, subglacial weathering environments, wherein a range of microbially mediated and inorganic reactions typically cause significant solute acquisition by meltwaters (e.g., Skidmore et al. 2002, 2005; Tranter et al. 2005; Mitchell et al. 2013), are effectively removed from the watershed biogeochemical cycle. Paired catchment studies of a cold-based and an adjacent polythermal-based glacier (Austre Brøggerbreen and Midtre Lovénbreen, respectively) clearly demonstrated these differences in Svalbard. In short, greater solute export and more evidence of microbially mediated nutrient cycling were apparent at Midtre Lovénbreen (see Irvine-Fynn & Hodson 2010 and Wynn et al. 2006) yet absent at Austre Brøggerbreen, at least during the peak of the runoff season (Hodson et al. 2002; Krawczyk et al. 2003).
Studies that include inorganic weathering processes within High-Arctic watersheds provide knowledge about chemical denudation and give estimates of solute yields entering High-Arctic fjords (see, e.g., Hodson et al. 2000; Krawczyk et al. 2003; Krawczyk & Pettersson 2007; Krawczyk & Bartoszewski 2008). The matter whether such research, based upon one or at most two consecutive ablation seasons, is sufficient and representative of a long-term changes has been somehow overlooked. Clearly, if the glaciers' mass balance changes will cause a shift towards cold-based conditions, then the timing, magnitude and composition of solute transfer into fjords will also change. Furthermore, a recent study by Nowak & Hodson (2013) on 35 years of hydrology in the watershed occupied by Austre Brøggerbreen showed that the simple concept wherein warming means more glacial melt and therefore more meltwater discharge into fjords simply does not apply. Instead the relationship between glacier retreat and runoff flux turned out to be more complicated, dependent upon many variables and did not result in a direct, significant increase in water discharge. The role of rainfall and its storage in the geochemically reactive active layer of the glacier forefield was one of the most important reasons for masking the impact of glacial retreat upon watershed hydrology. The question therefore remains—what is the real and measured hydrochemical response (if any) of cold-based systems as they undergo further response to climate-driven deglaciation?
Therefore, we present here a case study of biogeochemistry in the watershed of the river Bayelva, incorporating solute concentrations and fluxes over the past 20 years. Such a data set gives a unique insight into hydrochemistry of a glacierized catchment where, due to glacier retreat, its thermal regime switched from polythermal (Orvin 1934; Hagen & Sætrang 1991) to predominantly cold based (Hodson et al. 1998a). Furthermore, datasets covering more than two ablation seasons allow investigation of whether cold-based glaciers in the High Arctic are in fact relatively inactive in terms of chemical weathering, due to the lack of subglacial weathering environments and short water residence times of surface runoff.
This research along with hydrological change in the Bayelva catchment over the past 35 years (Nowak & Hodson 2013) is part of a comprehensive study on the response of a High-Arctic watershed to changing climate, and is followed by examination of the characteristics of various micro-catchments existing within that watershed in Nowak & Hodson (2014).
Location
The study was undertaken in the watershed of Bayelva (on the peninsula Brøggerhalvøya) in Svalbard (Fig. 1). The sampling site (BAY) was located at 78.9335 N, 11.838 E next to a crump weir established by the Norwegian Water Resources and Energy Administration (NVE) in 1989.
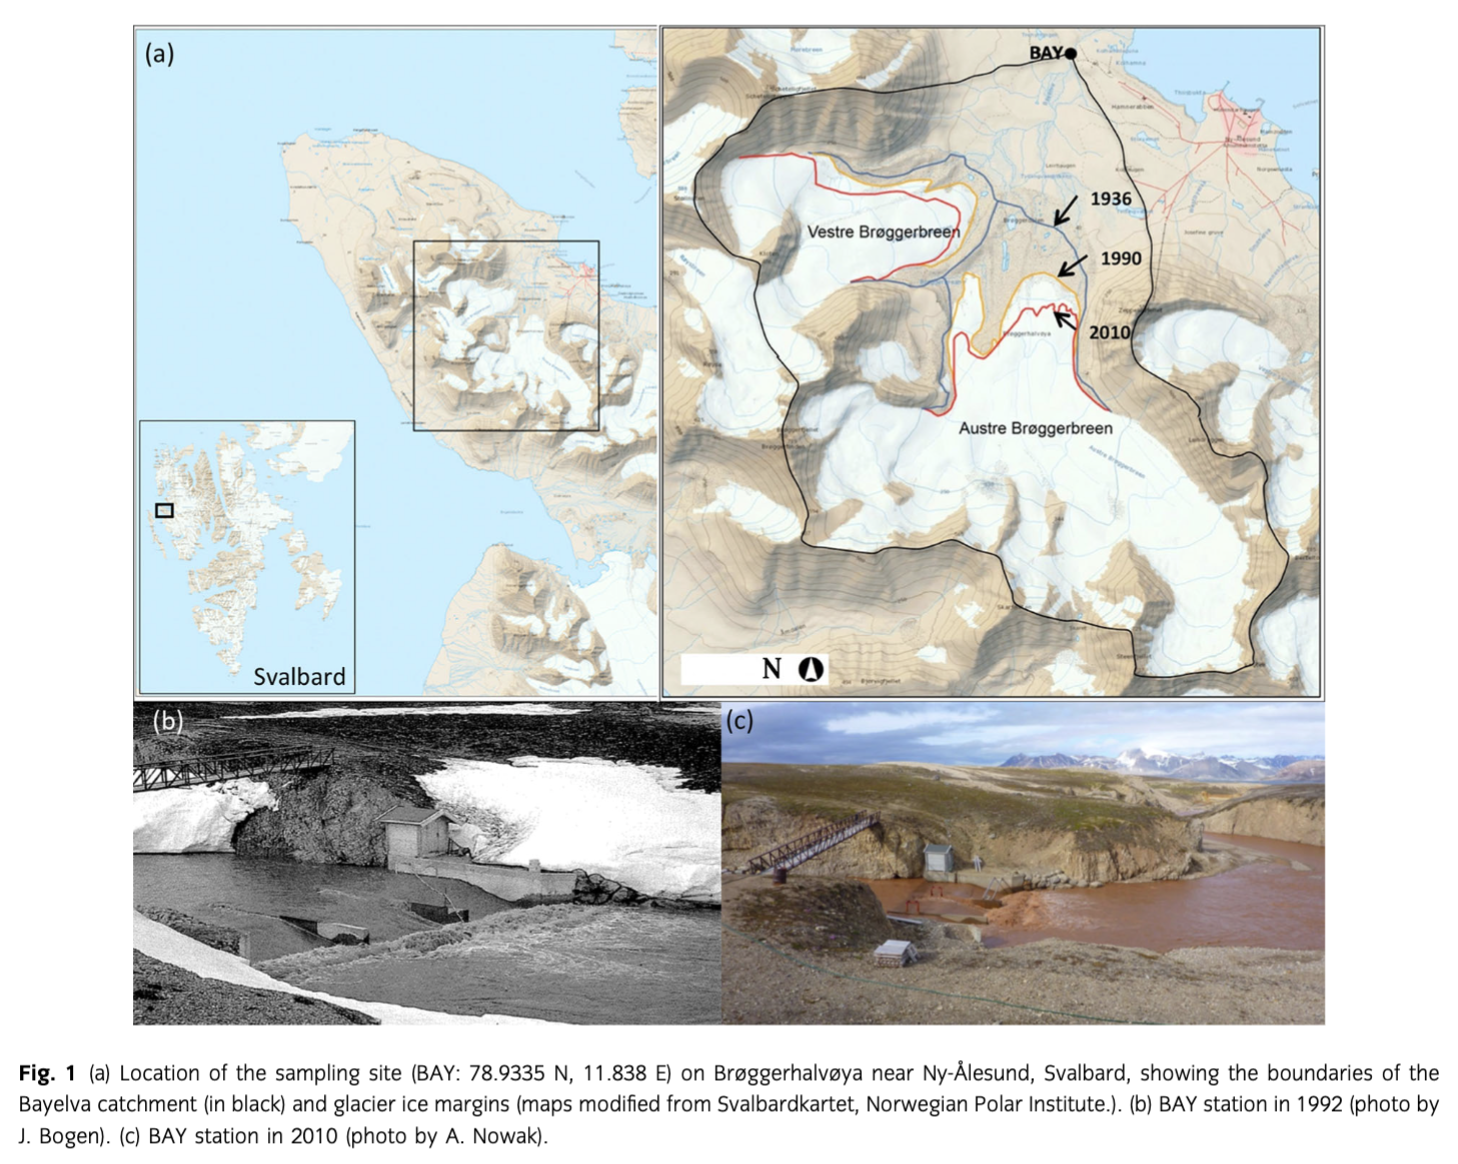
The catchment has received considerable amount of research interest over the past 35 years and is one of the best described in Svalbard. Details are given in Nowak & Hodson (2013) and Hodson et al. (2002). Briefly, the watershed covers 32 km2 (elevation range 4–742 m a.s.l.) and is circa 50% glacierized by two retreating, cold-based, valley glaciers Austre and Vestre Brøggerbreen. Their retreat was documented by the Norwegian Polar Institute and resulted in the loss of 1.86 km2 (Austre) and 1.08 km2 (Vestre) of ice at the glacier terminus between 1936 and 2010 (svalbardkartet.npolar.no; Fig. 1). Austre Brøggerbreen is by far the better known glacier. According to ground penetrating radar and thermistor data (Hagen & Sætrang 1991; Hagen et al. 1991), its transition to cold-based thermal conditions most likely occurred just prior to the start of this study (1991). Beforehand, a thin, temperate ice was detectable at the bed of the upper accumulation area, but no hydrological connections between this ice and the proglacial streams were found during a number of investigations in the early 1990s (see Hodson et al. 1998b). Further, a high frequency radar profile described by Bjørnsson et al. (1996) found no evidence for temperate ice. By contrast, far greater ice thicknesses, a major subglacial channel and an artesian type discharge of glacier-fed groundwater are described at the site during the 1930s by Orvin (1934). These conditions therefore imply that the discharge of subglacial meltwaters from a temperate basal ice layer occurred whilst the glacier was still close to its Little Ice Age limit.
Meltwaters from both glaciers are presently discharged through quaternary moraines onto a constrained sandur, consisting mostly of boulders and gravel with only patches of sand and silt (Bogen & Bønsnes 2003) to create Bayelva, and are then eventually conveyed through a well-defined rock channel into Kongsfjorden (Fig. 1b, c). Unlike the glacierized part of the catchment, there have been few changes in the glacier forefield beyond the Little Ice Age moraine limit, although changes in the hydrology of the catchment's permafrost have been discussed as a consequence of the increasing depth of the active layer by Westermann et al. (2011) and Nowak & Hodson (2013). The geology of the watershed consists of Carboniferous and Permian sedimentary deposits that show evidence of being deposited in shallow marine areas (calcareous and dolomitic beds). The catchment is composed of both carbonate and silicate minerals. Therefore, southern and eastern part consists of red sandstones, conglomerates, quartzite, phyllite, dolomite, limestone while northern and western part also includes Tertiary sandstone, shale and coal (Orvin 1934; Challinor 1967; Hjelle 1993; Bruland & Hagen 2002). Hence, a mixture of these sedimentary and metamorphosed sequences is being exposed by glacier retreat after advection and erosion by the glacier when it was polythermal at its base.
The annual mean (corrected for catch errors) precipitation in the catchment during the past 35 years was just under 540 mm while the mean June–October rainfall was about 157 mm (Nowak & Hodson 2013).
Methods
Hydrological and mass balance monitoring
Hydrological monitoring of Bayelva has been carried out continuously since 1989 by NVE at the gauging station (BAY) described above. Errors in the discharge calculations were estimated by Skretteberg (1991) and are thought to be less than 5%. The position of the station ca. 2.5 km from both glaciers allows determination of runoff from the whole catchment. The meteorological conditions as well as the hydrology of Bayelva during the past 35 years were explored in detail by Nowak & Hodson (2013).
The mass balance measurements of Austre Brøggerbreen have been conducted by the Norwegian Polar Institute since 1966 and they are described in detail by Nordli & Kohler (2003), Kohler et al. (2007) and Kohler (2010).
Runoff sampling
Sampling of meltwater was undertaken at the BAY station (Fig. 1) during ablation seasons of 1991, 1992, 2000, 2009 and 2010 (Table 1). Hodson et al. (1998a) and Tranter et al. (1996) showed that variations in electrical conductivity in meltwater are muted in the Bayelva catchment due to 24 hours of daylight and the lack of concentrated runoff from a subglacial drainage system. Hence, twice daily samples were not necessary for describing the seasonal evolution of the streamwater chemistry. We therefore used a daily sampling interval for the beginning of the runoff season, and a two-day interval thereafter (following the initial snowmelt phase). Samples were collected using a 500 mL polyethylene bottle pre-rinsed three times with meltwater before sampling. The samples were then filtered within 12 hours of collection through a 0.45 µm cellulose nitrate filter paper (Whatman, Kent, UK) using a Nalgene filtration unit (Thermo Scientific, Waltham, MA, USA). Filtered samples were then placed in 60 mL sterile polypropylene bottles with no air and stored in +4°C for up to 3 months until the analyses (see below). Contamination of samples by the filtration process was examined by the use of deionized water blanks. No contaminants were detected.
Analytical methods
Analytical methods for samples collected in 1991, 1992 and 2000 were described by Hodson et al. (2002) and Hodson et al. (2005). Briefly, pH was determined post-filtration using a 60 mL sample stored in the dark at 4°C with no air present and within 10 days from collection using Orion (Thermo Scientific) or WPA (Cambridge, UK) portable pH meters with low ionic strength electrode calibrated with pH buffers 4 and 7. The precision of the measurements was ±0.1 pH unit. NO3−, Cl− and were determined by Dionex DX-100 ion chromatography (Thermo Scientific). Finally, major cations such as Ca2+, Mg2+, Na+ and K+ were determined by atomic absorption spectrometry and silica was determined using a manual molybdenum blue method (APHA, AWWA & WEF 1995). The precision errors of all methods were below 5%.
Samples collected in 2009 and 2010 were determined as follows. Sample pH was measured directly after collection using a handheld pH meter (VWR, Radnor, PA, USA). Calibration of the electrode was carried out daily with fresh buffers 4 and 7 at the beginning of the ablation season and 7 and 10 after initial snowmelt phase. The precision of the pH meter was ±0.01 pH unit and the electrode efficiency was always above 95%. Total alkalinity (HCO3−) was determined directly after sample collection by acidimetric titration of 25 mL sample with 10 mmol HCl to the end point pH of 4.5 (APHA, AWWA & WEF 2005) and used to validate charge balance calculations of HCO3− (Wolf-Gladrow et al. 2007) when all the ions were analysed (see below). In addition, charge balance calculations were also used to determine HCO3− concentrations in samples collected in years 1991, 1992 and 2000. Concentrations of major ions (Ca2+, Mg2+, Na+, K+, Cl−, ) and nutrients (NO3−, ) were determined using Dionex ICS90 ion chromatography. The detection limit was 0.001 mg/L and precision errors of all analyses were below 5%, no was detected. A Skalar wet chemistry nutrient analyser (Breda, The Netherlands) was used to determine concentration of dissolved silica (Si) using the same colourimetric principle as the manual molybdenum blue method. The precision errors of all analyses were also below 5%.
Therefore, the above analyses allowed for direct comparison of all data collected between 1991 and 2010, with the exception of pH. The consequences of the pH measurement routine used in 1991, 1992 and 2000 being different to that used in 2009 and 2010 will be explored in the results section.
Solute provenance and speciation of ions
Solutes were separated into sea-salt (hereafter ssX) and crustal (hereafter *X) derived components. First, the assumption was made that due to the watershed geology all Cl− ions were of sea-salt provenance. Therefore, the sea.salt components of the ions were calculated from standard marine ratios of ions to Cl− in seawater (see Holland 1978). Second, the crustal derived component was calculated by the subtraction of sea-salt derived ion from its total concentration. In addition, the proportion of derived from atmospheric aerosols was calculated after Hodson et al. (2000) and deducted along with the ss from the total concentrations to create rock and microbially derived sulphate (*).
In order to better explore the weathering processes occurring in the proglacial environment of Brøggerbreen glaciers, the WEB-PHREEQ programme (www.ndsu.nodak.edu/webphreeq) was used to simulate chemical reactions, ions speciation and saturation indices of pCO2 and various rock types present in the catchment.
Solute yields and fluxes
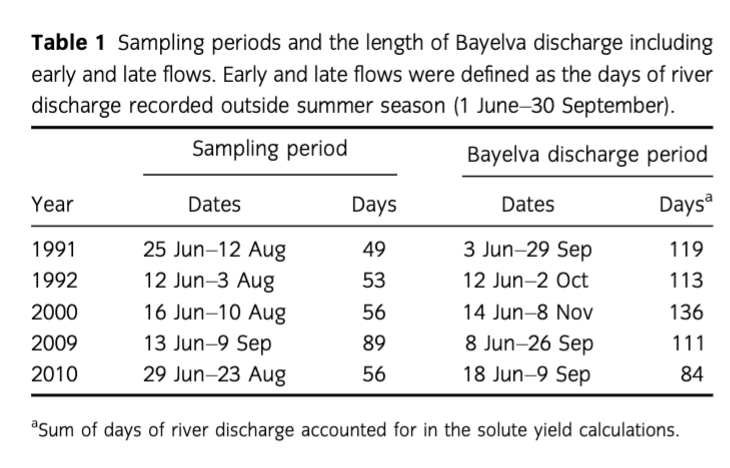
Ions fluxes (g/day) and yields (kg/km2a) were calculated according to Hodson et al. (2005). Therefore, ion fluxes were calculated following Eqn. 1 as the sum of daily river discharge and ion concentration, whereas yields were determined as fluxes corrected for the area of the catchment (32 km2) and the entire duration of river discharge (Table 1).
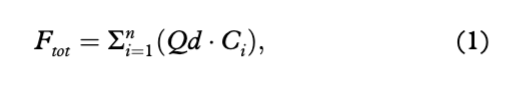
where Ftot is the total flux of species of interests (g/day), Qd is the total daily discharge of Bayelva (m3/day) and Ci– Concentration of a single daily sample (mg/L).
The daily concentrations of ions on days when the sample was not collected were estimated by linear interpolation. Furthermore, missing solute fluxes at the very beginning and the end of each ablation season were calculated from daily river discharge volumes and the volume weighted mean (hereafter VWM) concentration of each ion of interest. The VWM concentrations were estimated from either the first or the past 10 days of the observation period and calculated according to Eqn. 2.
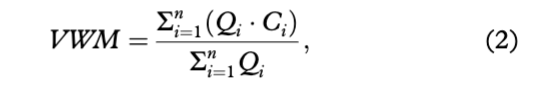
where VWM is the concentration of species of interest (mg/L), Qi is the Bayelva discharge at the time of sampling (m3/s) and Ci is the concentration of a single daily sample (mg/L).
Finally, Bayelva discharge data collected by NVE at BAY site were used to estimate the length of ablation season during each year of interest and calculate the runoff flux.
Results
Hydrological and mass balance monitoring
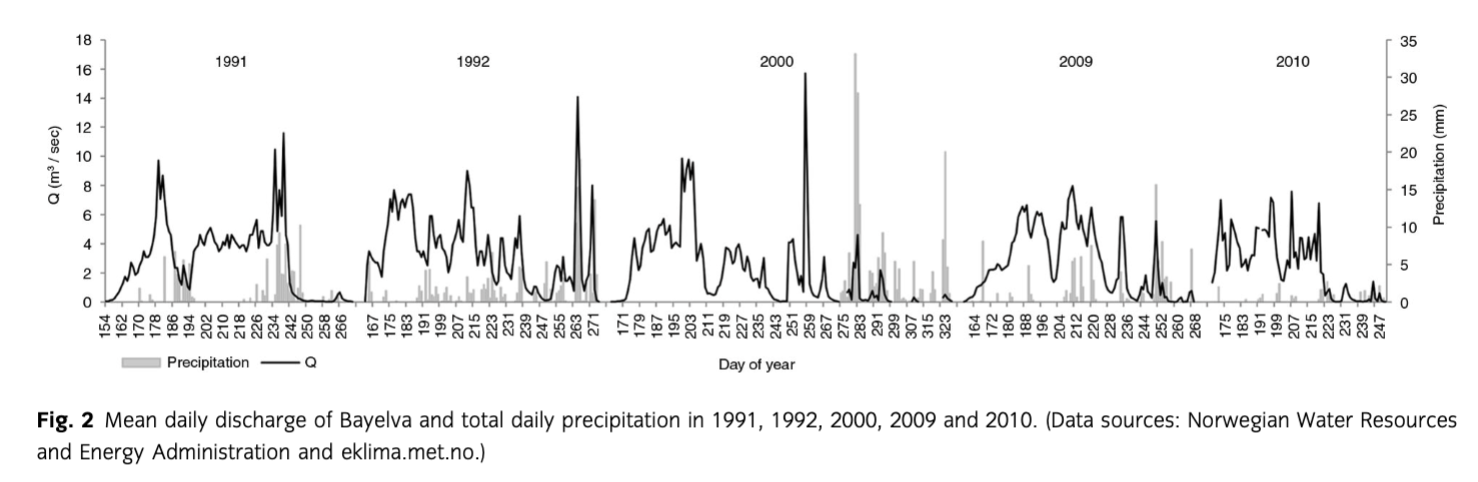
Specific annual discharge varied between 1989 and 2010 from 0.56 m/a (2010) to 1.42 m/a (2008) with the mean of 1.08±0.21 m/a. The years under study, namely 1991, 1992, 2000, 2009 and 2010, were characterized by a similar, moderate discharge close to the 1989–2010 mean value. The exception was 2010 when the discharge magnitude was smaller by ca. 50% (see above). The daily discharge data (Fig. 2) revealed temporal variability in Bayelva flows. Therefore, the shortest runoff season and the lowest mean flows were recorded during 2010. The end of season discharge was caused by rainfall events. Detailed analyses of Bayelva hydrographs as well as meteorological data sets can be found in Nowak & Hodson (2013).
The retreat of Austre Brøggerbreen was almost continuous since the beginning of mass balance monitoring in 1966. The exceptions were two years of positive mass balance, namely 1987 and 1991. A total mass loss of 21.1 m of water equivalent was recorded since the start of the measurements in 1966.
Meltwater characteristics
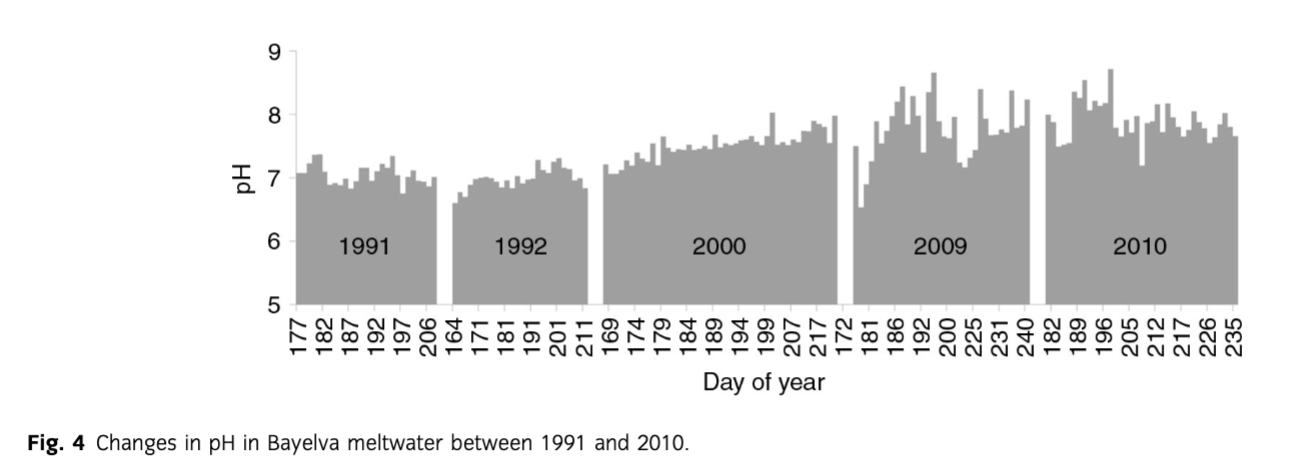
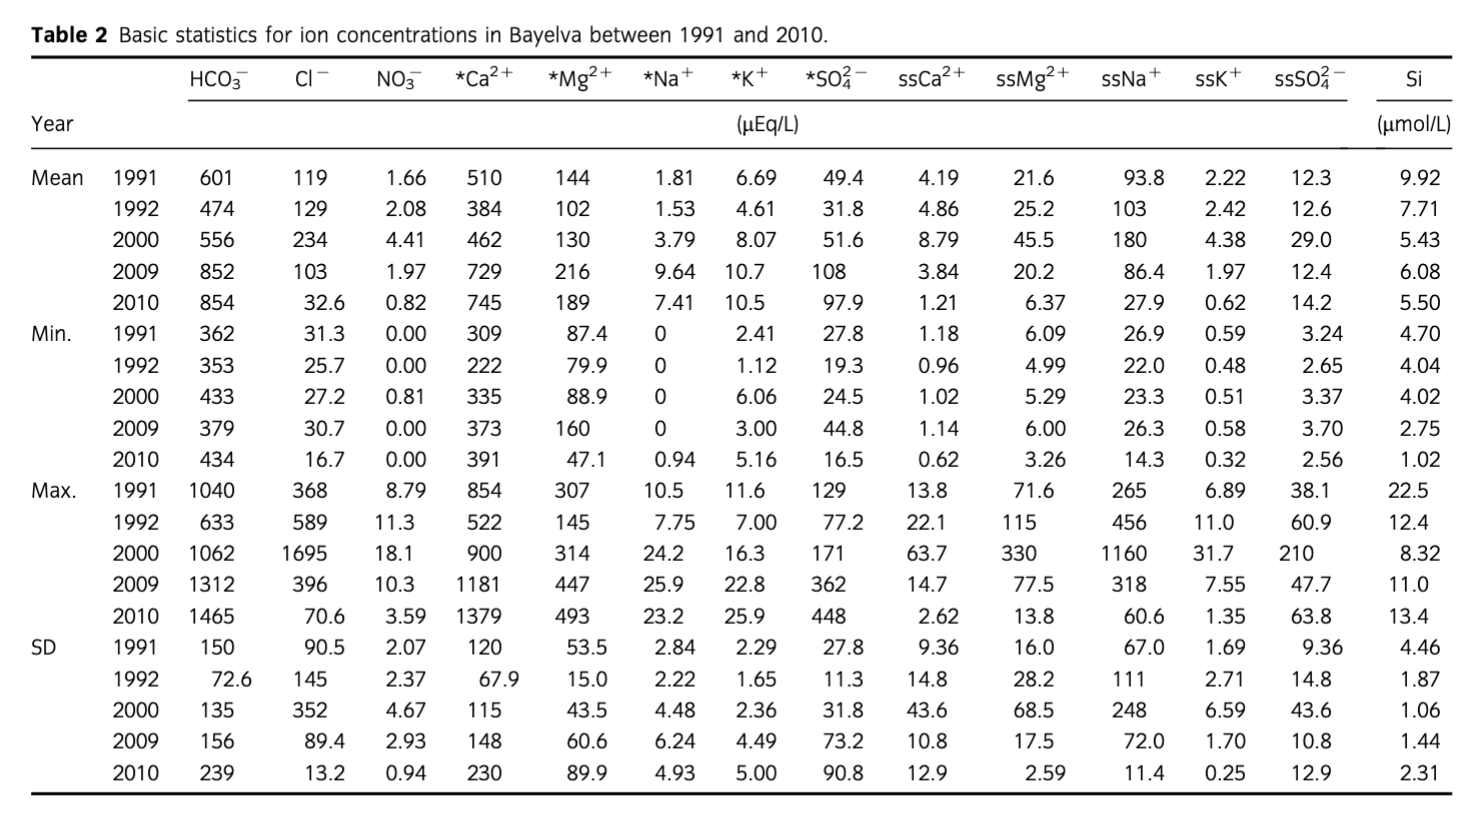
A summary of statistical comparison between sea-salt and crustal ions in the Bayelva is presented in Table 2. While the mean concentrations of sea-salt-derived ions remained relatively constant, with the exception of Cl−, the crustal ions differed between the years. An increase in the mean concentration of all crustal species and HCO3− was recorded with an exception of Si, where a slight decrease was noted. The change was also observed in the minimum and maximum values of the concentrations. However, the increases of the former were not as significant as the latter and were noticeable only for HCO3− and *Ca2+. The differences in the maximum values were more evident and included all non-sea-salt derived species, with the most pronounced increases observed for HCO3−, *Ca2+, *K+ and *. Furthermore, the above changes were recorded during the later years of monitoring, namely late 2000–2010 when, for example, mean concentrations of the above ions were up to twice higher than in 1991, 1992 and early to mid-2000. Detailed time series of crustal ion concentrations are presented in Fig. 3. Although the highest and most pronounced increases in concentrations concerned HCO3− and *Ca2+ species, the rise in concentrations of *Mg2+ and *K+ was also noticeable. Furthermore, it became apparent that the increase in mean and maximum values of * recorded in 2000–2010 was more of a result of the end of season maxima rather than a steady marked rise in concentrations throughout the years (as observed with other crustal ions mentioned above). The end of season maximum was also noticeable with Si concentrations even though the general trend was decreasing. Finally, a mid-season peak in all crustal ions was detected in 1991 and 2009. Values of pH ranged from 6.5 (2009) to 8.7 (2010) with the 1991–2010 mean 7.4. A general increase in pH was recorded over the whole period of monitoring with the marked increases during 2000–09 (Fig. 4) when the mean yearly values increased from 7.0 in 1991–92 to 7.5 in 2000, 7.8 in 2009 and 7.9 in 2010. This increase cannot be explained by the methodological differences in pH measurement described earlier, because high pCO2 conditions were estimated from the filtered samples in 1991, 1992 and 2000 (see below). Post-filtration pH measurement is likely to result in higher values than those estimated during the immediate pH measurements of 2009 and 2010 due to likely degassing of CO2. Therefore, the observed changes are in the opposite direction to any filtration effects upon pH and CO2.

Speciation of ions and pCO2
The results of ion speciation, saturation indices and pCO2 are presented in Fig. 5. The pCO2 was decreasing steadily towards 10−3.5 bar equilibration with the atmosphere (solid black line on Fig. 5a) until the end of ablation season in 2000. However, equilibration with the atmosphere in that period was not reached and the minimum value of saturation index was −3.48. The most variable values were recorded in 2009 ranging from −1.78 at the beginning of the ablation season (day 178) to −3.89 at the middle (day 194). Values below equilibrium (i.e., low pCO2) were also recorded at the end of 2009 ablation season (days 226 and 234). Such variability in pCO2 was absent in 2010. After the start of the ablation season values remained below equilibrium (−3.55 day 187) until the day 197 (−3.95), after which they began increasing to reach a final value of −2.77 (day 235).
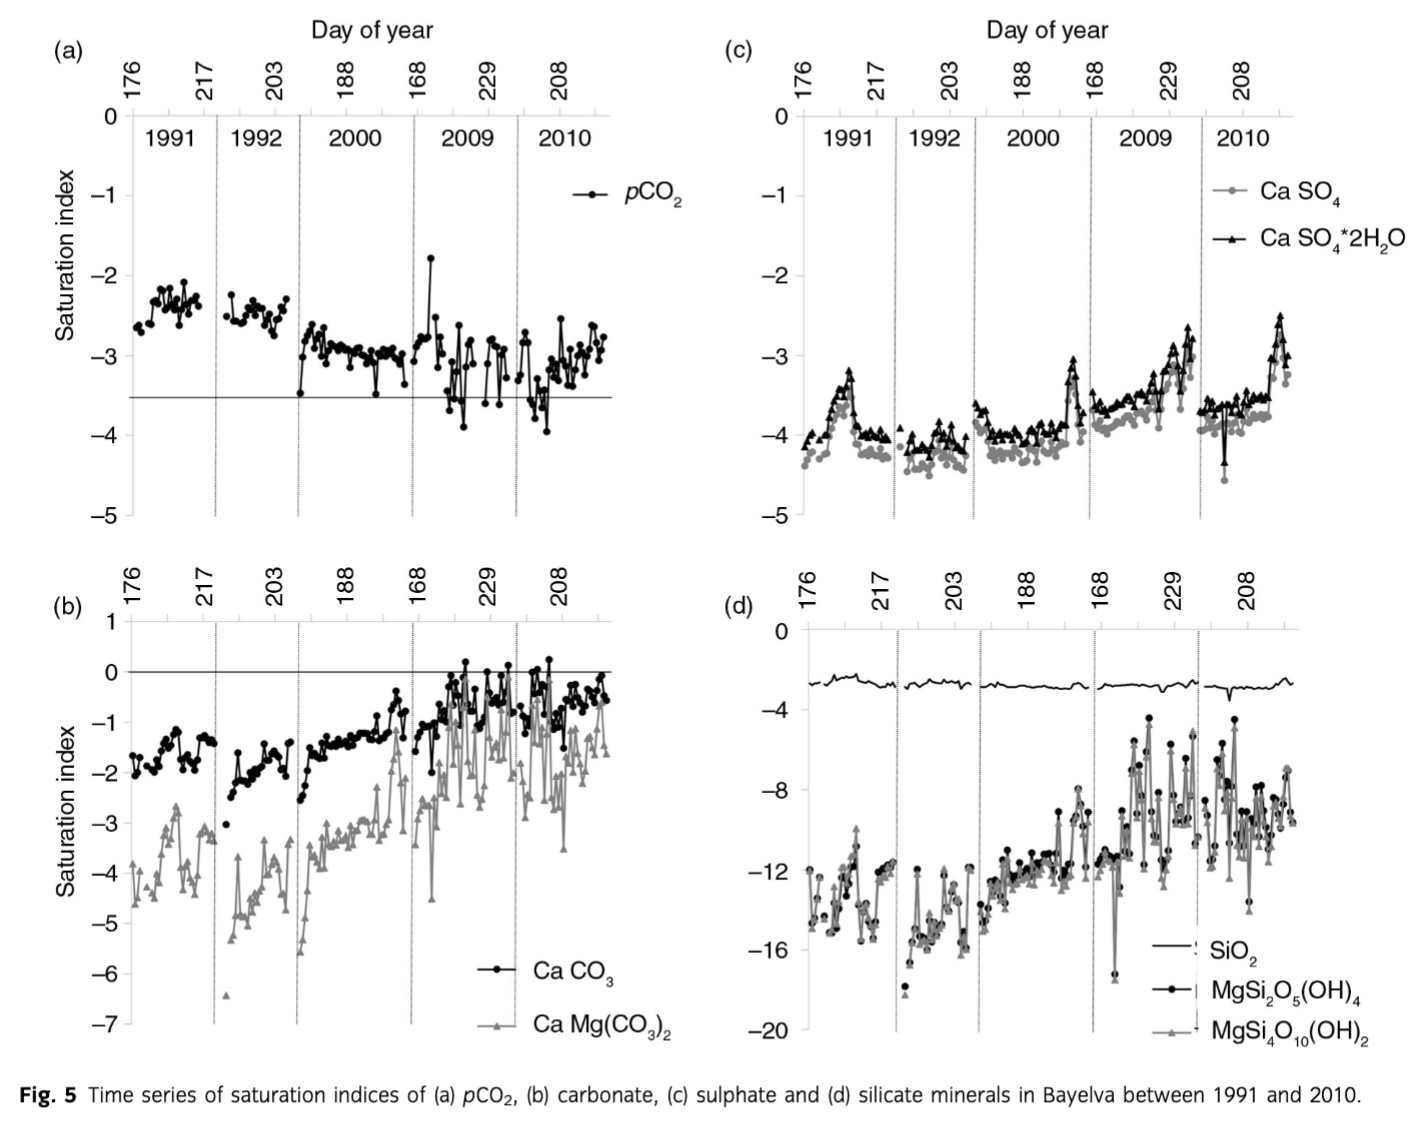
The saturation indices of carbonate minerals such as calcite (CaCO3) and dolomite (CaMg(CO3)2) increased throughout the period of records (Fig. 5b). It has been evident that although saturation index of dolomite changed the most, it was calcite that reached saturation on a few occasions in the 2009 and 2010 ablation seasons. Saturation indices of sulphate minerals such as gypsum (CaSO4*2H2O) and anhydrite (CaSO4) increased only slightly throughout the monitoring period (Fig. 5c). The maximum values were recorded at the end of each ablation season with the exception of 1991, when the maximum values were recorded in the middle (day 184–197). The saturation indices of silicates were the most variable throughout the years (Fig. 5d), although the saturation of SiO2 was relatively constant with just minor variation in 1991 and at the end of each ablation season. The general trend in magnesium silicates was an increase. The most variability was recorded during the middle of 2009 and 2010 seasons, ranging from −17.52 (day 178) to −4.76 (day 194) in 2009 and −14.08 (day 208) to −4.91 (day 197) in 2010.
Solute yields
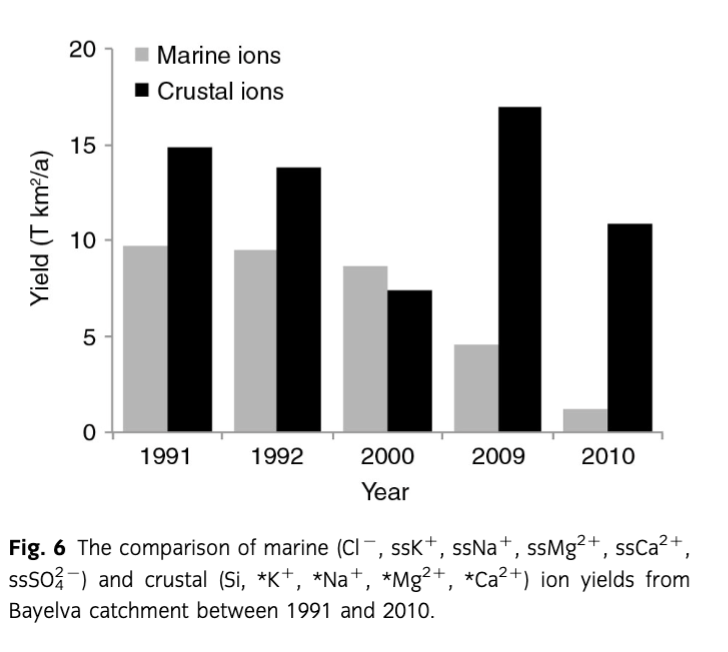
A comparison of marine (Cl−, ssK+, ssNa+, ssMg2+, ssCa2+, ss), and crustal ions (Si,*K+, *Na+, *Mg2+, *Ca2+) yields from the Bayelva catchment over the entire period of records is presented in Fig. 6. A decrease in marine ion yields has been recorded since 1991. In comparison, although crustal ions were also decreasing between 1991 and 2000, a peak in their yields in 2009 was followed by a decrease in the subsequent year. The comparison between individual ion yields and their proportion in the non-sea-salt-derived component is presented in Table 3. The yields varied with time and no marked trends were recorded. The exception was Si whose yields were decreasing since 1992. In comparison, the proportion of ions in the total yields revealed more *Ca2+ since 2000.

Discussion
The literature on solute acquisition by glacial meltwaters is extensive and covers glaciers of various thermal regimes as well as their proglacial environments (see, e.g., Raiswell 1984; Tranter et al. 1993; Sharp et al. 1995; Tranter et al. 1996; Anderson et al. 1997; Hodgkins et al. 1997; Brown et al. 1998; Hodgkins et al. 1998; Brown 2002; Hodson et al. 2002; Tranter, Sharp et al. 2002; Hodson et al. 2005). In brief, solutes are supplied from two primary sources, atmospheric and crustal. The former is the source of gases, aerosols and sea-salt species (such as CO2, O2, NO2, SO2, HNO3, H2SO4, Cl−) while the latter delivers products of chemical weathering of glacial flour, moraines and snow dust (such as Ca2+, Mg2+, Na+, K+, HCO3−, , Si) (Tranter et al. 1993). The relationships between the above in glacial environments are complicated and governed by many variables. These are bedrock lithology, the supply of hydrogen protons (H+) (therefore pH) and gases such as CO2 and O2, sediment surface area, ratio and duration of rock-water contact, microbial processes, and finally the rate of runoff production (Raiswell 1984; Brown et al. 1994; Sharp et al. 1995; Anderson et al. 1997; Brown 2002). Biogeochemical studies of the above dependencies and the mechanisms driving reactions in glacial environments were explored well in the publications given above, while others, such as Anderson (2007), Fairchild et al. (1999) and Cooper et al. (2002) provided insights into the same processes in glacial forefields. In the discussion below, we therefore focus upon characterizing the variations in Bayelva's hydrochemistry between 1991 and 2010 and how they reflect changing weathering processes during glacier retreat.
Interannual change in solute transport
Carbonates
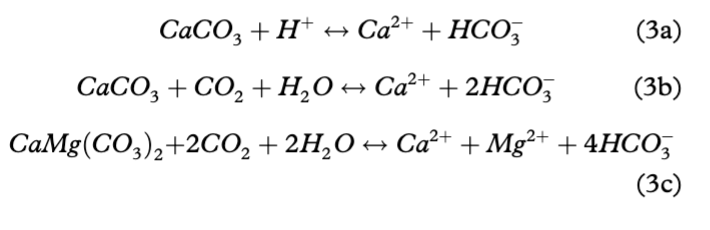
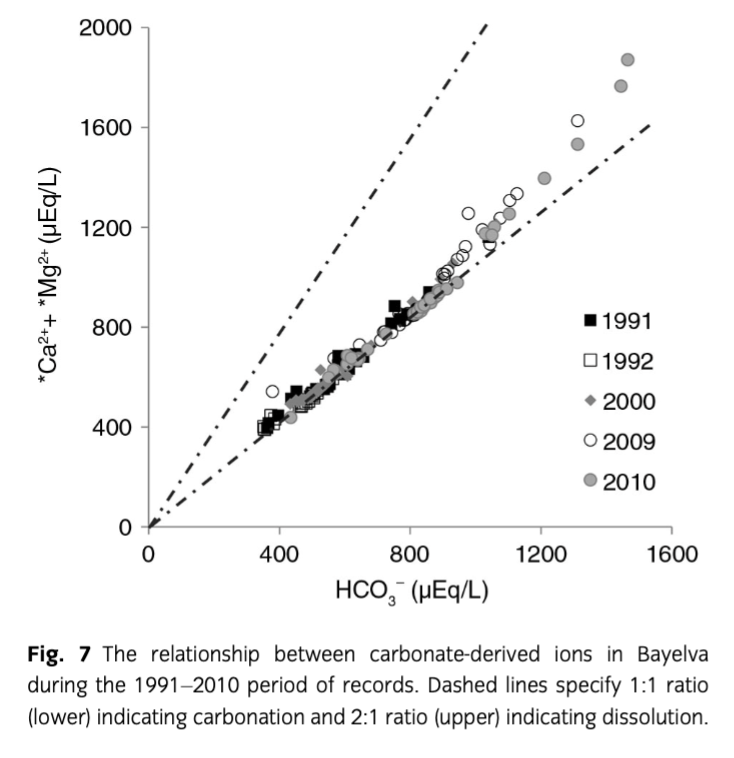
The dominance of HCO3−, *Ca2+ and *Mg2+ in the Bayelva waters was not unexpected considering the geology of the catchment (limestone and dolomite). Furthermore, it is widely accepted that highly reactive minerals such as carbonates, evaporates or sulphides can dominate meltwater chemistry from glacially eroded bedrock, even when they occur only in trace amounts (Raiswell & Thomas 1984; Tranter et al. 1996). An order of magnitude lower dissolution rate of dolomite compared to calcite (Chou et al. 1989; Fairchild et al. 1994a, b) can also be responsible for much lower concentrations of *Mg2+ than *Ca2+. Dissolution of carbonates (see Eqn. 3a) takes place in open, well oxygenated channels where meltwater transfer is rapid and results in 2:1 ratios of *Mg2+ and *Ca2+ to HCO3− (in µEq/L) (Tranter et al. 1993). Since the Bayelva catchment is characterized by rapid drainage through well-aerated supraglacial, englacial and proglacial channels (Nowak & Hodson 2013), the hydrological system should provide a good environment for this reaction. Despite that, a 2:1 ratio was not reached during the entire period of records (see Fig. 7). Instead, a linear association between the above ions with a slope close to 1 (0.9±0.01 in *Ca2+/HCO3− and 1.2±0.01 in *Ca2++*Mg2+/HCO3−) in equivalent units was recorded, explaining 98% of the 1991–2010 data. These ratios indicate that carbonate (namely calcite) carbonation (Eqn. 3b) was the major reaction in the system. In addition, the fact that the *Ca2+/HCO3− ratio was marginally less than unity indicates uptake of Ca2+ by cation exchange, which is a well-known early reaction following the wetting of freshly exposed glacial sediments (see Hodson et al. 2002). Dolomite carbonation (resulting in a *Ca2+:*Mg2+ ratio close to 1, see Eqn. 3c) was discarded as a main weathering process since the *Ca2+:*Mg2+ ratio was 2.6.
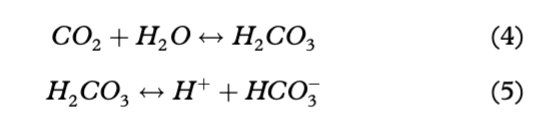
However, Fig. 7 shows that a minor shift towards 2:1 ratios for *Ca2++*Mg2+/HCO3− did in fact occur. Those data points represent samples collected at the end of the ablation season, and indicate an increase in chemical weathering that also involved silicate minerals as a source of *Mg2+. This period receives closer attention in the following section. Carbonation was also reflected in the pCO2 time series (Fig. 5a) on account of the slower kinetics of atmospheric CO2 dissolution (Eqn. 4) in comparison with the kinetics of H2CO3 dissociation (Eqn. 5; Raiswell 1984).
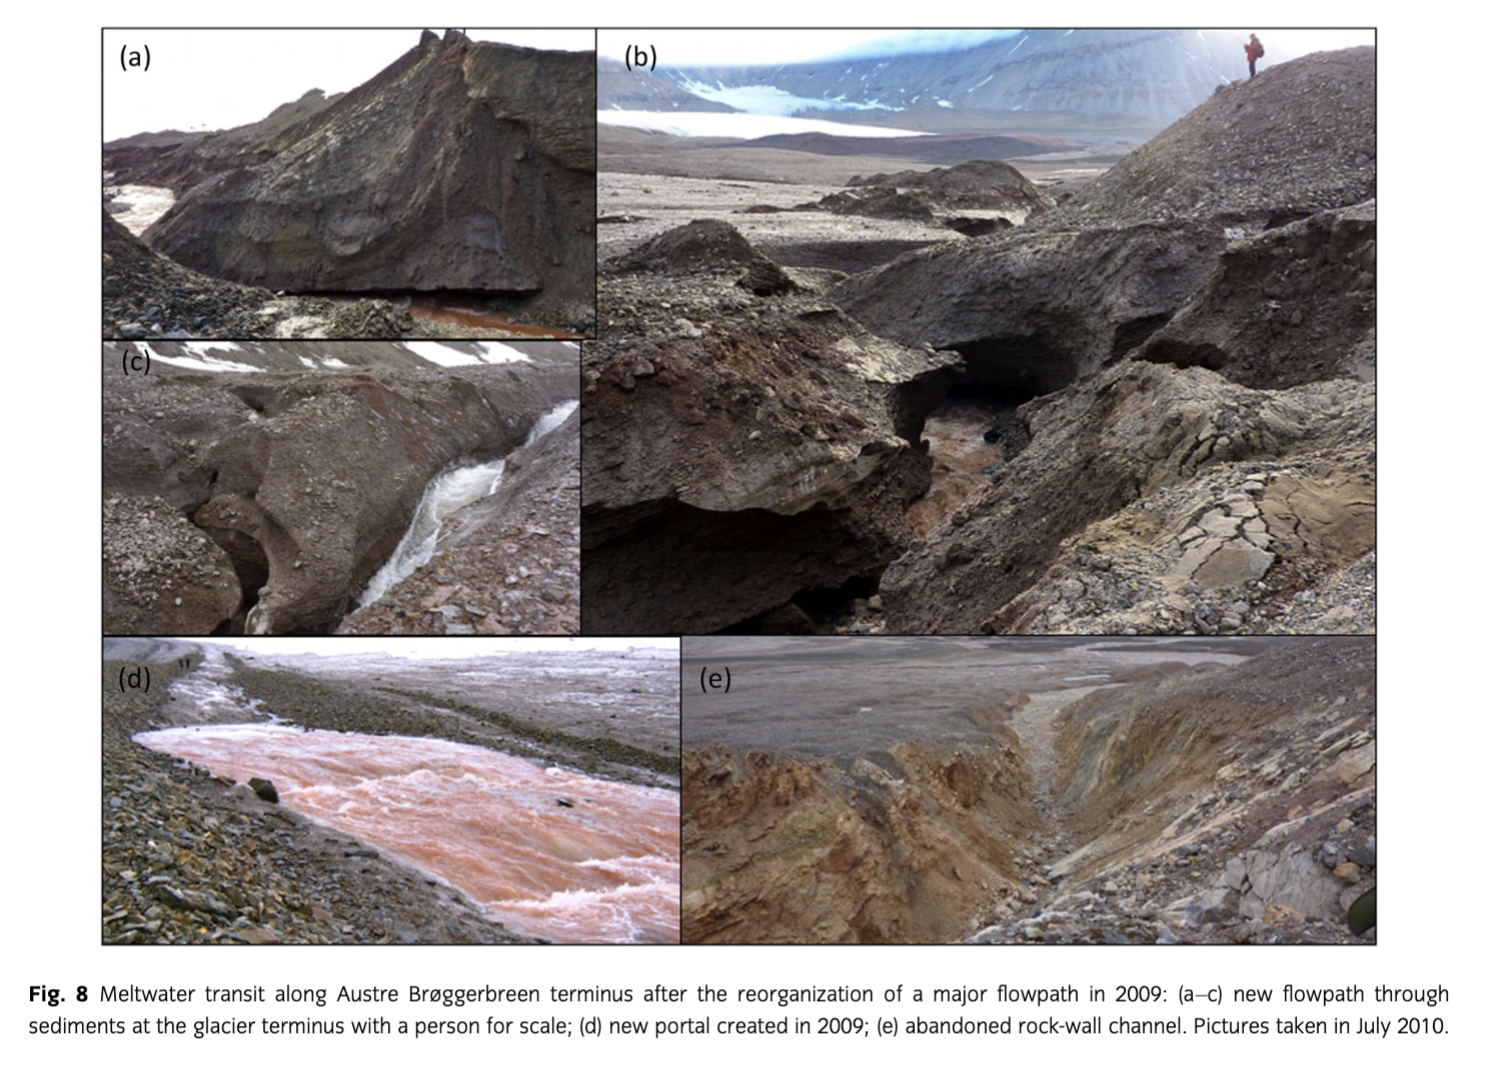
A steady decline of pCO2 from 1991 to 2000 was followed by the high variability and even periods of under-saturation in 2009 and 2010, although the change in the latter year was less pronounced. The above pCO2 reduction can therefore be linked to enhanced weathering following the steady retreat of glaciers and the subsequent uncovering of fine, reactive subglacial tills produced when the glacier had polythermal regime. These sediments were, until recently, frozen under a cold ice margin. The increased weathering is supported by a steady increase in 1991–2010 concentrations of ions derived from carbonate weathering (see Fig. 3), pH (see Fig. 4) and an increase in the saturation indices of calcite, dolomite, sulphate and silicate minerals (see Fig. 5b–d). The most pronounced changes in saturation indices, pH and ion concentrations were, however, recorded in 2009 and 2010. This coincided with a major reorganization of the flowpath in 2009, which was a result of Austre Brøggerbreen's retreat. In that year, a long-existing portal on the eastern margin of the glacier remained frozen and meltwater burst through thin glacier ice circa 50 m to the west (Fig. 8). The portal was draining supra and englacial meltwaters from about 7 km2 of the eastern part of the glacier, which represents ca. 74% of the total glacier area (Hodson et al. 1998a; Stuart et al. 2003). Consequently, a long-existing, more than 1 km long, proglacial channel in a rock-walled valley was abandoned and a new flowpath was eroded through recently exposed sediments (see Fig. 8a–c). This reorganization of the major flowpath was responsible for routing of meltwaters through melting moraines along the glacier terminus, which supplied fresh fine sediments that enhanced chemical weathering to such an extent that long established high pCO2 conditions transformed temporarily into low pCO2 (Fig. 5). Therefore, the chemical weathering was so great that the demand of hydrogen protons exceeded the supply of CO2 from the atmosphere and microbial respiration, and under-saturation of pCO2 was recorded for the first time. It has to be noted that the sampling was undertaken circa 2.5 km from the glacier terminus. Therefore, turbulent meltwater had time to acquire some CO2 from the atmosphere, increasing final levels of pCO2 (a process that can have an observable effect after 20–30 min [Raiswell 1984]). The change in flowpath was also reflected in the crustal ion yield (see Fig. 6, Table 3), which in 2009 exceeded 17 T/km2 in comparison with 14.8 T/km2 in 1991, and only 7.5 T/km2 in 2000.
Silicates
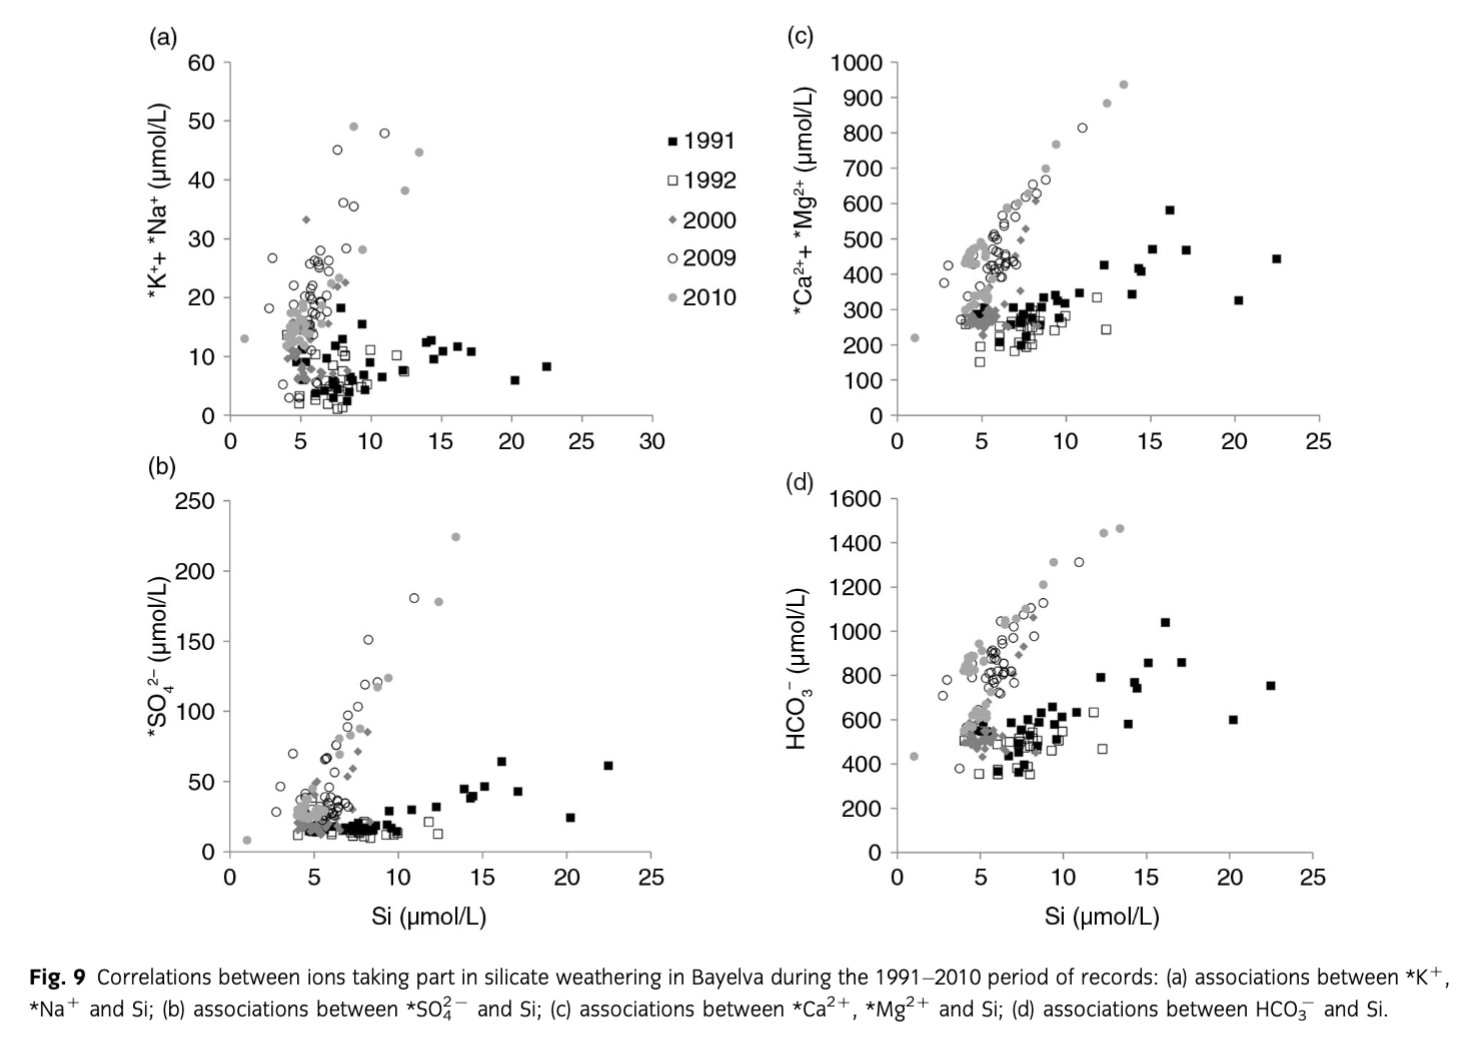
The changes in carbonate-derived solutes were accompanied by changes in solutes derived from silicate weathering such as *K+, *Na+ and Si (see Fig. 3). However, unlike the ions linked to carbonates, the relationship between Si and *K++*Na+ varied between the years (Fig. 9a), indicating a change in meltwater chemistry and therefore chemical weathering. Two groups were distinguishable and they consisted of years 1991, 1992, 2000 (June only) and 2000 (July, August), 2009, 2010. The former was characterized by low Si, low *K+, *Na+, while the latter by low Si and high *K+, *Na+. The same pattern was also observed in the ratios of *, *Ca2++ *Mg2+ and HCO3− to Si (Fig. 9b–d). The year 2000 seemed to mark a transition between 1991, 1992 and 2009, 2010. This agrees with the results of a recent study by Nowak & Hodson (2013), where changes in Bayelva hydrology, that followed changes in air temperature and precipitation, also became apparent in the same year. Based on the above results, it can be assumed that silicate weathering in Bayelva increased during 2000 (July, August), 2009 and 2010. Despite that, the general 1991–2010 trend in dissolved Si concentrations showed a slight decrease followed by the decrease in Si yields (Tables 3, 4). The exceptions were short-term, end of season Si maxima (Fig. 3) that will be discussed below along with the end of season concentration maxima of other crustally derived ions. The phenomenon of increased silicate weathering throughout the entire period of records and a slight decreasing trend of dissolved Si concentrations also require explanation. This is offered below.
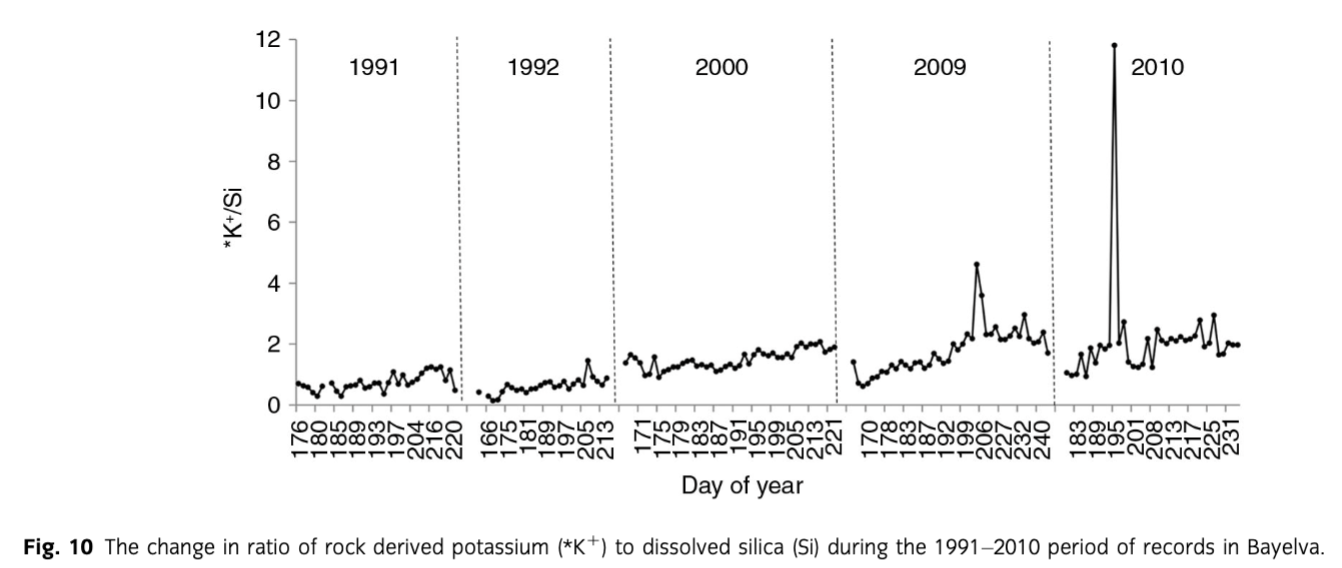
Firstly, as suggested by Hodson et al. (2002), Anderson et al. (1997) and Anderson (2005) among others, the weathering of silicates in glacial environments is incongruent and non-stoichiometric. The study by Hoch et al. (1999) showed that *K+ can be released rapidly from glacially eroded material without the same increase in Si concentrations. This was also recorded in our dataset and presented in Fig. 10. The steady increase in *K+ relative to Si can be achieved by rapid reactions of surface exchange (Eqn. 6), reversible cation exchange (Eqn. 7) (Tranter et al. 1993) as well as leaching from biotite, mica and k-feldspar (Newman & Brown 1969; Stallard 1995; Anderson et al. 1997; Anderson 2007) that are present in the catchment.

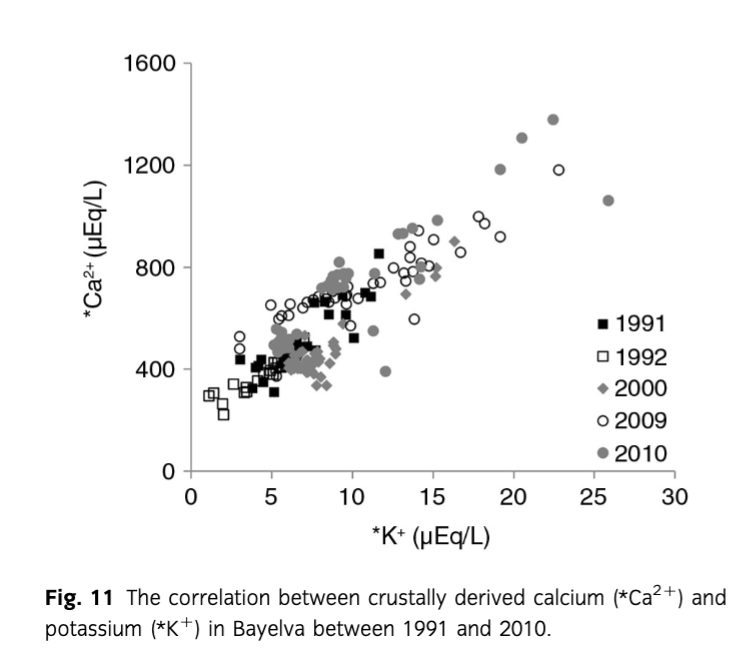
To explore the above reactions, various associations between ions were investigated. Although no correlation between *K+ and pH was recorded, it was difficult to discard surface exchange entirely, due to H+ also being used in other weathering reactions. Similarly, positive significant correlations (R2 = 0.74–0.88, p=0.05) and small intercepts (0.59±0.06–9.04±1.62) between *Ca2+ and *K+ (Fig. 11) would suggest that cation exchange had little effect in the period of records. However, the concentrations of *Ca2+ in the pool of ions were roughly 50 times higher than *K+. Therefore, a clear signal from cation exchange (i.e., a negative correlation between *Ca2+ and *K+) could have been masked. Cation exchange was also supported by *Ca2+/HCO3− ratios lower than 1 indicating calcium uptake (Tranter, Sharp et al. 2002) as discussed above. The uptake of *Ca2+ to create secondary gypsum was discarded on the account of low saturation indices of gypsum presented in Fig. 5c and high slopes in correlations between *Ca2+ and *. What is more, the study by Fairchild et al. (1994) showed that *Ca2+– 2*K+ ion exchange is largely responsible for *K+ concentrations in meltwaters, with much less *Ca2+– 2*Na+ exchange.
The second means of explaining the increased silicate weathering and decreasing trend in Si concentrations is based on the study of Dove (1994), indicating that silicate weathering is slow due to the low temperature and slow kinetics. Therefore, it seems natural that increased weathering can take place in the presence of acids such as H2SO4 or H2CO3 that can enhance the process. Those acids can be produced by two types of reactions, namely carbonation and sulphide oxidation (see Eqns. 8, 9). Both of them occur in the watershed; however, according to our data, the latter is constrained to the end of season hydrochemistry. The carbonation of silicates was identified only in 1991 and 1992, when the positive correlations between *K+ and HCO3− reached, respectively, 0.75 and 0.87 (p=0.05).
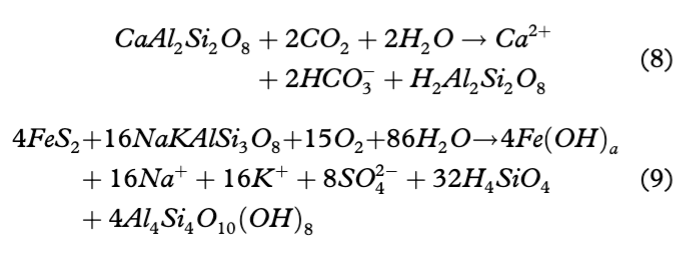
Based on Eqns. 8 and 9, it is clear that chemical weathering of silicates and aluminosilicates via reactions such as sulphide oxidation coupled to silicate dissolution (hereafter SO/SD) and silicate carbonation result in different products. Depending on the water residence time the above reactions can create new silicate minerals, weathered feldspar surfaces (e.g., kaolinite) and/or highly soluble silicic acid (see Eqns. 8, 9). Further, Wollast (1967) indicated that there are reactions that can remove Si from the solution to form an amorphous alumina silicate, a hydrated kaolinite-like material (H4Al2Si2O9·nH2O). Finally, while biogenic uptake of dissolved Si has been reported in small, first-order streams in the study site (Nowak & Hodson 2014), water turbulence and turbidity prevent this process from occurring in the Bayelva.
Therefore we suggest that, during the period of early–mid-ablation season, when the water contact with freshly available, glacially disintegrated minerals is high and relatively short, ion exchange takes place along with the carbonation of carbonates and carbonation of silicates (1991, 1992). Thus, since new secondary minerals are created by carbonation and surface exchange, there is no additional release of easily dissolved Si forms into the system (Eqn. 8) and Si concentrations remain relatively steady. Some of those minerals created during periods of high turbidity could also have been deposited on the proglacial sandur since the area was proved to be a net sink for suspended sediments by Hodson et al. (1998b). Then, later in the season, when discharge falls, the duration of rock–water contact increases while contact with suspended sediment is maintained, the waters from active layer and hyporheic zone are no longer hugely diluted, an increased contribution from SO/SD becomes apparent. Enhanced silicate weathering is recorded and in consequence, an increase in the release of silicic acid (therefore dissolved Si) is observed. The end of season meltwater characteristics will therefore be discussed in the next section.
End of season changes in solute acquisition
The seasonal changes in meltwater chemistry are usually marked by two events, the high solute concentrations early in the ablation season and the end of season maxima. The former are heavily influenced by snowpack elution which was explored in detail for the Bayelva watershed by Tranter et al. (1996) and Hodson et al. (2002). Therefore here, we focus only on the end of season changes. It is apparent that the concentrations of all crustal ions increased at the end of summer (August, September) during each year of record. The exceptions were 1991 and 1992 when the sampling was carried out only until the beginning of August before significant fall in meltwater discharge and late summer rainfalls occurred (see Krawczyk et al. 2003). In addition, data from the end of 2000 field campaign comprised samples from between 30 July and 5 August, therefore, they were used here to provide an indication of late summer hydrochemistry rather than represent the true end of season period for that year.
As mentioned in the previous section, at the end of summer delayed flowpaths are no longer masked by the large amount of glacial meltwaters, and it is possible to record the signal from the melting active layer (that has reached its maximum depth), from solutes washed out by heavy rains, and from the water exchange within the hyporheic zone of the river channels. Furthermore, as the season progresses, the water table in the immediate glacier forefield drops following channelization, allowing the outflow of more concentrated waters from melting moraines and areas near the glacier terminus (see Cooper et al. 2011). In addition, as the studies by Bogen (1991) and Hodson et al. (1998b) show, suspended sediment concentration in the Bayelva does not decrease with time but rather remains relatively high, delivering sediments from lateral and marginal moraines and slopes throughout the season. We believe that the processes presented above and the significant reduction in discharge serve to increase water residence time in the watershed and provide the conditions for reactions other than carbonation and much more commonly observed in subglacial environments. The best examples are microbially mediated sulphide oxidation coupled to carbonate dissolution (hereafter SO/CD; see Eqn. 10a, b) and the already mentioned SO/SD (Eqn. 9).
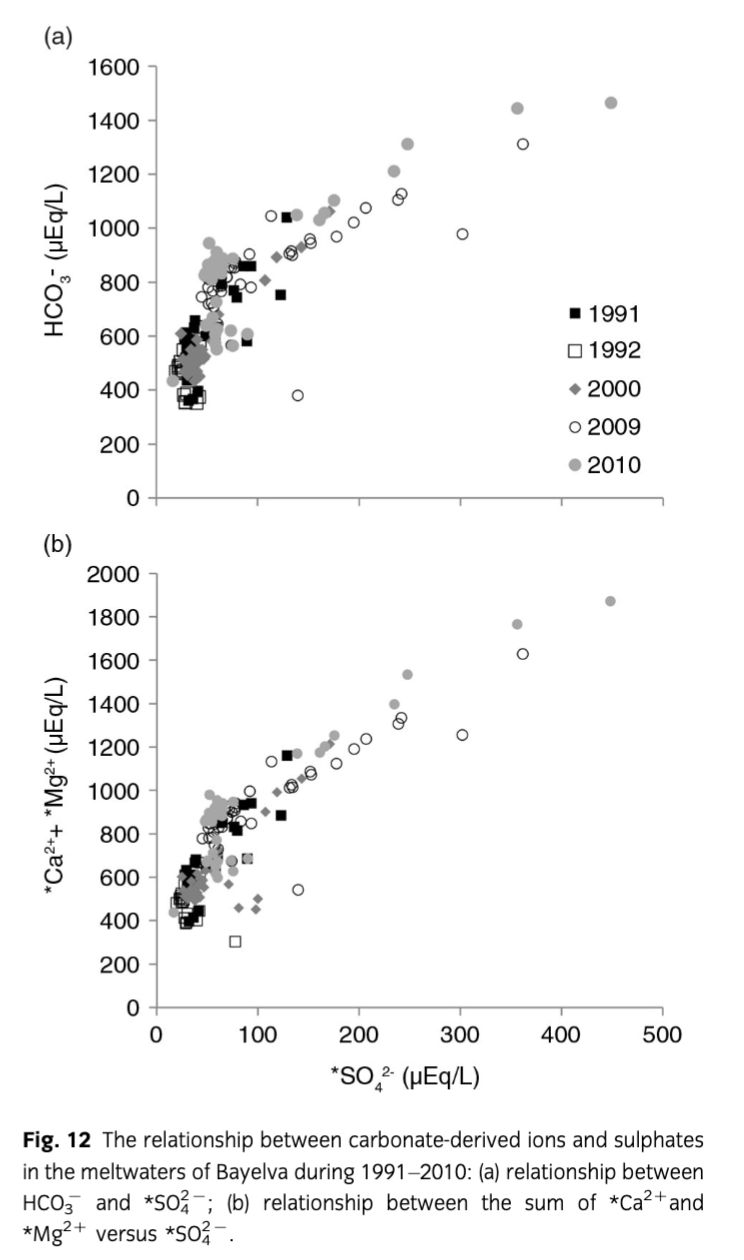
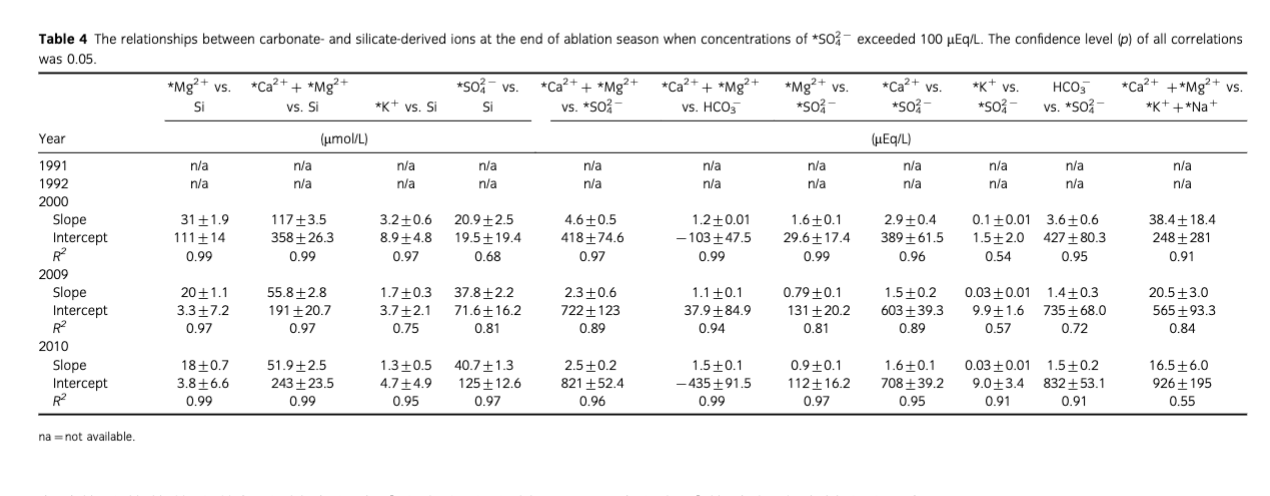
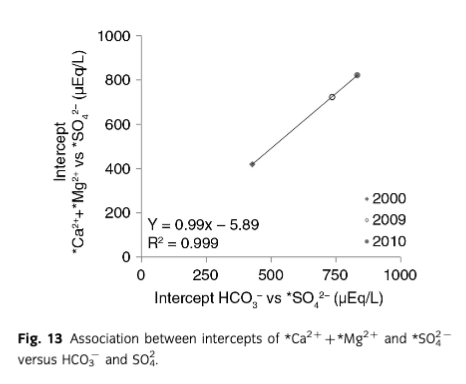
As a result, waters with high solute concentrations such as those recorded at the end of 2000, 2009 and 2010 ablation seasons are observed. The end of season meltwaters were also characterized by higher concentrations of * that exceed 100 µEq/L (see Figs. 3, 12). In addition, during that time, the relationships between crustally derived ions and * as well as Si (see Table 4) revealed significant linear correlations that were not recorded earlier in the ablation season, when the * concentrations were below 100 µEq/L. Therefore, to better explore the reactions occurring at the end of ablation season a comparison of regression models was performed according to the scheme presented by Tranter, Sharp et al. (2002), Wadham et al. (2001) and Wadham et al. (2010). Following this, the primary reaction occurring during the end of season was again carbonate carbonation. What is more, the significant (R2=1, p=0.05) correlation between *Ca2++*Mg2+vs* and HCO3−vs.* intercepts in August–September 2000, 2009 and 2010 and 0.99±0.01 gradient (see Fig. 13) indicated that about 99% of H2CO3 dissolved carbonates and the remaining dissolved silicates. What is interesting is that the amount of carbonate acid hydrolysis nearly doubled between 2000 and 2010 which according to Wadham et al. (2010) could be an indication of increased proportion of fine sediments in the meltwaters. This also placed Bayelva runoff between subglacial waters of polythermal glaciers such as Midre Lovénbreen (years 1991, 1992 and 2000) and Finterwalderbreen (years 2009, 2010) presented as well by Wadham et al. (2010). Furthermore, mean ratios of *Ca2+,*Mg2+ versus HCO3− (above 1) and *Ca2+ versus HCO3− (below 1) indicated that *Mg2+ and *Ca2+ were also acquired from/involved in other reactions. Hence, to explain the ratio above 1, additional regression models were developed. For example, high R2 values for associations between *Mg2+ and Si (0.99 in 2000; 0.97 in 2009 and 0.99 in 2010; p=0.05) and low intercepts (3.35±7.2 in 2009, 3.80±6.6 in 2010) suggested silicate weathering was one of the additional and most likely sources of *Mg2+. Regression models performed on other crustally derived ions (see Table 4) indicated that SO/SD was more responsible for the end of season solute acquisition than SO/CD. This would also explain the increase in dissolved Si during that time, since one of the products of SO/SD is highly soluble silicic acid. In addition, mean ratios of *Ca2+ versus HCO3− lower than 1, as indicated above, were thought to be caused by uptake of *Ca2+ released during carbonate carbonation and liberation of *K+. This would account for and high R2 values in regression models between *K+ and *Ca2+ (0.90 in 2000, 0.74 in 2009 and 0.97 in 2010, p=0.05). Therefore, in addition to carbonate carbonation, SO/SD and SO/SD supplying ions to Bayelva meltwaters at the end of ablation season, quick cation exchange reactions were also taking place.
Ion yields
Despite the significant and constant increases in ion concentrations since 2000, those changes were not entirely reflected in ion yields. For example, 2000 and 2010 were characterized by smaller ion yields than 1991 and 1992 (Fig. 5; Table 3) even though concentrations of ions during the former years were much higher (see Table 2). This was not unexpected considering that ion yields were calculated from ion concentrations and river discharge. The control of water flux on chemical erosion was already explored by Anderson et al. (1997) and Hodson et al. (2000). However, the interesting outcome of our multiannual study is the impact of a cold-based glacier retreat on ion yields. The flowpath change that rerouted meltwaters through new, freshly exposed, fine sediments produced at the glacier terminus was the direct result of glacier retreat and it connected previously isolated environments such as melting ice cored moraines to the main water channel. This nearly doubled * yields. This process also led to a marked increase in most of the ion yields presented in Fig. 6 and Table 3. What is more, the flowpath change also affected meltwater chemistry in the subsequent year maintaining high solute yields even though the river discharge in 2010 was smaller than in 2000 by 38%. Discrete events such as the one described above occurring during the retreat of cold-based glaciers can therefore have a marked impact on ion delivery to downstream terrestrial and marine ecosystems.
Conclusions
A multiannual study like this one gives a rare opportunity for insights into meltwater hydrochemistry following the switch from polythermal to cold-based glaciation and sustained glacier retreat. During our study, two periods were identified based on the solute concentrations, pH and the chemical weathering processes. They consisted of samples collected before and after July/August 2000. During the latter period, mean ion concentrations were from 1.6 to 3.4 times greater due to changes in carbonate (1.6) and silicate (3.4) derived ions. The same pattern was also observed in the mean pH values which increased by one unit between 1991 and 2010. This was the result of increased chemical weathering during which the main process of ion acquisition, namely carbonate carbonation, nearly doubled between 2000 and 2010 placing the cold-based glacier's runoff between subglacial waters of polythermal glaciers such as Midre Lovénbreen (years 1991, 1992 and 2000) and Finterwalderbreen (years 2009, 2010) presented by Wadham et al. (2010). However, the change in chemical weathering was not constrained to just carbonate rocks. The increase in rapid weathering of silicate minerals via surface exchange and leaching was also marked. Furthermore, additional reactions such as SO/SD and SO/CD were responsible for clear increases in ion concentrations during the end of the 2000 as well as 2009 and 2010 ablation seasons. Since the same processes were responsible for ion acquisition throughout the entire period of record (1991–2010), the change in ion concentrations was associated with the increased proportion of fine sediments available for weathering. This could only be linked to the glacier retreat, which consequently uncovered fresh, fine, reactive sediments. Furthermore, the retreat also resulted in the meltwater flowpath through these newly uncovered sediments and through melting moraines at the glacier terminus. As a consequence, crustal ion yields in 2009 doubled compared to the previous years, even though the specific discharge in that year was similar to 2000. The release of sediments from the immediate glacier terminus and further deposition of these fine sediments downstream from glaciers and in their forefields also means that the chemical weathering characteristics can be influenced for some time. This was the most likely reason why crustal ion yields in 2010 although smaller than in the previous year, were still relatively high.
In light of the above, our study has shown that long-term/multiannual measurements are necessary for the accurate predictions of the hydrochemical response of a glacierized catchment to climate change. Moreover, predictions of chemical denudation rates from catchments glacierized by cold-based glaciers can no longer be estimated with the use of old meltwater chemistry data and contemporary discharge data.
We have also found that during glacier retreat, the immediate vicinity of a cold-based glacier is the most chemically reactive part of the watershed. In addition, the end of season chemical weathering makes an important contribution to solute concentrations, since more concentrated waters from the active layer, melting moraines and hyporheic zone are less diluted by glacial meltwaters. Therefore, during that time, microbially mediated sulphide-oxidation-weathering carbonates and silicates and microbial production markedly contribute to the total ion yields. Those concentrated waters can then be flushed out by the end of season rainfalls or stay within the active layer until the next ablation season (see Nowak & Hodson 2013).
Furthermore, although it is believed that, due to the primary control of water fluxes on chemical erosion rates (Anderson et al. 1997; Hodson et al. 2000), climate warming will increase chemical denudation rates in glacierized catchments (Krawczyk & Bartoszewski 2008; Førland et al. 2009), it has to be taken into account that the long-term study of Bayelva's hydrology by Nowak & Hodson (2013) did not record significant increase in water flux over the past 35 years. What is more, the present study indicates that the marked increase in ion yields during 1991–2010 was only the result of a change in water flowpath (in response to glacier retreat) that connected fresh, fine reactive sediments to the main river channel.
Finally, our study also shows that major reorganization of the drainage system caused by glacier retreat can occur suddenly and result in an “annual flush” of crustally derived ions. Carbonation reactions occurring during these events cause significant pCO2 depletion incidents in an otherwise high pCO2 system. Although this enhanced geochemical weathering appears to be short-lived, its impact on the annual solute flux shows that it can be significant for downstream terrestrial and marine ecosystems.
Acknowledgements
This research was funded by the Marie Curie Initial Stage Training Network (NSINK: Sources, Sinks and Impacts of Atmospheric Nitrogen Deposition in the Arctic; project no. R/123386). The authors thank both NVE and the Norwegian Meteorological Institute for the provision of runoff and meteorological data, respectively. Special thanks go to Dr Phil Blaen and Dr Tristram Irvine-Fynn for excellent field assistance during 2009 and 2010 field seasons. The authors also thank the Natural Environment Research Council for providing accommodation and support during the fieldwork in Ny-Ålesund, Svalbard.
References
- Anderson S.P. 2005. Glaciers show direct linkage between erosion rate and chemical weathering fluxes. Geomorphology 67, 47–157. Publisher Full Text
- Anderson S.P. 2007. Biogeochemistry of glacial landscape systems. Annual Review of Earth and Planetary Sciences 35, 375–399. Publisher Full Text
- Anderson S.P., Drever J.I. & Humphrey N.F. 1997. Chemical weathering in glacial environments. Geology 25, 399–402.
- APHA, AWWA & WEF (American Public Health Association, American Water Works Association & Water Environment Federation) 1995. Standard methods for examination of water and wastewater. 19th edn. New York: American Public Health Association.
- APHA, AWWA & WEF (American Public Health Association, American Water Works Association & Water Environment Federation) 2005. Standard methods for the examination of water and wastewater Method 2320 B. Washington, DC: American Public Health Association.
- Bælum K. & Benn D.I. 2011. Thermal structure and drainage system of a small valley glacier (Tellbreen, Svalbard), investigated by ground penetrating radar. The Cryosphere 5, 139–149. Publisher Full Text
- Bjørnsson H., Gjessing Y., Hamran S., Hagen J.O., Palsson F. & Erlingsson B. 1996. The thermal regime of sub-polar glaciers mapped by multi-frequency radio-echo sounding. Journal of Glaciology 42, 23–32.
- Bogen J. 1991. Erosion and sediment transport in Svalbard. In Y. Gjessing et al. (eds.): Arctic hydrology, present and future tasks. Norwegian National Committee for Hydrology Report 23. Pp. 147–158. Oslo: Norwegian National Committee for Hydrology.
- Bogen J. & Bønsnes T.E. 2003. Erosion and sediment transport in High Arctic rivers, Svalbard. Polar Research 22, 175–189. Publisher Full Text
- Brown G.H. 2002. Glacial meltwater hydrochemistry. Applied Geochemistry 17, 855–883. Publisher Full Text
- Brown G.H., Sharp M.J., Tranter M., Gurnell A.M. & Nienow P.W. 1994. Impact of post-mixing chemical reactions on the major ion chemistry of bulk meltwaters draining the Haut Glacier d'Arolla, Valais, Switzerland. Hydrological Processes 8, 465–480. Publisher Full Text
- Brown G.H., Tranter M. & Sharp M.J. 1998. Experimental investigations of the weathering of suspended sediment by alpine glacial meltwaters. In M. Sharp et al. (eds.): Glacier hydrology and hydrochemistry. Pp. 155–174. Chichester, UK: John Wiley and Sons.
- Bruland O. & Hagen J.O. 2002. Mass Balance of Austre Brøggerbreen (Spitsbergen), 1971–1999, modelled with the precipitation-run-off model. Polar Research 21, 109–121. Publisher Full Text
- Challinor A. 1967. The structure of Brøggerhalvøya, Spitsbergen. Geological Magazine 104, 322–336. Publisher Full Text
- Chou L., Garrels R.M. & Wollast R. 1989. Comparative study of the kinetics and mechanisms of dissolution of carbonate minerals. Chemical Geology 78, 269–282. Publisher Full Text
- Cooper R., Hodgkins R., Wadham J. & Tranter M. 2011. The hydrology of the proglacial zone of a High-Arctic glacier (Finsterwalderbreen, Svalbard): sub-surface water fluxes and complete water budget. Journal of Hydrology 406, 88–96. Publisher Full Text
- Cooper R., Wadham J.L., Tranter M., Hodgkins R. & Peters N.E. 2002. Groundwater hydrochemistry in the active layer of the proglacial zone, Finsterwalderbreen, Svalbard. Journal of Hydrology 269, 208–223. Publisher Full Text
- Dove P.M. 1994. The dissolution kinetics of quartz in sodium chloride solutions at 25°C to 300°C. American Journal of Science 294, 665–712. Publisher Full Text
- Fairchild I.J., Bradby L., Sharp M. & Tison J.L. 1994. Hydrochemistry of carbonate terrains in alpine glacial settings. Earth Surface Processes and Landforms 19, 33–54. Publisher Full Text
- Fairchild I.J., Bradby L. & Spiro B. 1994a. Reactive carbonate in glacial systems: a preliminary synthesis of its creation, dissolution and reincarnation. In M. Deynoux et al. (eds.): Earth's glacial record. Pp. 176–192. Cambridge: Cambridge University Press.
- Fairchild I.J., Bradby L. & Spiro B. 1994b. Carbonate diagenesis in ice. Geology 21, 901–904.
- Fairchild I.J., Killawee J.A., Sharp M.J., Spiro B., Hubbard B., Lorrain R.D. & Tison J.L. 1999. Solute generation and transfer from chemically reactive alpine glacial–proglacial system. Earth Surface Processes and Landforms 24, 1189–1211.
- Førland E.J., Benestad F., Flatøy F., Hanssen-Bauer I., Haugen J.E., Isaksen K., Sorteberg A. & Ådlandsvik B. 2009. Climate development in north Norway and the Svalbard region during 1900–2100. Norwegian Polar Institute Report Series 128. Tromsø: Norwegian Polar Institute.
- Hagen J. O., Korsen O. M. & Vatne G. 1991. Drainage pattern in a sub-polar glacier, Brøggerbreen, Svalbard. In Y. Gjessing et al. (eds.): Arctic hydrology, present and future tasks. Norwegian National Committee for Hydrology Report 23. Pp. 121–131. Oslo: Norwegian National Committee for Hydrology.
- Hagen J.O. & Sætrang A. 1991. Radio-echo soundings of sub-polar glaciers with low frequency radar. Polar Research 9, 99–107. Publisher Full Text
- Hjelle A. 1993. The geology of Svalbard. Norsk Polarinstitutt Handbok 7. Oslo: Norwegian Polar Institute.
- Hoch A.R., Reddy M.M. & Drever J.L. 1999. The importance of mechanical disaggregation in chemical weathering in cold, alpine environment, San Juan Mountains, Colorado. Geological Society of America Bulletin 111, 304–314.
- Hodgkins R., Hagen J.O. & Hamran S. 1999. 20th century mass balance and thermal regime change at Scott Turnerbreen, Svalbard. Annals of Glaciology 28, 216–220. Publisher Full Text
- Hodgkins R., Tranter M. & Dowdeswell J.A. 1997. Solute provenance, transport and denudation in a High Arctic glacierised catchment. Hydrological Processes 11, 1813–1832.
- Hodgkins R., Tranter M. & Dowdeswell J.A. 1998. The hydrochemistry of runoff from a ‘cold-based’ glacier in the High Arctic (Scott Turnerbreen, Svalbard). Hydrological Processes 12, 87–103.
- Hodson A., Gurnell A., Tranter M., Bogen J., Hagen J.O. & Clark M. 1998a. Meteorological and runoff time series characteristics in a small High-Arctic glacier basin, Svalbard. Hydrological Processes 12, 509–526.
- Hodson A., Gurnell A., Tranter M., Bogen J., Hagen J.O. & Clark M. 1998b. Suspended sediment yield and transfer processes in a small High-Arctic glacier basin, Svalbard. Hydrological Processes 12, 73–86.
- Hodson A., Tranter M., Gurnell A., Clark M. & Hagen J.O. 2002. The hydrochemistry of Bayelva, a High Arctic proglacial stream in Svalbard. Journal of Hydrology 257, 91–114. Publisher Full Text
- Hodson A., Tranter A. & Vatne G. 2000. Contemporary rates of chemical denudation and atmospheric CO2 sequestration in glacier basins: an Arctic perspective. Earth Surface Processes and Landforms 25, 1447–1471.
- Hodson A.J., Mumford P.N., Kohler J. & Wynn P.M. 2005. The High Arctic glacial ecosystem: new insights from nutrient budgets. Biogeochemistry 72, 233–256. Publisher Full Text
- Holland H.D. 1978. The chemistry of the atmosphere and oceans. New York: John Wiley & Sons.
- Irvine-Fynn T.D. & Hodson A.J. 2010. Biogeochemistry and dissolved oxygen dynamics at a subglacial upwelling, Midtre Lovénbreen, Svalbard. Annals of Glaciology 51, 41–46. Publisher Full Text
- Kohler J. 2010. Mass balance measurements of glaciers in Svalbard. Tromsø: Norwegian Polar Institute.
- Kohler J., James T.D., Murray T., Nuth C., Brandt O., Barrand N.E., Aas H.F. & Luckman A. 2007. Acceleration in thinning rate on western Svalbard glaciers. Geophysical Research Letters 34, L18502, doi: 10.1029/2007GL030681. Publisher Full Text
- Krawczyk W.E. & Bartoszewski S.A. 2008. Crustal solute fluxes and transient carbon dioxide drawdown in the Scottbreen basin, Svalbard in 2002. Journal of Hydrology 362, 206–219. Publisher Full Text
- Krawczyk W.E., Lefauconnier B. & Pettersson L. 2003. Chemical denudation rates in the Bayelva catchment, Svalbard, in the fall of 2000. Physics and Chemistry of the Earth 28, 1257–1271. Publisher Full Text
- Krawczyk W.E. & Pettersson L. 2007. Chemical denudation rates and carbon dioxide drawdown in a ice-free polar karst catchment: Londonelva, Svalbard. Permafrost and Periglacial Processes 18, 337–350. Publisher Full Text
- Mitchell A.C., Lafrenière M.J., Skidmore M.L. & Boyd E.S. 2013. Influence of bedrock mineral composition on microbial diversity in a subglacial environment. Geology 41, 855–858. Publisher Full Text
- Newman A.C.D. & Brown G. 1969. Delayed exchange of potassium from some edges of mica flakes. Nature 223, 175–176. Publisher Full Text
- Nordli P.Ø. & Kohler J. 2003. The early 20th century warming. Daily observations at Green Harbour, Grønfjorden, Spitsbergen. Klima 12–03, 20.
- Nowak A. & Hodson A. 2013. Hydrological response of a High Arctic catchment to changing climate over the past 35 years; a case study of Bayelva watershed, Svalbard. Polar Research 32, article no. 19691, http://dx.doi.org/10.3402/polar.v32i0.19691. Publisher Full Text
- Nowak A. & Hodson A. 2014. On the biogeochemical response of a glacierized High Arctic watershed to climate change: revealing patterns, processes and heterogeneity among micro-catchments. Hydrological Processes, doi: 10.1002/hyp.10263. Publisher Full Text
- Orvin A.K. 1934. Geology of the Kings Bay region, Spitsbergen. Skrifter om Svalbard og Ishavet 57. Oslo: Norway's Svalbard and Arctic Ocean Survey.
- Raiswell R. 1984. Chemical models of solute acquisition in glacial melt waters. Journal of Glaciology 30, 49–57.
- Raiswell R. & Thomas A.G. 1984. Solute acquisition in glacial melt waters I. Fjallsjokull (south-east Iceland): bulk melt waters with closed-system characteristics. Journal of Glaciology 30, 35–43.
- Rutter N., Hodson A., Irvine-Fynn T.D.L. & Kristiansen-Solas M. 2011. Hydrology and hydrochemistry of a deglaciating High-Arctic catchment, Svalbard. Journal of Hydrology 410, 39–50. Publisher Full Text
- Sharp M., Tranter M., Brown G.H. & Skidmore M. 1995. Rates of chemical denudation and CO2 drawdown in a glacier-covered alpine catchment. Geology 23, 61–64.
- Skidmore M.L., Anderson S.P., Sharp M., Foght J. & Lanoil B.D. 2005. Comparison of microbial community compositions of two subglacial environments reveals a possible role for microbes in chemical weathering processes. Applied Environmental Microbiology 71, 6986–6997. Publisher Full Text
- Skidmore M.L., Foght J.M. & Sharp M.J. 2002. Microbial life beneath a High Arctic glacier. Applied Environmental Microbiology 66, 3214–3220. Publisher Full Text
- Skretteberg R. 1991. Discharge measurement structure under Arctic conditions. Design and construction considerations. In Y. Gjessing et al. (eds.): Arctic hydrology, present and future tasks. Norwegian National Committee for Hydrology Report 23. Pp. 167–174. Oslo: Norwegian National Committee for Hydrology.
- Solomon S., Qin D., Manning M., Chen Z., Marquis M., Averyt K.B., Tignor M., & Miller H.L. Jr. (eds.): 2007. Climate change 2007. The physical science basis: contribution of Working Group I to the fourth assessment report of the Intergovernmental Panel on Climate Change. Cambridge: Cambridge University Press.
- Stallard R.F. 1995. Tectonic, environmental, and human aspects of weathering and erosion: a global review using a steady-state perspective. Annual Reviews of Earth and Planetary Science 23, 11–39. Publisher Full Text
- Stuart G., Murray T., Gamble N., Hayes K. & Hodson A. 2003. Characterization of englacial channels by ground-penetrating radar: an example from Austre Brøggerbreen, Svalbard. Journal of Geophysical Research—Solid Earth 108, article no. 2525, doi: 10.1029/2003JB002435. Publisher Full Text
- Symon C., Arris L. & Heal B. 2005. Arctic climate impact assessment. Cambridge: Cambridge University Press.
- Tranter M., Brown G.H., Hodson A.J. & Gurnell A.M. 1996. Hydrochemistry as an indicator of subglacial drainage system structure: a comparison of alpine and sub-polar environments. Hydrological Processes 10, 541–556.
- Tranter M., Brown G.H., Raiswell R., Sharp M.J. & Gurnell A.M. 1993. A conceptual model of solute acquisition by alpine glacial meltwaters. Journal of Glaciology 39, 573–581.
- Tranter M., Huybrechts P., Munhoven G., Sharp M.J., Brown G.H., Jones I.W., Hodson A.J., Hodgkins R. & Wadham J. 2002. Direct effect of ice sheets on terrestrial bicarbonate, sulphate and base cation fluxes during the last glacial cycle: minimal impact on atmospheric CO2 concentrations. Chemical Geology 190, 33–44. Publisher Full Text
- Tranter M., Sharp M.J., Lamb H.R., Brown G.H., Hubbard B.P. & Willis I.C. 2002. Geochemical weathering at the bed of Haut Glacier d'Arolla, Switzerland—a new model. Hydrological Processes 16, 959–993. Publisher Full Text
- Tranter M., Skidmore M. & Wadham J. 2005. Hydrological controls on microbial communities in subglacial environments. Hydrological Processes 19, 995–998. Publisher Full Text
- Wadham J.L., Cooper R.J., Tranter M. & Hodgkins R. 2001. Enhancement of glacial solute fluxes in the proglacial zone of a polythermal glacier. Journal of Glaciology 47, 378–386. Publisher Full Text
- Wadham J.L., Tranter M., Skidmore M., Hodson A.J., Priscu J. & Lyons W.B. 2010. Biogeochemical weathering under ice: size matters. Global Biogeochemical Cycles 24, GB3025, doi: 10.1029/2009GB003688. Publisher Full Text
- Westermann S., Boike J., Langer M., Schuler T. V. & Etzelmuller B. 2011. Modeling the impact of wintertime rain events on the thermal regime of permafrost. The Cryosphere Discussion 5, 1697–1736. Publisher Full Text
- Wolf-Gladrow D.A., Zeebe R.E., Klaas C., Körtzinger A. & Dickson A.G. 2007. Total alkalinity: the explicit conservative expression and its application to biogeochemical processes. Marine Chemistry 106, 287–300. Publisher Full Text
- Wollast R. 1967. Kinetics of the alteration of K-feldspar in buffered solutions at low temperature. Geochimica et Cosmochimica Acta 31, 635–648. Publisher Full Text
- Wynn P.M., Hodson A. & Heaton T. 2006. Chemical and isotopic switching within the subglacial environment of a High Arctic glacier. Biogeochemistry 78, 173–193. Publisher Full Text
Related Articles
Louise Chawla
Hanna К. Lappalainen
Tuukka Petäjä
Joni Kujansuu
Veli-Matti Kerminen
et al.
Ahmet Kılınç
Martin Stanisstreet
Edward Boyes
Fiona Taber
Neil Taylor
Georgia Liarakou
Ilias Athanasiadis
Costas Gavrilakis