This article is published under a Creative Commons license and not by the author of the article. So if you find any inaccuracies, you can correct them by updating the article.

Cetacean spatial trends from 2005 to 2019 in Svalbard, Norway


Olof Bengtsson
Kit M. Kovacs
Christian Lydersen
Published: Jan. 1, 2022
Latest article update: July 26, 2023
This article is published under the license


Abstract
This study uses cetacean sighting data, acquired via a citizen science programme, to update distributions and spatial trends of whales and dolphins in waters around the Svalbard Archipelago during the period 2005–2019. Distributions, based on kernel density estimates, from an early period (2005–2009) and a recent period (2015–19) were compared to identify potential shifts in distribution in this area, which is experiencing rapid warming and concomitant sea-ice losses. Among the three Arctic endemic cetaceans, white whales (Delphinapterus leucas, also known as beluga) had a stable, coastal distribution throughout the study, whereas narwhals (Monodon monoceros) and bowhead whales (Balaena mysticetus) were observed only north of the archipelago, but with increasing frequency during the recent period. White-beaked dolphins (Lagenorhynchus albirostris) had a stable distribution along the continental shelf break, west and south of Svalbard. Sperm whale observations shifted from west of Bjørnøya during the early period to being concentrated around the north end of Prins Karls Forland, west of Spitsbergen during the recent period. The four summer-resident baleen whales—blue whales (Balaenoptera musculus), fin whales (Balaenoptera physalus), humpback whales (Megaptera novaeangliae) and minke whales (Balaenoptera acutorostrata)—have shifted their distributions from the continental shelf break west of Spitsbergen during the early period into fjords and coastal areas during the recent period. These changes coincide with increased inflows of Atlantic Water into the fjords along the west coast of Spitsbergen and across the north of the archipelago.
Keywords
Climate change, citizen science, Arctic, distribution, dolphins, whales
Introduction
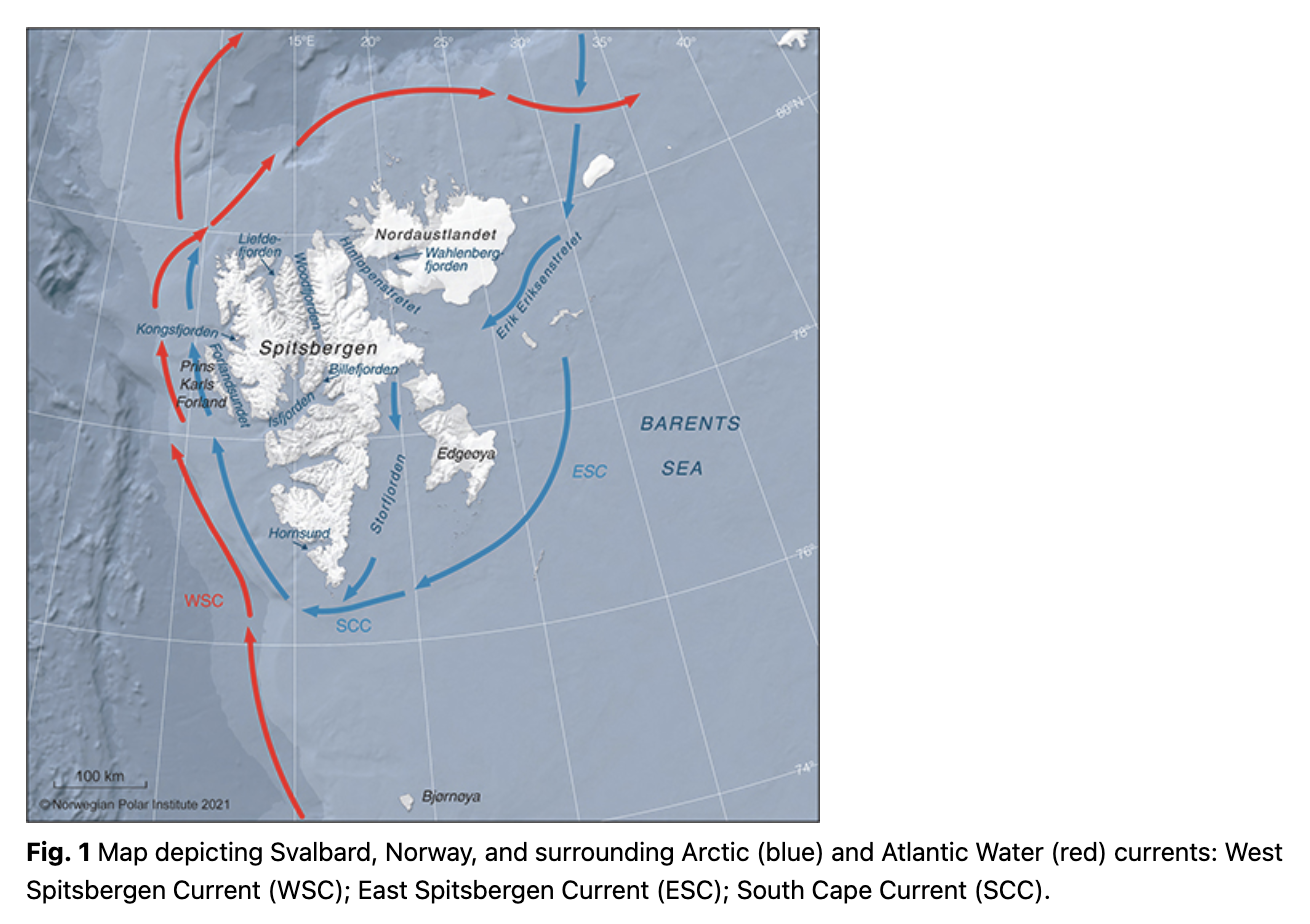
The Svalbard Archipelago is one of the areas on the globe where climate change is occurring at the fastest rate (Core Writing Team et al. 2014; Pörtner et al. 2019). This High-Arctic archipelago is influenced by warm AW transported northward by the West Spitsbergen Current (Fig. 1), which brings nutrient and plankton-rich water to fjords and troughs around the islands (Menze et al. 2020). The West Spitsbergen Current has experienced a marked warming during the last two decades (Spielhagen et al. 2011; Tverberg et al. 2014; Lind et al. 2018). This has affected the marine ecosystem in the Svalbard area markedly, reducing sea-ice cover dramatically and increasing the number of Atlantic species in the marine ecosystem, posing an uncertain future for endemic Arctic species in the area (Kovacs et al. 2011; Fossheim et al. 2015; Descamps et al. 2017). The dramatic changes taking place in both the physical and biotic environment around Svalbard make it particularly valuable to document changes in species distributions at this time in order to provide management bodies and stakeholders with sufficient information for conservation planning where this is deemed necessary (Laidre et al. 2015).
The NPI manages a citizen science sightings database MMSDB (https://data.npolar.no/sighting/) that stores observations of marine mammals around Svalbard. Storrie et al. (2018) used the MMSDB to study the distribution and habitat characteristics of cetaceans around Svalbard during the period from 2002 to 2014. This produced important baseline data that showed the first signs of distributional change for some whale species, adding to the growing list of successful studies using citizen science to monitor marine mammal populations (e.g., Lodi & Tardin 2018; LaRue et al. 2020; Stephenson et al. 2020; Bengtsson et al. 2021). Since the time of Storrie et al.’s (2018), study an increasing number of observations of summer-resident baleen whales have been recorded on the coastal shelves and in the fjords of western Spitsbergen, new studies have been published on the movement patterns of individual whale species in Svalbard (e.g., Hamilton et al. 2019; Kovacs et al. 2020; Lydersen et al. 2020), and detailed studies on temporal trends of water masses in western Spitsbergen fjords have become available (e.g., Tverberg et al. 2019; Skogseth et al. 2020). The purpose of this study is to: (1) update the cetacean distribution analyses performed by Storrie et al. (2018; which included data up to 2014) by including observations recorded in the MMSDB from 2015–19 and exploring the extended time series, comparing the early years to the most recent for both the Arctic endemic species (white whales, narwhal and bowhead whales) that reside in the High Arctic year-round and the seasonally resident cetacean species; and (2) investigate potential correlations between AW inflows into the fjords on the west coast and the observations of the most common summer-resident baleen whales (blue whales, fin whales, minke whales and humpback whales) in the area.
Methods
Observations of marine mammals in Svalbard and surrounding waters (74–84°N and 0–35°E; Fig. 1) have been recorded systematically since 2002 in the NPI’s MMSDB, documenting contact information for the observer/observing vessel, date, coordinates and information about species encountered, group size and other parameters, such as body condition. The first few years (2002–04) had few records, so the start year in this study was set to 2005. The most important contributors to the MMSDB include marine cruise expeditions operators, many associated with the Association of Arctic Expedition Cruise Operators, the Norwegian Coast Guard, research institutes (e.g., the NPI and the Norwegian Institute of Marine Research) and the Governor of Svalbard’s field inspectors and residents in Svalbard. Most reports come from expedition leaders and guide naturalists, who are experienced marine mammal spotters. All rare sightings are checked before being entered into the database, usually with photographic confirmation (see Storrie et al. 2018 for more details). This study provides an update to the study by Storrie et al. (2018), which covered the period 2005–2014, by including cetacean observations from 2015–19 and comparing these recent, novel data with data collected in a five-year period 10 years before (2005–09).
Species that did not have more than 10 observations in a given time period—sei whale [Balaenoptera borealis], long-finned pilot whale (Globicephala melas), northern bottlenose whale (Hyperoodon ampullatus) and killer whale (Orcinus orca)—were not analysed further in this study, but a map of where they have been observed is presented in Supplementary Fig. S1. For the species with more sightings, KDEs were calculated for each species with the ks-package in R version 4.0.2 (R Core Team 2020), using a plug-in bandwidth selector and a grid size of 1 km, displayed with 10 quantiles (Silverman 1986; Wand & Jones 1994; Chacón & Duong 2018). To visualize temporal changes in observation frequencies, KDEs for the period 2005–09 were subtracted from KDEs calculated for the most recent five years (2015–19). Since there is no discrimination between land and sea in the built-in kde-function in the ks-package, a land polygon of the Svalbard Archipelago (https://geodata.npolar.no/) was plotted on top of kernels for visual representation of KDEs.
Potential northward expansions of the different species were explored by calculating linear regressions of yearly mean latitude of observations. Level of significance was set at α = 0.05 for all analyses.
To investigate whether the amount of AW in Svalbard fjords influenced the number of sightings of summer-resident baleen whales during a given year, correlation coefficients were calculated between the number of observations per year and the annual mean summer fraction of AW for west coast fjords for which these oceanographic data were available (Isfjorden and Kongsfjorden). The annual mean summer fractions of AW (also including transformed AW) compared to other water masses present (e.g., Arctic Water, Local Water and Intermediate Water) were acquired from Tverberg et al. (2019) and Skogseth et al. (2020). Water masses were determined on the basis of temperature and salinity in Kongsfjorden (1994–2016, Tverberg et al. 2019) and Isfjorden (1987–2017, Skogseth et al. 2020). Prior to analysis, the distribution of the data was tested for normality using Shapiro-Wilk’s normality test. Depending on whether the data fulfilled the assumption of normality, either a Pearson correlation coefficient (t; normally distributed data) or a Kendall’s rank correlation coefficient (z; non-normally distributed data) was calculated.
Results and discussion
The MMSDB contains 7036 cetacean observation events during the study period (2005–2019), with a total of 32 297 animals observed (Table 1). The average number of cetacean observations recorded each year was 469 (SD = 269), with the lowest number of observations made during 2018 (207) and the greatest during 2012 (1000) (Supplementary Table S1). During the recent period (2015–19), 1298 observations were recorded (Table 1), which make up 18.4% of the total number of cetacean sightings in the MMSDB. Most of the observations in the recent period (72.3%) were made during summer (June–August), the period when marine activities reach their yearly peak in Svalbard. Only 155 (2.2%) observations were made during the polar night (November–February). The minke whale (Balaenoptera acutorostrata) was the species with the most observations (Table 1), comprising 29.6% of all observations. In terms of number of individuals, white whales (Delphinapterus leucas) and white-beaked dolphins (Lagenorhynchus albirostris) dominated, with 38.8% and 23.6% of the total number of individuals respectively (Table 1), which is unsurprising given their highly social lifestyles. These two species had the greatest median group sizes of the species within this study: 10 and 6, respectively (Table 1).
Table 1 Number of observations (proportion of total observations in a given time period) and median group size (rounded) by species for cetaceans observed around Svalbard, Norway, during three time periods: 2005–09 (early), 2014–19 (recent) and all years in the period 2005–2019. | ||||||||
Species | Number of observations | Number of individuals | Median group size |
| ||||
2005–09 | 2015–19 | All years 2005–2019 | 2005–09 | 2015–19 | All years 2005–2019 |
| ||
White whale | 97 (3.5%) | 231 (17.8%) | 513 (7.3%) | 1729 (17.9%) | 6852 (69.5%) | 12 542 (38.8%) | 10 |
|
Narwhal | 11 (0.4%) | 15 (1.2%) | 30 (0.4%) | 47 (0.5%) | 110 (1.1%) | 162 (0.5%) | 1 |
|
Bowhead whale | 22 (0.8%) | 28 (2.2%) | 57 (0.8%) | 47 (0.5%) | 81 (0.8%) | 142 (0.4%) | 1 |
|
White-beaked dolphin | 344 (12.5%) | 67 (5.2%) | 689 (9.8%) | 3301 (34.2%) | 1087 (11.0%) | 7622 (23.6%) | 6 |
|
Sperm whale | 61 (2.2%) | 14 (1.1%) | 117 (1.7%) | 76 (0.8%) | 14 (0.1%) | 137 (0.4%) | 1 |
|
Blue whale | 40 (1.5%) | 283 (21.8%) | 505 (7.2%) | 60 (0.6%) | 473 (4.8%) | 820 (2.5%) | 1 |
|
Fin whale | 713 (25.9%) | 192 (14.8%) | 1583 (22.5%) | 1811 (18.8%) | 387 (3.9%) | 3670 (11.4%) | 1 |
|
Humpback whale | 311 (11.3%) | 121 (9.3%) | 833 (11.8%) | 680 (7.0%) | 319 (3.2%) | 2657 (8.2%) | 1 |
|
Minke whale | 883 (32.1%) | 321 (24.7%) | 2081 (29.6%) | 1359 (14.1%) | 474 (4.8%) | 3126 (9.7%) | 1 |
|
Sei whale | 16 (0.6%) | 2 (0.2%) | 33 (0.5%) | 45 (0.5%) | 7 (<0.1%) | 86 (0.3%) | 2 |
|
Long-finned pilot whale | 3 (0.1%) | 0 | 4 (<0.1%) | 13 (0.1%) | 0 | 14 (<0.1%) | 3 |
|
Northern bottlenose | 15 (0.5%) | 3 (0.2%) | 38 (0.5%) | 43 (0.4%) | 7 (<0.1%) | 100 (0.3%) | 2 |
|
Killer whale | 21 (0.8%) | 5 (0.4%) | 42 (0.6%) | 114 (1.2%) | 13 (0.1%) | 178 (0.6%) | 3 |
|
Unidentified | 215 (7.8%) | 16 (1.2%) | 511 (7.3%) | 331 (3.4%) | 33 (0.3%) | 1041 (3.2%) | - |
|
Total | 2752 | 1298 | 7036 | 9656 | 9857 | 32 297 | - |
|
Arctic endemic species
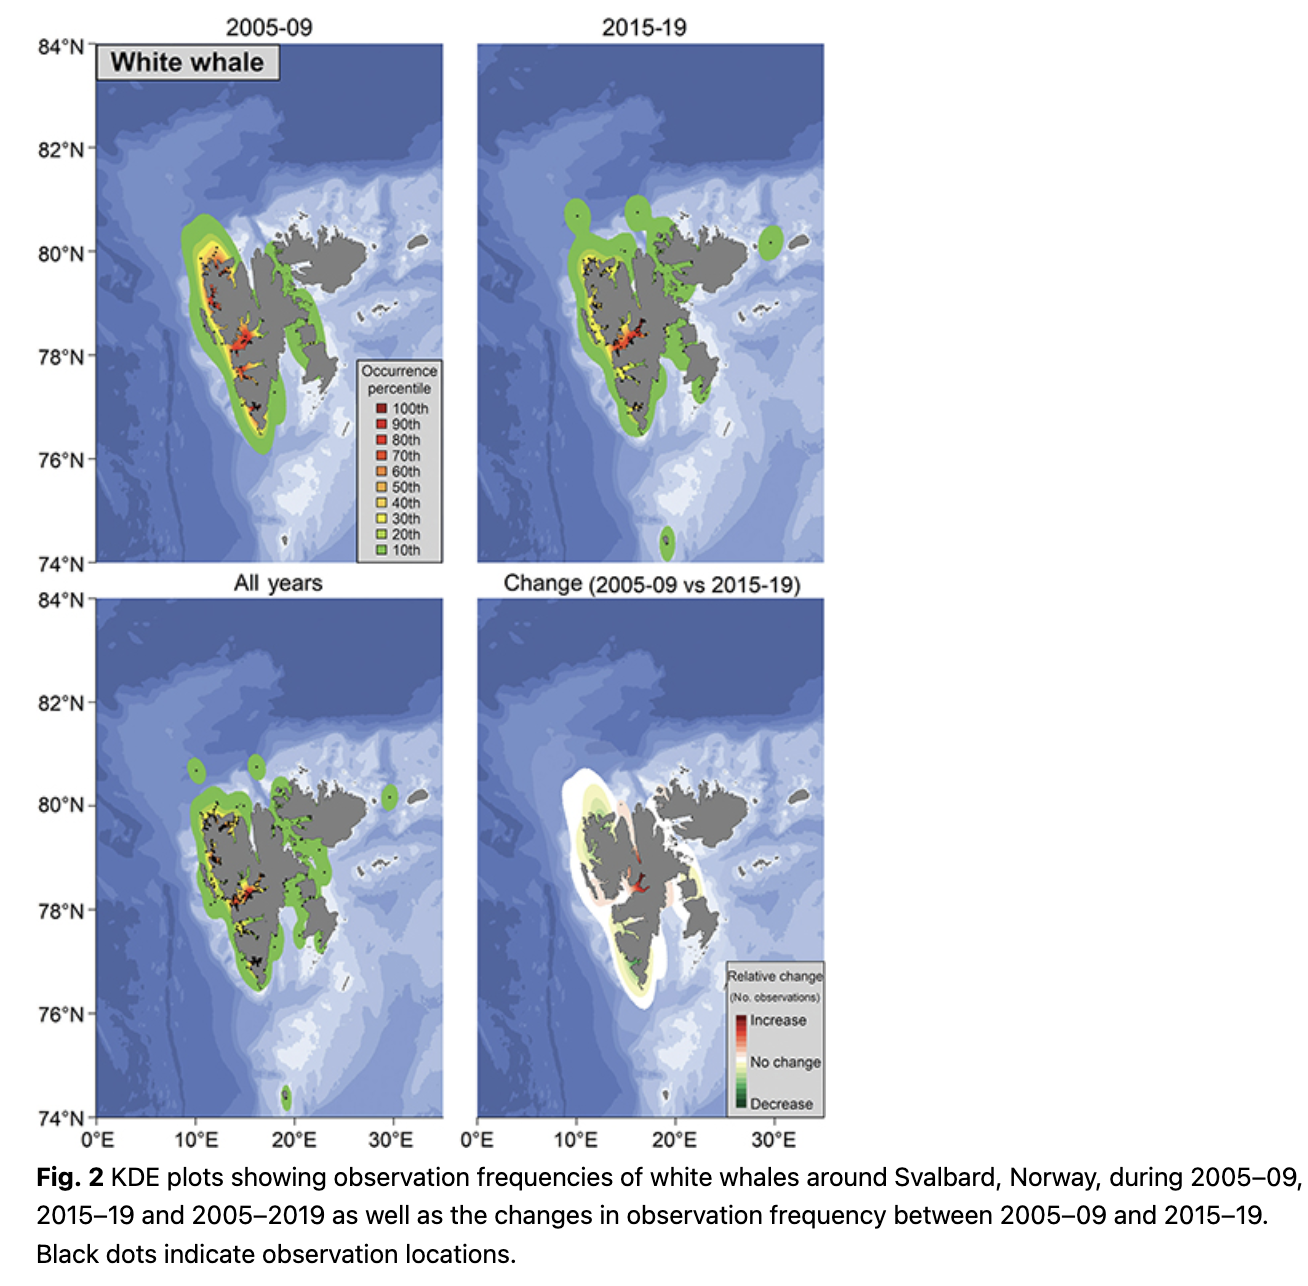
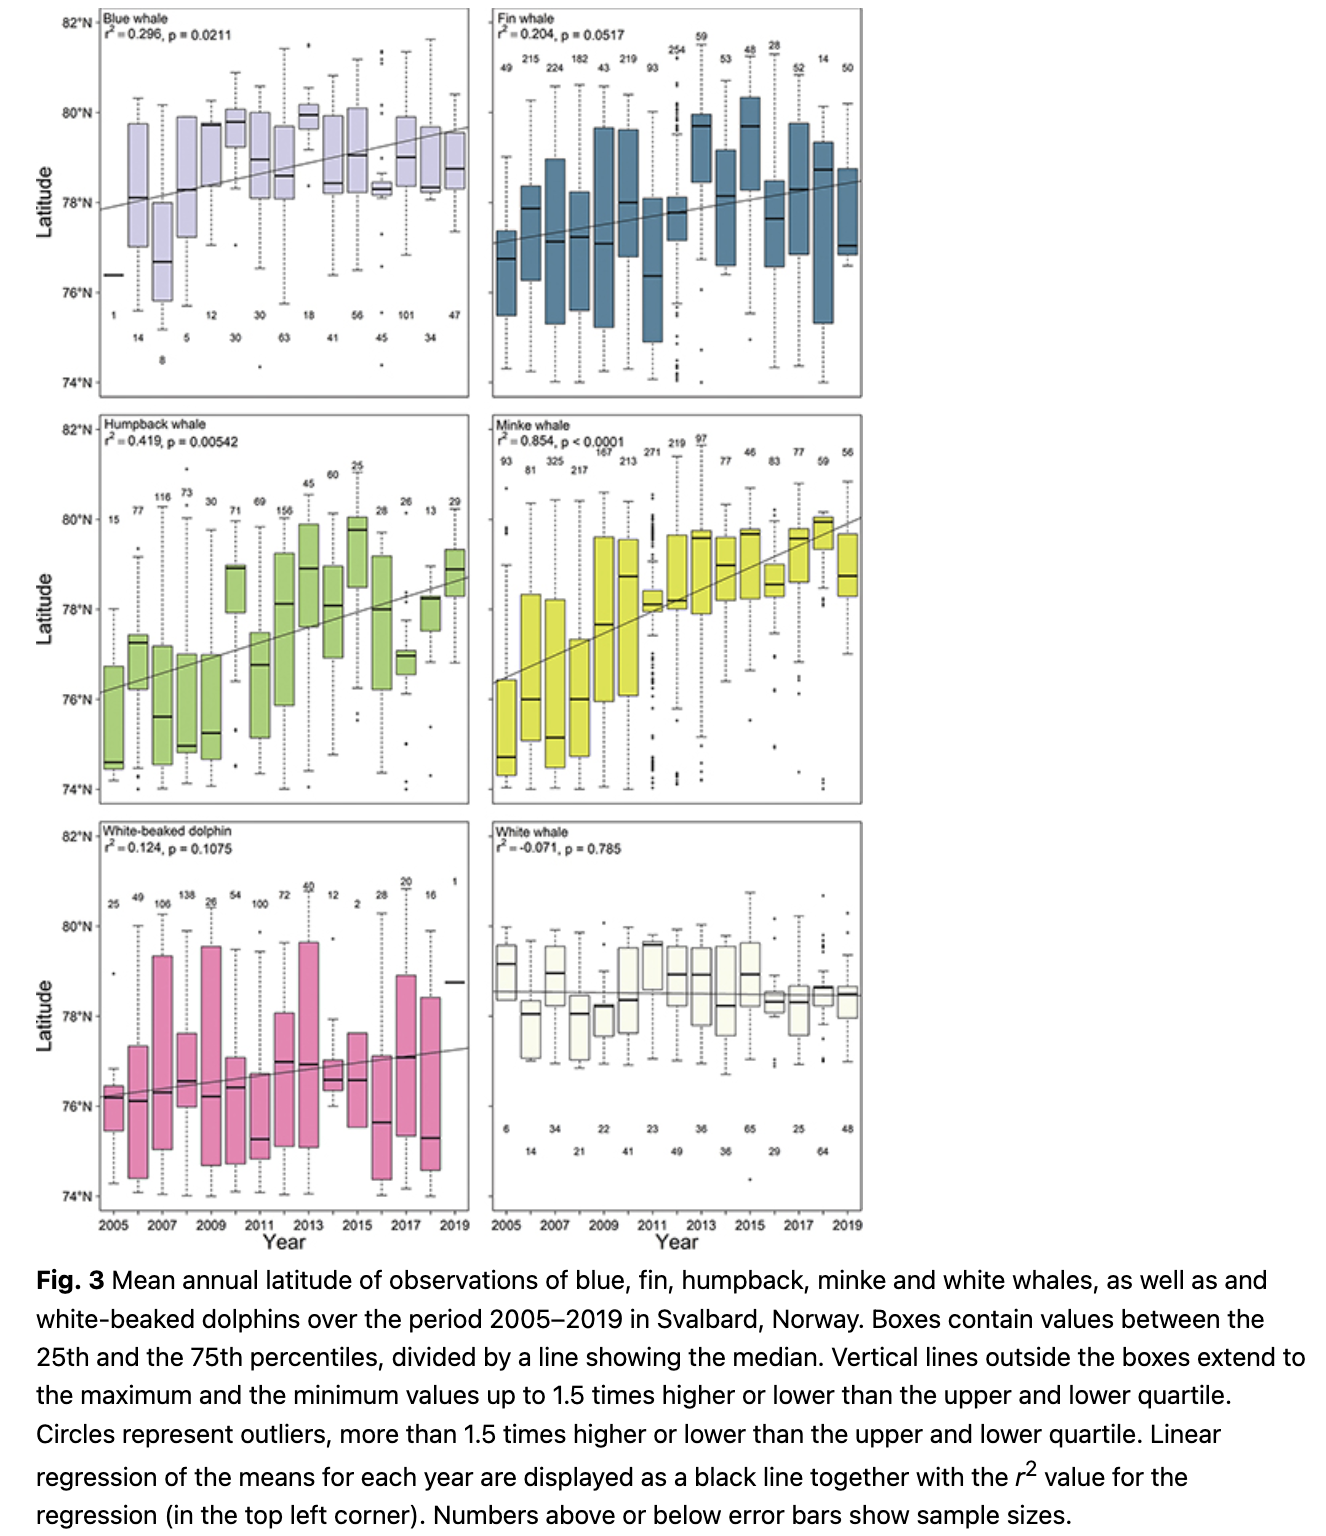
Observations of white whales, both in terms of number of observations and number of animals, were high in the fjords and close to shore, especially along the west coast of Spitsbergen (Fig. 2; Supplementary Fig. S2). This is unsurprising given their tight affiliation to the coastline and glacier fronts (Lydersen et al. 2001; Lydersen et al. 2014; Vacquié-Garcia et al. 2018; Vacquié-Garcia et al. 2020). The high observation frequency on the west coast in this study is in keeping with the known seasonal distribution of white whales, which favour the west coast of Spitsbergen during summer (Vacquié-Garcia et al. 2018). The patterns were similar during the early and the recent periods of the study and there was no significant trend in mean latitude of the observations for this species (Fig. 3). Tracking studies of white whales have shown that they spend somewhat less time immediately adjacent to glacier fronts and more time in fjords in recent years compared to two decades ago (Vacquié-Garcia et al. 2018; Hamilton et al. 2019). However, the largest relative increase in observation frequency in this study was seen deep in Billefjorden, an area with a retracting tidewater glacier (Fig. 2). This is almost certainly the consequence of increased tourism in the Isfjorden area, with day-trip excursions to Billefjorden occurring virtually daily throughout the summer.
There were only a few observations of narwhals (Monodon monceros) in recent years (Table 1), with the majority being seen in the north-eastern parts of Svalbard (Supplementary Fig. S3), similar to the majority of earlier observations of this species within the archipelago (see Gjertz 1991; Lydersen et al. 2007). However, the frequency of sightings in the past was highest in Wahlenbergfjorden, in western Nordaustlandet (Supplementary Fig. S3), while during the last five years the frequency of sightings was highest north of Svalbard, at around 81°N (Supplementary Fig. S3). During a recent survey, narwhals were observed deep into the marginal ice zone north of Svalbard (Vacquié-Garcia et al. 2017). This association with heavy pack ice probably explains why so few narwhals are observed close to Svalbard in the recent period, given the northward retreat of the edge (Walsh et al. 2017; Lebedev et al. 2019).
The Spitsbergen bowhead whale (Balaena mysticetus) stock is tightly associated with sea ice, feeding at the marginal ice zone during summer and moving deep into the pack ice during winter (Vacquié-Garcia et al. 2017; Kovacs et al. 2020). It is therefore not surprising that the few bowhead whale observations in the recent period have occurred north of the archipelago, between 80°N and 82°N (Supplementary Fig. S4). During the period 2005–09, bowhead whales were seen mostly west of 10°E (Supplementary Fig. S4) because designated bowhead expeditions took place to the sea-ice edge during several springs during that period (see Wiig et al. 2010). However, observation frequencies in the Svalbard area were highest between 10°E and 20°E in the recent period (Supplementary Fig. S4). The increased observation rates north of the archipelago, and decreased rates west of and around Spitsbergen, resemble the pattern seen for narwhals, and are likely similarly due to the northward retreat of the marginal ice zone.
Summer-resident species
Sightings of white-beaked dolphins are relatively common around Svalbard, mainly in groups: the median group size in this study was 6, though 13.6% of all white-beaked dolphin observations were of groups consisting of 20–200 animals. Most sightings of this species occurred along the continental shelf break, west of the archipelago, from 74°N to 80°N, during both the early and recent periods (Fig. 4). In terms of number of animals, the pattern through time was similar, although recently observations have been concentrated just west of the northern tip of Prins Karls Forland (Supplementary Fig. S5). Although this dolphin species is numerous in the Barents Sea region, few studies have been conducted on them. They appear to have a strong affinity to the Polar Front (Fall & Skern-Mauritzen 2014), where suitable small fish prey densities are thought to be high (Johannesen et al. 2012; Bergstad et al. 2018; Menze et al. 2020). They are therefore concentrated along the continental shelf edges because of frontal areas created by Atlantic and Arctic water masses meeting along the shelf west and south of Svalbard (Parsons et al. 1996). During 2015–19, the observation frequency of white-beaked dolphins increased east of Bjørnøya at around 22°E and in the area between Bjørnøya and the southern part of Spitsbergen, compared to 2005–09 when more sightings occurred west of Hornsund (Fig. 4). Observation frequency also increased moderately west of the north tip of Prins Karls Forland, while it decreased along the continental shelf break south of 78°N (Fig. 4). Despite these changes, observation frequencies remained high in Polar Front areas and the mean latitude of white-beaked dolphin observations did not change significantly with time (Fig. 3).

Observations of sperm whales (Physeter macrocephalus) are relatively rare in the MMSDB (Table 1), which is most likely because they feed in deep waters, off the Svalbard shelf where boats (observers) travel less frequently (e.g., Teloni et al. 2008). Sighting biases are also very likely because sperm whales spend long periods (up to hours) underwater and are very cryptic when at the surface because little of their body shows and their blows are low and diffuse. Carcasses of male sperm whales are washed ashore on the west and north coasts of Svalbard with some regularity (e.g., Derocher et al. 2002; NozoMojo 2018), indicating a regular presence of this species in Svalbard’s waters. Sperm whales were observed with high frequency east of Bjørnøya, at around 74.5°N and 15°E in 2005–09 (Supplementary Fig. S6), but recently they are more often seen in the northern parts of Forlandsundet (Supplementary Fig. S6). The relative increase in observation frequency in north-western Spitsbergen is based on few observations and should be interpreted with caution.
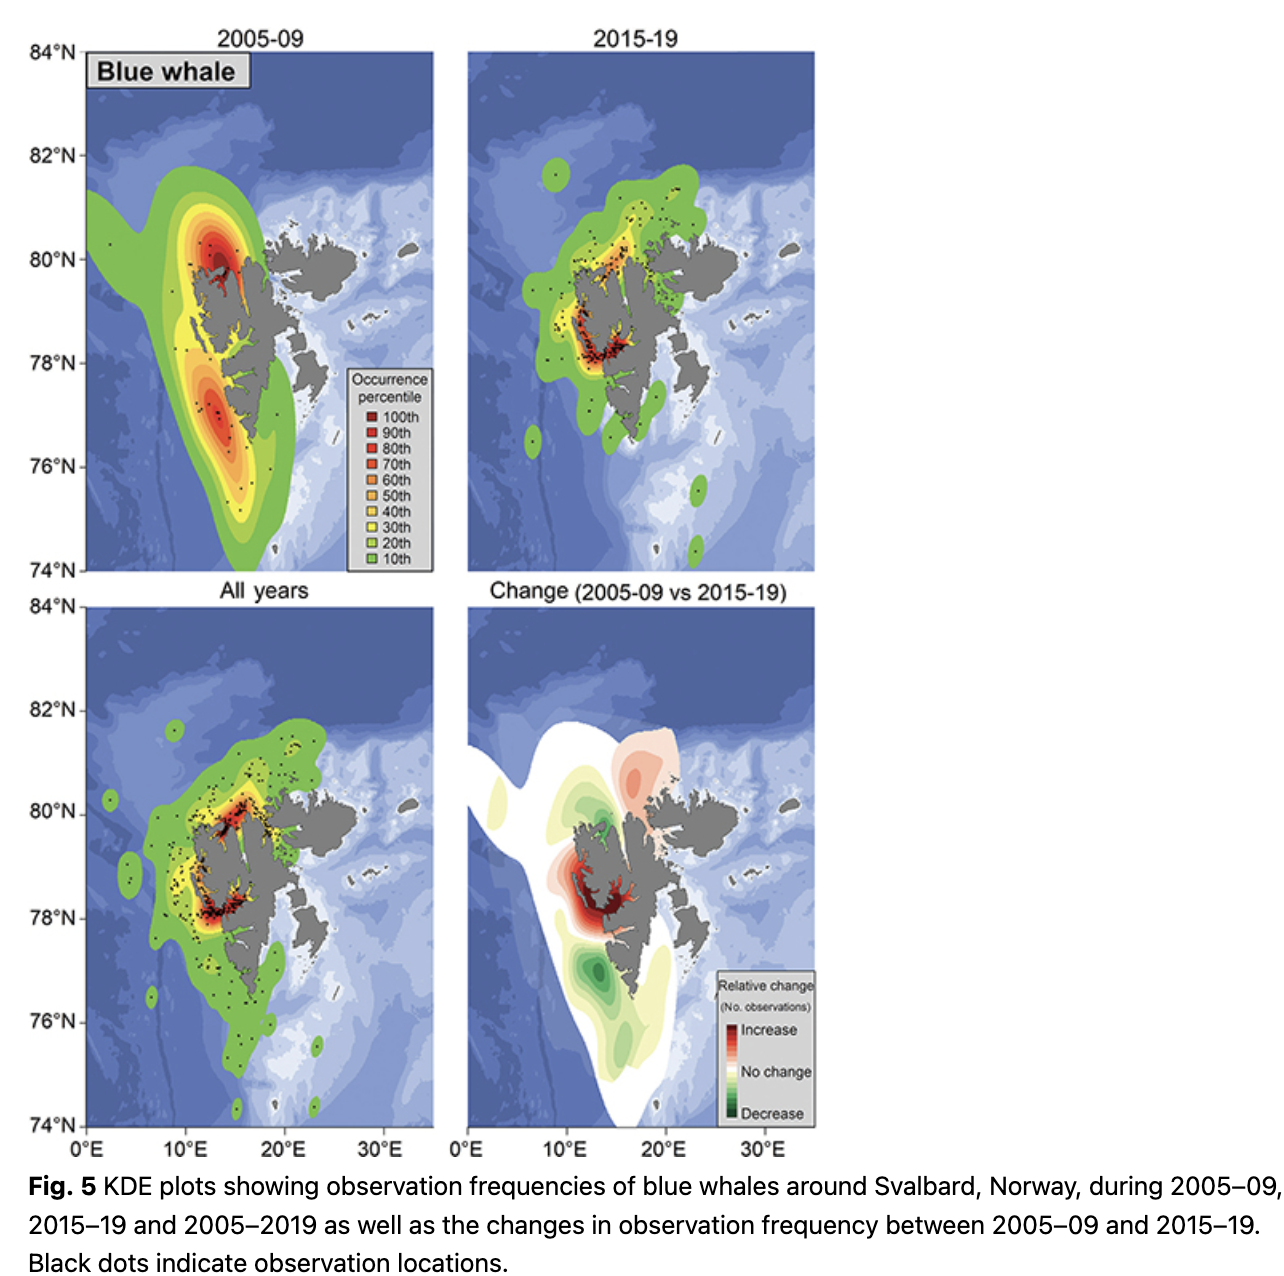
Blue whales (Balaenoptera musculus) were sighted most often in Isfjorden, Forlandsundet and in Woodfjorden (Fig. 5). During 2005–09, observation frequencies were high in the northern part of Spitsbergen around Woodfjorden and blue whales were seen with moderate frequency along the continental shelf break west of Spitsbergen. During 2015–19 observation frequencies were highest in Isfjorden and Forlandsundet (Fig. 5). Blue whales are seen more frequently within west coast fjords now compared to a decade ago, with decreased numbers of observations at the continental shelf break. The mean latitude of blue whale observations increased significantly across the study period (1.2° over a decade; p = 0.02, df = 13; Fig. 3).
Fin whales (Balaenoptera physalus) were observed most often along the shelf break west of Spitsbergen and at the mouth of Isfjorden and in Hinlopenstretet in the northeast of the archipelago (Fig. 6). The continental shelf break was a focal point for their distribution in 2005–09, but recently observation frequencies were highest in Isfjorden and north-west and south-west of Spitsbergen (Fig. 6). Observations increased in frequency in Isfjorden, Woodfjorden and north-west of Nordaustlandet, while they have decreased the shelf break south-west of Prins Karls Forland when comparing 2005–09 to 2015–19 (Fig. 6). The mean latitude of fin whale observations has not changed significantly over the study period (Fig. 3).

Humpback whales (Megaptera novaeangliae) were observed most often close to Bjørnøya at around 74°N–75°N and 18°E–22°E (Fig. 7). They were also observed quite commonly in Hornsund, Forlandsundet, Kongsfjorden, Hinlopenstretet and in the Erik Eriksenstretet (Fig. 7). In the early period from 2005–09, most humpback whale observations occurred north-east of Bjørnøya (ca 75°N and 22°E) and east of the archipelago at around 77°N and 26°E (Fig. 7). In the recent period from 2014–19, most sightings occurred in Hornsund and in Kongsfjorden (Fig. 7). Comparing the periods, humpback whales were more common in fjords along the west coast of Spitsbergen especially in Isfjorden and around the north-western part of Spitsbergen and were less common east of the archipelago and around Bjørnøya (Fig. 7). The mean latitude of humpback whale observations increased significantly with time (0.17° per year; p = 0.01, df = 13; Fig. 3).
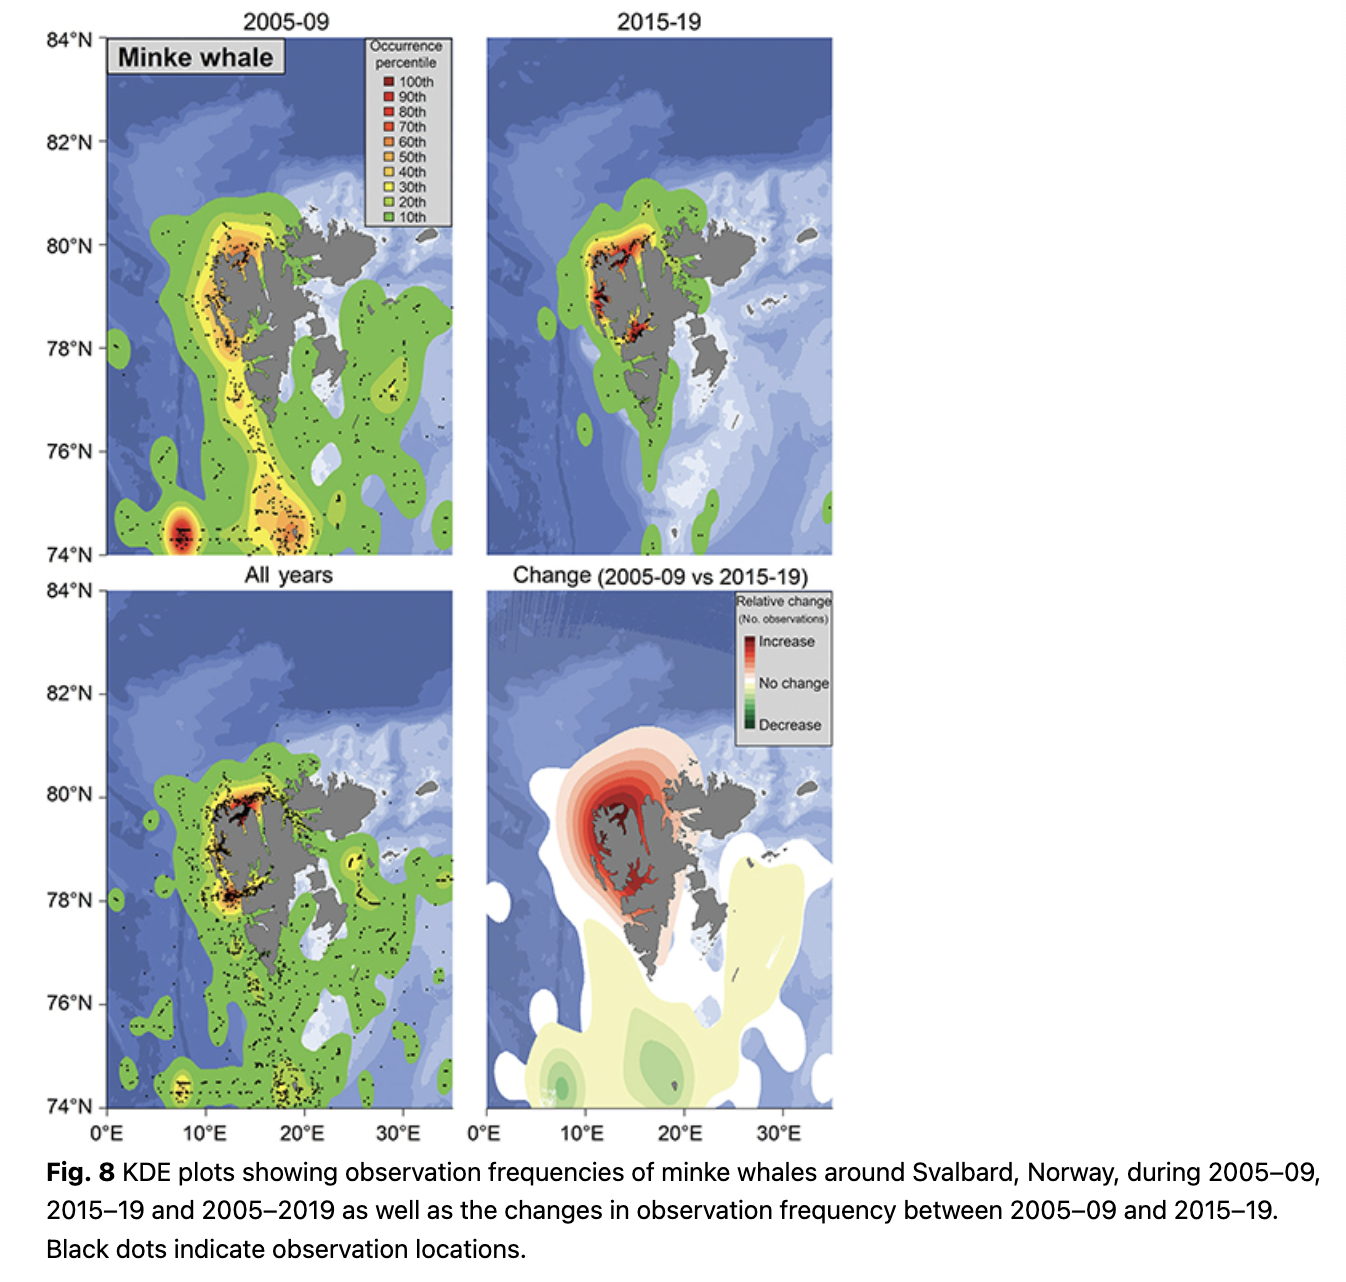
Minke whales are commonly seen in Woodfjorden/Liefdefjorden, in Kongsfjorden and at the mouth of Isfjorden (Fig. 8). During 2005–09, the continental shelf break at around 74.5°N and 7°E was a hotspot for this species and they were also commonly seen around Bjørnøya and in the north-western part of Spitsbergen (Fig. 8). From 2014–19, minke whales were most often seen in Kongsfjorden and Woodfjorden, as well as in Isfjorden (Fig. 8). Observations increased in frequency in the north-western part of Spitsbergen and in Isfjorden during 2014–19 compared to 2005–09, while they decreased somewhat south of 78°N (Fig. 8). The mean latitude of minke whale observations increased significantly throughout the study (0.24° per year; p = 5.30 * 10-7, df = 13; Fig. 3).
Blue, fin, humpback and minke whales all share a similar distributional shift, to varying degrees, with a northward expansion of their ranges and movement onto the continental shelf and into fjords and coastal areas. This tendency was observed by Storrie et al. (2018), but the trends are further accentuated with the additional data from five more years. The pattern seen for these four baleen whale species coincides with the increased inflow of AW into the fjords of western Spitsbergen during the last two decades (e.g., Tverberg et al. 2019; Skogseth et al. 2020) and is probably based on the changing distribution patterns of key prey species. More krill and different boreal and Subarctic fish species are now present in west coast fjords of Spitsbergen, concomitant with the changing water mass regime (Buchholz et al. 2010; Fossheim et al. 2015; Brand & Fischer 2016; Dalpadado et al. 2016; Bergstad et al. 2018). Blue whales are still reduced in population number and are poorly studied in the North-east Atlantic/Barents Sea, but it is known that they feed almost exclusively on krill in other parts of their range (e.g., Kawamura 1980; Gavrilchuk et al. 2014) and their distribution is tightly linked to this primary prey type (Lesage et al. 2018). Fin, humpback and minke whales are all more generalist feeders, with varying preference for krill, but all of these whales also feed on various fish species (Laidre et al. 2010; Skern-Mauritzen et al. 2011; Ressler et al. 2015). Levels of stable isotopes and persistent organic pollutants of fin and blue whales sampled around Svalbard confirm that blue whales feed on a lower trophic level than fin whales (Tartu et al. 2020). A recent tracking study of fin whales in Svalbard showed that this species occupied areas identified herein as key sites for them, for example, the shelf break west of the archipelago (Lydersen et al. 2020). Lydersen et al. (2020) also showed that fin whales occupied areas at the shelf break, north of Svalbard, which did not have a high observation frequency in this study, while other areas with high observation frequencies in this study, such as Isfjorden and Hinlopenstretet, were only briefly (if at all) visited by the tagged whales. However, it is important to note that the tracking study was conducted in late September, outside the peak summer tourist season, so these two studies should be seen as complementary seasonal snap-shots, rather than being contradictory.
The overall number of observations of seasonally resident baleen whales per year did not have a significant correlation with the fraction of AW in Isfjorden, but this correlation was positive in Kongsfjorden (z = 3.38, R = 0.76, p = 0.00072; Supplementary Fig. S7). When considering the individual species, there was a significant correlation between number of observations per year and fraction of AW for blue whales in Isfjorden (z = 2.66, R = 0.58, p = 0.0079; Supplementary Fig. S8) and for minke whales in Kongsfjorden (z = 2.01, R = 0.46, p = 0.044; Supplementary Fig. S8). Small sample sizes probably limit the detect potential of such relationships and in addition, the water mass analyses are not very high resolution.
Citizen science is a cost-effective way to acquire data on species that are otherwise challenging and expensive to study, and it is a good way to raise public interest in wildlife and science (e.g., Vann-Sander et al. 2016). However, data collected through citizen science does come with some inherent biases. Most observations recorded in the MMSDB are derived from cruises that circumnavigate Spitsbergen, the main island of the archipelago, during the summer. Such excursions focus a lot of their time on glacier fronts, walrus haul-outs and historical, cultural sites. Additionally, specific animals (e.g., large whales and polar bears) are often actively sought out and exact routes of cruises are not recorded; sampling effort undoubtedly varies somewhat between years, but it cannot be calculated precisely (Supplementary Table S1). Analyses of data like those housed in the MMSDB should therefore be focused on simple assessments of general distribution and trends over time and not be used for estimating abundance or for fine-scaled assessment of distribution patterns. (See Storrie et al. [2018] for a more thorough discussion of biases in the MMSDB.)
The observation frequency of two of the three Arctic endemic species—bowhead whales and narwhals—has increased north of Svalbard and decreased in coastal areas and fjords of the archipelago. This is concomitant with a retreating sea-ice edge, with which they are associated. White whales have, however, maintained their tightly coastal distribution. Similar to white whales, white-beaked dolphins showed no signs of a northward distribution shift. However, all other seasonally resident species showed signs of shifting from the shelf break to coastal areas and fjords in Svalbard, and most had clear northward trends in their distribution patterns. This is most likely a consequence of more boreal prey species, associated with the increased inflow of AW to west coast fjords within the archipelago, although the correlation between the number of observations per year and the fraction of AW in the fjords was only significant in some cases. This highlights the need for continued research, for example, through satellite tracking, for a deeper understanding of habitat use by cetaceans in Svalbard, while citizen science serves as a good complement and a cost-efficient way to detect large scale distributional changes.
Acknowledgements
The authors thank the Norwegian Coast Guard, the Marine Research Institute, the Association of Arctic Expedition Cruise Operators and the Governor of Svalbard’s field teams, among others, for contributing observations to the MMSDB. Siri Uldal (NPI) developed the software frames for the MMSDB. Magnus Andersen (NPI) quality checked, and maintained records of the sightings, in the MMSDB. Oddveig Øien Ørvoll (NPI) created the map of the study area.
References
- Bengtsson O., Hamilton C.D., Lydersen C., Andersen M. & Kovacs K.M. 2021. Distribution and habitat characteristics of pinnipeds and polar bears in the Svalbard Archipelago, 2005–2018. Polar Research 40, article no. 5326, doi: 10.33265/polar.v40.5326.
- Bergstad O.A., Johannesen E., Høines Å., Ellingsen K.E., Lien V.S., Byrkjedal I., Yoccoz N.G., Tveraa T., Wienerroither R., Langhelle G. & de Lange Wenneck T. 2018. Demersal fish assemblages in the boreo-Arctic shelf waters around Svalbard during the warm period 2007–2014. Polar Biology 41, 125–142, doi: 10.1007/s00300-017-2176-2.
- Brand M. & Fischer P. 2016. Species composition and abundance of the shallow water fish community of Kongsfjorden, Svalbard. Polar Biology 39, 2155–2167, doi: 10.1007/s00300-016-2022-y.
- Buchholz F., Buchholz C. & Weslawski J.M. 2010. Ten years after: krill as indicator of changes in the macro-zooplankton communities of two Arctic fjords. Polar Biology 33, 101–113, doi: 10.1007/s00300-009-0688-0.
- Chacón J.E. & Duong T. 2018. Multivariate kernel smoothing and its applications. Boca Raton, FL: CRC Press.
- Core Writing Team, Pachauri R.K. & Meyer L. 2014. Climate change 2014: synthesis report. Geneva: Intergovernmental Panel on Climate Change.
- Dalpadado P., Hop H., Rønning J., Pavlov V., Sperfeld E., Buchholz F., Rey A. & Wold A. 2016. Distribution and abundance of euphausiids and pelagic amphipods in Kongsfjorden, Isfjorden and Rijpfjorden (Svalbard) and changes in their relative importance as key prey in a warming marine ecosystem. Polar Biology 39, 1765–1784, doi: 10.1007/s00300-015-1874-x.
- Derocher A.E., Wiig Ø. & Andersen M. 2002. Diet composition of polar bears in Svalbard and the western Barents Sea. Polar Biology 25, 448–452, doi: 10.1007/s00300-002-0364-0.
- Descamps S., Aars J., Fuglei E., Kovacs K.M., Lydersen C., Pavlova O., Pedersen Å.Ø., Ravolainen V. & Strøm H. 2017. Climate change impacts on wildlife in a High Arctic archipelago—Svalbard, Norway. Global Change Biology 23, 490–502, doi: 10.1111/gcb.13381.
- Fall J. & Skern-Mauritzen M. 2014. White-beaked dolphin distribution and association with prey in the Barents Sea. Marine Biology Research 10, 957–971, doi: 10.1080/17451000.2013.872796.
- Fossheim M., Primicerio R., Johannesen E., Ingvaldsen R.B., Aschan M.M. & Dolgov A.V. 2015. Recent warming leads to a rapid borealization of fish communities in the Arctic. Nature Climate Change 5, 673–677, doi: 10.1038/nclimate2647.
- Gavrilchuk K., Lesage V., Ramp C., Sears R., Bérubé M., Bearhop S. & Beauplet G. 2014. Trophic niche partitioning among sympatric baleen whale species following the collapse of groundfish stocks in the Northwest Atlantic. Marine Ecology Progress Series 497, 285–301, doi: 10.3354/meps10578.
- Gjertz I. 1991. The narwhal, Monodon monoceros, in the Norwegian high Arctic. Marine Mammal Science 7, 402–408, doi: 10.1111/j.1748-7692.1991.tb00115.x.
- Hamilton C.D., Vacquié-Garcia J., Kovacs K.M., Ims R.A., Kohler J. & Lydersen C. 2019. Contrasting changes in space use induced by climate change in two Arctic marine mammal species. Biology Letters 15, 20180834, doi: 10.1098/rsbl.2018.0834.
- Johannesen E., Høines Å.S., Dolgov A.V. & Fossheim M. 2012. Demersal fish assemblages and spatial diversity patterns in the Arctic–Atlantic transition zone in the Barents Sea. PLoS One 7, e34924, doi: 10.1371/journal.pone.0034924.
- Kawamura A. 1980. A review of food of balaenopterid whales. Scientific Reports of the Whales Research Institute 32, 155–197.
- Kovacs K.M., Lydersen C., Overland J.E. & Moore S.E. 2011. Impacts of changing sea-ice conditions on Arctic marine mammals. Marine Biodiversity 41, 181–194, doi: 10.1007/s12526-010-0061-0.
- Kovacs K.M., Lydersen C., Vacquiè-Garcia J., Shpak O., Glazov D. & Heide-Jørgensen M.P. 2020. The endangered Spitsbergen bowhead whales’ secrets revealed after hundreds of years in hiding. Biology Letters 16, article no. 20200148, doi: 10.1098/rsbl.2020.0148.
- Laidre K.L., Heide-Jørgensen M.P., Heagerty P., Cossio A., Bergström B. & Simon M. 2010. Spatial associations between large baleen whales and their prey in west Greenland. Marine Ecology Progress Series 402, 269–284, doi: 10.3354/meps08423.
- Laidre K.L., Stern H., Kovacs K.M., Lowry L., Moore S.E., Regehr E.V., Fergusson S.H., Wiig Ø., Boveng P., Angliss R.P., Born E.W., Litovka D., Quakenbush L., Lydersen C., Vongraven D. & Ugarte F. 2015. Arctic marine mammal population status, sea ice habitat loss, and conservation recommendations for the 21st century. Conservation Biology 29, 724–737, doi: 10.1111/cobi.12474.
- LaRue M.A., Ainley D.G., Pennycook J., Stamatiou K., Salas L., Nur N., Stammerjohn S. & Barrington L. 2020. Engaging ‘the crowd’ in remote sensing to learn about habitat affinity of the Weddell seal in Antarctica. Remote Sensing in Ecology and Conservation 6, 70–78, doi: 10.1002/rse2.124.
- Lebedev S.A., Kostianoy A.G. & Popov S.K. 2019. Satellite altimetry of sea level and ice cover in the Barents Sea. Ecologica Montenegrina 25, 26–35, doi: 10.37828/em.2019.25.3.
- Lesage V., Gosselin J.-F., Lawson J.W., McQuinn I., Moors-Murphy H., Plourde S., Sears R. & Simard Y. 2018. Habitats important to blue whales (Balaenoptera musculus) in the western North Atlantic. DFO Canadian Science Advisory Secretariat Research Document 2016/080. Ottawa: Fisheries and Oceans Canada.
- Lind S., Ingvaldsen R.B. & Furevik T. 2018. Arctic warming hotspot in the northern Barents Sea linked to declining sea-ice import. Nature Climate Change 8, 634–639, doi: 10.1038/s41558-018-0205-y.
- Lodi L. & Tardin R. 2018. Citizen science contributes to the understanding of the occurrence and distribution of cetaceans in southeastern Brazil—a case study. Ocean & Coastal Management 158, 45–55, doi: 10.1016/j.ocecoaman.2018.03.029.
- Lydersen C., Assmy P., Falk-Petersen S., Kohler J., Kovacs K.M., Reigstad M., Steen H., Strøm H., Sundfjord A., Varpe Ø., Walczowski J.M. & Zajaczkowski M. 2014. The importance of tidewater glaciers for marine mammals and seabirds in Svalbard, Norway. Journal of Marine Systems 129, 452–471, doi: 10.1016/j.jmarsys.2013.09.006.
- Lydersen C., Martin A.R., Gjertz I. & Kovacs K.M. 2007. Satellite tracking and diving behaviour of sub-adult narwhals (Monodon monoceros) in Svalbard, Norway. Polar Biology 30, 437–442, doi: 10.1007/s00300-006-0200-z.
- Lydersen C., Martin A.R., Kovacs K.M. & Gjertz I. 2001. Summer and autumn movements of white whales Delphinapterus leucas in Svalbard, Norway. Marine Ecology Progress Series 219, 265–274, doi: 10.3354/meps219265.
- Lydersen C., Vacquié-Garcia J., Heide-Jørgensen M.P., Øien N., Guinet C. & Kovacs K.M. 2020. Autumn movements of fin whales (Balaenoptera physalus) from Svalbard, Norway, revealed by satellite tracking. Scientific Reports 10, article no. 16966, doi: 10.1038/s41598-020-73996-z.
- Menze S., Ingvaldsen R.B., Nikolopoulos A., Hattermann T., Albretsen J. & Gjøsæter H. 2020. Productive detours—Atlantic Water inflow and acoustic backscatter in the major troughs along the Svalbard shelf. Progress in Oceanography 188, article no. 102447, doi: 10.1016/j.pocean.2020.102447.
- NozoMojo (Nozo Mojo Tours & Arts for Nature Conservation) 2018. Svalbard. Season report. June 3 – September 10, 2017. Accessed on the internet at https://nozomojo.com/wp-content/uploads/2018/02/Svalbard-2017-SR.pdf on 11 November 2020.
- Parsons A.R., Bourke R.H., Muench R.D., Chiu C.S., Lynch J.F., Miller J.H., Plueddemann A.J. & Pawlowicz R. 1996. The Barents Sea polar front in summer. Journal of Geophysical Research—Oceans 101, 14201–14221, doi: 10.1029/96JC00119.
- Pörtner H.-O., Roberts D.C., Masson-Delmotte V., Zhai P., Tignor M., Poloczanska E., Mintenbeck K., Alegría A., Nicolai M., Okem A., Petzold J., Rama B. & Weyer N.M. (eds.) 2019. The ocean and cryosphere in a changing climate. A special report of the Intergovernmental Panel on Climate Change. Geneva: Intergovernmental Panel on Climate Change.
- R Core Team 2020. R: a language and environment for statistical computing. Vienna: R Foundation for Statistical Computing.
- Ressler P.H., Dalpadado P., Macaulay G.J., Handegard N. & Skern-Mauritzen M. 2015. Acoustic surveys of euphausiids and models of baleen whale distribution in the Barents Sea. Marine Ecology Progress Series 527, 13–29, doi: 10.3354/meps11257.
- Silverman B.W. 1986. Density estimation for statistics and data analysis. London: Chapman and Hall.
- Skern-Mauritzen M., Johannesen E., Bjørge A. & Øien N. 2011. Baleen whale distributions and prey associations in the Barents Sea. Marine Ecology Progress Series 426, 289–301, doi: 10.3354/meps09027.
- Skogseth R., Olivier L.L., Nilsen F., Falck E., Frase N., Tverberg V., Ledang A.B., Vader A., Jonassen M.O., Søreide J., Cottier F., Berge J., Ivanov B.V. & Falk-Petersen S. 2020. Variability and decadal trends in the Isfjorden (Svalbard) ocean climate and circulation—an indicator for climate change in the European Arctic. Progress in Oceanography 187, article no. 102394, doi: 10.1016/j.pocean.2020.102394.
- Spielhagen R.F., Werner K., Sørensen S.A., Zamelszyk K., Kandiano E., Budeus G., Husum K., Marchitto T. & Hald M. 2011. Enhanced modern heat transfer to the Arctic by warm Atlantic Water. Science 331, 450–453, doi: 10.1126/science.1197397.
- Stephenson F., Goetz K., Sharp B.R., Mouton T.L., Beets F.L., Roberts J., MacDiarmid A.B., Constantine R. & Lundquist C.J. 2020. Modelling the spatial distribution of cetaceans in New Zealand waters. Diversity and Distributions 26, 495–516, doi: 10.1111/ddi.13035.
- Storrie L., Lydersen C., Andersen M., Wynn R.B. & Kovacs K.M. 2018. Determining the species assemblage and habitat use of cetaceans in the Svalbard Archipelago, based on observations from 2002 to 2014. Polar Research 37, article no. 1463065, doi: 10.1080/17518369.2018.1463065.
- Tartu S., Fisk A.T., Götsch A., Kovacs K.M., Lydersen C. & Routti H. 2020. First assessment of pollutant exposure in two balaenopterid whale populations sampled in the Svalbard Archipelago, Norway. Science of the Total Environment 718, 137327, doi: 10.1016/j.scitotenv.2020.137327.
- Teloni V., Mark J.P., Patrick M.J. & Peter M.T. 2008. Shallow food for deep divers: Dynamic foraging behavior of male sperm whales in a high latitude habitat. Journal of Experimental Marine Biology and Ecology 354, 119–131, doi: 10.1016/j.jembe.2007.10.010.
- Tverberg V., Nøst O.A., Lydersen C. & Kovacs K.M. 2014. Winter sea ice melting in the Atlantic Water subduction area, Svalbard, Norway. Journal of Geophysical Research—Oceans 119, 5945–5967, doi: 10.1002/2014JC010013.
- Tverberg V., Skogseth R., Cottier F., Sundfjord A., Walczowski W., Inall M.E., Falck E., Pavlova O. & Nilsen F. 2019. The Kongsfjorden Transect: seasonal and inter-annual variability in hydrography. In H. Hop & C. Wiencke (eds.): The ecosystem of Kongsfjorden, Svalbard. Pp. 49–104. Doi: 10.1007/978-3-319-46425-1_3. Cham, Switzerland: Springer.
- Vacquié-Garcia J., Lydersen C., Ims R.A. & Kovacs K.M. 2018. Habitats and movement patterns of white whales Delphinapterus leucas in Svalbard, Norway in a changing climate. Movement Ecology 6, article no. 21, doi: 10.1186/s40462-018-0139-z.
- Vacquié-Garcia J., Lydersen C., Marques T.A., Aars J., Ahonen H., Skern-Mauritzen M. & Kovacs K.M. 2017. Late summer distribution and abundance of ice-associated whales in the Norwegian High Arctic. Endangered Species Research 32, 59–70, doi: 10.3354/esr00791.
- Vacquié-Garcia J., Lydersen C., Marques T.A., Andersen M. & Kovacs K.M. 2020. First abundance estimate for white whales Delphinapterus leucas in Svalbard, Norway. Endangered Species Research 41, 253–263, doi: 10.1186/s40462-018-0139-z.
- Vann-Sander S., Clifton J. & Harvey E. 2016. Can citizen science work? Perceptions of the role and utility of citizen science in a marine policy and management context. Marine Policy 72, 82–93, doi: 10.1016/j.marpol.2016.06.026.
- Walsh J.E., Fetterer F., Scott Stewart J. & Chapman W.L. 2017. A database for depicting Arctic sea ice variations back to 1850. Geographical Review 107, 89–107, doi: 10.1111/j.1931-0846.2016.12195.x.
- Wand M.P. & Jones M.C. 1994. Multivariate plug-in bandwidth selection. Computational Statistics 9, 97–116.
- Wiig Ø., Bachmann L., Øien N., Kovacs K.M. & Lydersen C. 2010. Observations of bowhead whales (Balaena mysticetus) in the Svalbard area 1940–2009. Polar Biology 33, 979–984, doi: 10.1007/s00300-010-0776-1.
Related Articles
Luke Storrie
Christian Lydersen
Magnus Andersen
Russell B. Wynn
et al.
Heidi Ahonen
Kathleen M. Stafford
Christian Lydersen
Laura de Steur
et al.
Torben Koenigk
Peter Berg
Ralf Döscher
Christian Lydersen
Kit M. Kovacs
Jade Vaquie-Garcia
Espen Lydersen
et al.
Karen Lone
Jon Aars
Christian Lydersen
Kit M. Kovacs
et al.