This article is published under a Creative Commons license and not by the author of the article. So if you find any inaccuracies, you can correct them by updating the article.

Determining the species assemblage and habitat use of cetaceans in the Svalbard Archipelago, based on observations from 2002 to 2014


Luke Storrie
Christian Lydersen
Magnus Andersen
Russell B. Wynn
Kit M. Kovacs
Published: June 1, 2018
Latest article update: Aug. 7, 2023
This article is published under the license


Abstract
This study used 13 years of cetacean sighting data (2002–2014) from waters around the Svalbard Archipelago to determine key habitats for year-round resident species as well as seasonally resident species, and to explore spatial overlap between these groups via a combination of kernel density estimation and Maxent modelling. The data set consists of observations made by research vessels conducting various marine studies, coast guard ships and marine-cruise tourist operators. Data are reported from the seasonal period in which there is daylight (March-November), though 95% of the observations occurred June- September. Changes over the study period were investigated, within the limits of the data, to explore whether range shifts may be occurring. Fifteen cetacean species were reported. Among the resident ice-associated cetaceans, only white whales were reported frequently; they were seen exclusively in coastal habitats, in accordance with their known use of tidal glacier fronts for feeding in this region. Narwhal and bowhead whales were rare. Seasonally resident minke whales, fin whales, humpback whales, blue whales and sperm whales as well as small dolphins were seen frequently, in broad and somewhat overlapping habitats. Other less common seasonal residents included killer whales, northern bottlenose whales and sei whales; harbour porpoises and long-finned pilot whales were also reported, but rarely. Shifts over the study period towards higher latitudes, and into coastal environments, were observed for several seasonally resident species. These expansions are likely linked to warming ocean temperatures and a precipitous decline in sea-ice cover in the area.
Keywords
Climate change, citizen science, Arctic, whales, marine mammals, Maxent modelling
Introduction
Understanding both the geographic range and the habitat use of a species is fundamental to characterizing its ecology and enabling predictions regarding how it will react to environmental changes (Gaston & Fuller 2009). Large, highly mobile marine predators that do not easily carry tracking devices present a challenge in this regard, as is the case for all cetaceans. However, understanding the distribution of these animals is particularly important because they exert strong top-down control on their prey (Ainley et al. 2007; Bowen 1997; Coyle et al. 2007; Surma & Pitcher 2015) and are a major source of interference competition with other predators (Fraser et al. 1992; Ainley & Hyrenbach 2010), and thus have far-reaching effects on the ecosystems they occupy. It has recently become clear that cetaceans are also important in stimulating productivity, particularly in iron- limited regions (e.g., Lavery et al. 2014). The dramatic changes in distribution and abundance of the “Great Whales” due to extensive hunting in previous centuries have had significant impacts on the environments they occupy (Hacquebord 1999; Rugh et al. 2003). Many cetacean species are now recovering, but this is occurring during a time of rapid environmental change, particularly in polar regions, so it is likely that new distributional patterns will become established (Smetacek & Nicol 2005; MacLeod 2009; Scheffers et al. 2016; Thomas et al. 2016).
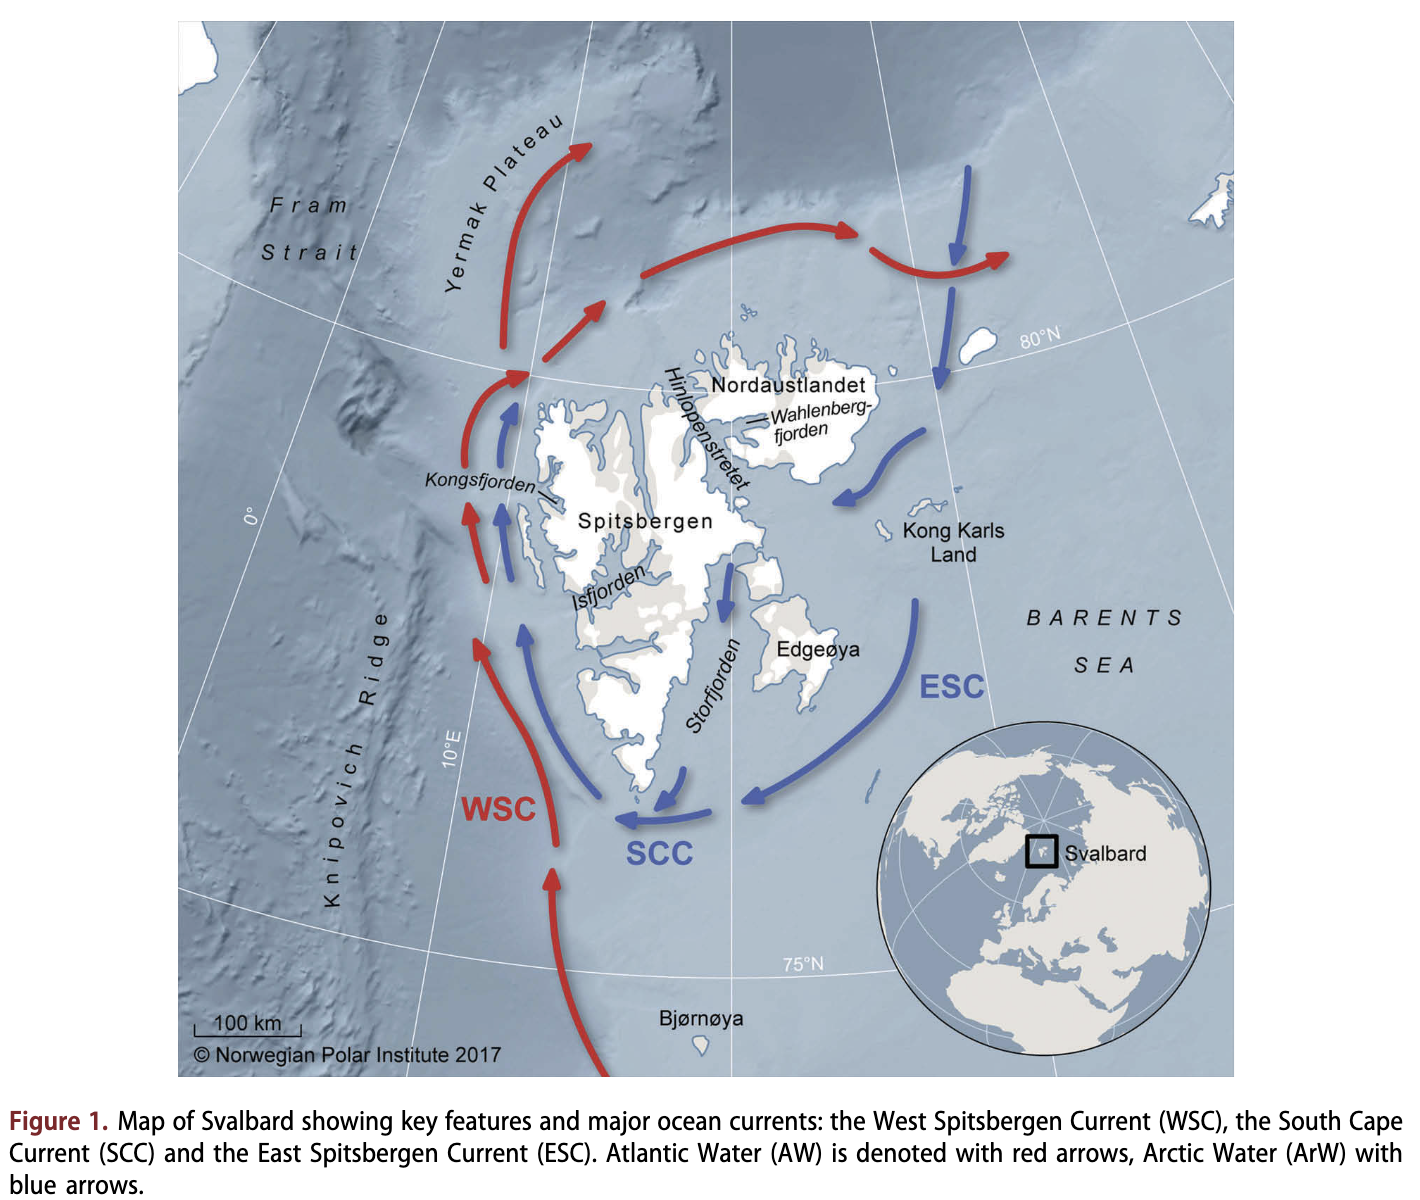
The Svalbard Archipelago, located in the High Arctic within the North-east Atlantic (Fig. 1), has an ecological and cultural history that is intimately associated with cetaceans (e.g., Arlov 1994). The first large-scale commercial harvesting of whales, which commenced in the early 1600s, was based in and around this group of islands (Hacquebord 1999). Vast numbers of whales were taken in the centuries that followed, involving a wide array of species (Burnett 2012). The bowhead whale (Balaena mysticetus) population in this region was driven to the brink of extinction before becoming protected in 1939. Other whale species were also depleted, and iteratively protected. Only minke whales (Balaenoptera acutorostrata) are currently harvested in the region; regular surveys ensure that catches are sustainable (Bogstad et al. 2015). However, very little is known about current trends in abundance or distribution and habitat use of Arctic resident or other seasonally occurring cetacean species in this Arctic gateway, which is a known hotspot for cetaceans (Kovacs & Lydersen 2006). Updated knowledge regarding the cetacean community around the Svalbard Archipelago is of particular importance because the region is undergoing profound physical and biological changes associated with warming ocean temperatures. Air and water temperatures are increasing (see Descamps et al. 2017 for a review), while sea-ice coverage is concomitantly decreasing (Onarheim et al. 2014; Pavlova et al. 2014; Laidre et al. 2015). These changes to the physical environment are dramatically altering biota in the region, with boreal invertebrate and fish species replacing traditionally Arctic species (e.g., Fossheim et al. 2015; Dalpadado et al. 2016; Gluchowska et al. 2016). The changing ice conditions in particular are also resulting in substantial increases in ship traffic and industrial interest in the region, which represent potential risks to cetaceans (e.g., Reeves et al. 2014).
Despite the near extinction of bowhead whales due to overharvesting, all three ice-associated endemic Arctic whales - bowhead whales, white whales (Delphinapterus leucas) and narwhal (Monodon mono- ceros) - still occupy the waters around Svalbard (Kovacs et al. 2009). These year-round residents of the High Arctic are all well adapted to living in ice-covered seas, where the sea ice shelters their young from storms, provides protection from killer whales (Orcinus orca) and offers an environment with little competition for available prey (Kovacs et al. 2011). These species have evolved life-history traits that buffer the normal, high levels of inter-annual fluctuation in climate in the Arctic (Harington 2008). However, the current rapid declines of their sea-ice habitats are a serious concern (Kovacs et al. 2011; Laidre et al. 2015), and the first responses to these declines are likely to be changes in distribution (Tynan & DeMaster 1997; Gilg et al. 2012).
Svalbard waters also provide important summer foraging habitats for seasonally resident, migratory baleen whales, including the minke whale, fin whale (Balaenoptera physalus), humpback whale (Megaptera novaeangliae) and blue whale (B. musculus) (Kovacs & Lydersen 2006). White-beaked dolphins (Lagenorhyn- chus albirostris), killer whales, long-finned pilot whales (Globicephala melas), sperm whales (Physeter macro- cephalus) and northern bottlenose whales (Hyperoodon ampullatus) are also known to occur in this region (Kovacs et al. 2009; Skem-Mauritzen et al. 2011).
Monitoring cetacean distributions over relatively large spatial scales in the Arctic is logistically and financially challenging. However, data can be gathered on these highly visible animals in some areas by engaging “citizen science”: using volunteers under the guidance of professional scientists and naturalists to collect robust data in order to answer scientific questions (Silvertown 2009; Thiel et al. 2014). The use of citizen science to assess habitat use by cetaceans in the Svalbard area is feasible because of the attractiveness of these animals to the flourishing marine cruise tourist industry. This study used 13 years of cetacean sighting data (2002-2014) from waters around the Svalbard Archipelago (Fig. 1) to provide a baseline description of the assemblage of cetaceans in this region, with the aim of identifying key habitats for year- round resident Arctic species and seasonally resident species and to explore spatial overlap between these groups. Temporal changes over the period of study were also investigated, within the limits of the data, to explore whether range changes may be occurring.
Materials and methods
The Marine Mammal Sightings Database
Cetacean sightings data have been collected in the waters surrounding the Svalbard Archipelago in the Norwegian Arctic (74-84°N, 0-35°E; Fig. 1) since 2002. These data are stored in the NPI’s MMSDB (http://www.npolar.no/en/services/mms).
Contributors to this database include Norwegian Coast Guard vessels, research vessels operating in Svalbard waters from the Institute of Marine Research, the Norwegian Polar Institute and other organizations, the Governor of Svalbard’s field inspectors, and marine cruise tourist operators (hereafter called EVs, most notably vessels associated with the AECO. The latter group accounts for approximately half of the data reported.
Most data are reported to the MMSDB via a custom-designed data-inputting software package (available at http://www.npolar.no/en/services/mms). These records include species identification, the number of individuals (pod size), the latitude and longitude of the observation, date, ship name, contact person and any other comments that the observers deem worth reporting related to the animals’ behaviour, sex, age classes, etc. EVs all have at least two observers around the clock (24-hour light in summer), minimally two crew members stationed on the bridge and sometimes also several dedicated cetacean experts (as well as pinniped, polar bear and bird experts) actively looking for animals.
In July 2015, interviews were conducted with staff aboard some of the EVs that contribute regularly to the MMSDB, including: MV Sea Adventurer and MV Ocean Nova (Quark Expeditions); MS Quest (Polar Quest); MV Ortelius (Oceanwide Expeditions); MS Malmo and MS Origo (Expeditions Origo), as well as MS Havsel (a vessel used for tourists and film crews in Svalbard waters). Staff confirmed that all observers were able to identify all cetacean species seen in the Svalbard region confidently, and that they recorded observations as “unidentified whale” or “unidentified dolphin” if there was any uncertainty. Staff also confirmed that all cetacean observations are routinely recorded, as well as the number of animals seen; estimates are made for particularly large groups. NPI marine mammal scientists oversee all data entering the MMSDB and check unexpected or rare observations with persons reporting them; rare sightings are usually confirmed via photographic evidence.
The data set used herein includes all of the cetacean observations during the months with daylight in the Svalbard region (March through November) as research vessels have activity throughout most of the period with light at these high latitudes. EVs operate principally from June through September. Only the Norwegian Coast Guard operates year-round, and the few observations reported from the dark period (December-February) were not included in this study because of the risk of misidentification. EVs typically travel from Tromso in northern Norway to Longyearbyen in Svalbard, before cruising within the Svalbard Archipelago. The favoured route circumnavigates Spitsbergen, the largest island in the archipelago, although many boats also go along the continental slope to the west of Spitsbergen, and around the islands in the north-east when conditions permit. The Norwegian Coast Guard and research vessels have much greater spatial coverage, moving throughout most of the study area, including heavily ice-covered waters.
In this study, the terms “observation”, “sighting” and “record” are used to denote a single recorded observation, which can consist of an individual animal of one species, or a group of animals of one species seen together. Dolphins (of the genus Lagenorhynchus) were treated as a single group for analyses (hereafter referred to as “small dolphins”)
because of the large number of reports of undifferentiated dolphins; white-beaked dolphins are known to be the most common dolphin in the Svalbard region (Kovacs et al. 2009), but white-sided dolphins (I. acutus) also occur.
Data analyses
In order to place cetacean observations within the bathymetric and physical oceanographic context in which they occurred, a grid with cell size of 12.5 km2 (selected because this is the minimum resolution of the environmental data used) was created using the Create Fishnet tool within ArcMap (version 10.4.1), from coordinates 74°N, 0°E in the south-west to 84°N, 35°E in the northeast and selected environmental parameters were mapped onto this study area. The International Bathymetric Chart of the Arctic Ocean version 3.0 (Jakobsson et al. 2012) was used for the bathymetry of the study region. Areas where glaciers had retreated since the production of this chart were assigned a depth of 10 m. To ensure that the bathymetric and other oceanographic parameters did not include values from land, land areas within the grid cells were eliminated by combining the Svalbard land polygon and the grid polygon, and deleting the land layer. Monthly composites of the MODIS SST 11 (i daytime, at 9 km resolution, were used for the SST of the region for each month (March-November inclusive) within each year of the study period (NASA GSFC, Ocean Biology Processing Group 2014). Mid-monthly five-day median sea-ice concentration data sets from the ASI algorithm SSMI/S at 12.5 km resolution were used for sea-ice data for each month (March- November inclusive) within each year of the study period (see Kaleschke et al. 2001; Spreen et al. 2008; Kern et al. 2010).
ArcMap software was used to assign environmental parameters to cetacean sighting locations. Mean values for water depth, slope (gradient of the slope in degrees from the horizontal plane), aspect (horizontal direction of slope face in degrees from north) and distance from coast (distance from the nearest point of land in the Svalbard Archipelago) were calculated for each grid cell. The Spatial Analyst Tool was used to create slope and aspect rasters from the bathymetric map. The mean depth, slope and aspect were then calculated for each grid cell using the Zonal Statistics as Table tool. The distance to the shore was calculated by converting each grid cell into a point feature at the centre of each respective cell using the Feature to Point tool. The distance from the Svalbard land polygon was then calculated for each of these points, and the points were rejoined to the grid. Mean values for sea-ice concentration and SST were calculated for each grid cell for every month in which observations occurred. Because of variation in the spatial satellite coverage, areas with missing values for these two parameters were assigned the value of the grid cell to the north of them. Each cetacean sighting was assigned all of the physical parameters of the grid cell in which it fell; these data were then edited so that each observation had the appropriate SST and sea-ice data for the month in which it occurred. A few months had poor satellite coverage of SST in the Svalbard region, so interpolation was not possible; therefore, some of the records (n = 32) did not have SST values assigned to them, and these observations were excluded from the modelling.
KDEs were calculated using the Kernel Density Analysis tool within ArcMap, with a search radius of 50 km and a cell size of 1 km, for each species with over 100 observations to display where each of the species were observed in this study (see Silverman 1986; Powell 2000). The 50 km search radius was used as a general daily displacement distance for cetaceans using foraging grounds (e.g., Hobbs et al. 2005; Zerbini et al. 2006; Dalia Rosa et al. 2008; Heide-Jorgensen et al. 2012; Kennedy et al. 2014; Heide-Jorgensen et al. 2015). The resulting KDEs were displayed using 10 quantiles. Images were resampled during display using bilinear interpolation to facilitate visualization of contours of density. KDEs were also produced in two temporal categories: “early” (2002-08, seven years) and “late” (2009- 2014, six years), with the two periods having approximately equal numbers of observations, (n = 3005 and n = 2967 respectively) for selected seasonally resident species (minke whale, fin whale, blue whale and humpback whale) to explore potential changes in habitat use. These KDEs were subtracted from one another for each species, to visualize change in the density of sightings of individual species between the two periods. It is important to note that the Kernel Density Analysis tool within ArcMap does not distinguish between land and water, so it smoothes the aquatic distributions of cetaceans across land points. This is not ideal in grid cells with a lot of land and little water (such as in narrow straits).
Modelling of cetacean habitat suitability was conducted using Maxent software (version 3.3.3k; see Phillips et al. 2006). This software is appropriate for the MMSDB data because, unlike generalized linear models and generalized additive models, Maxent does not require animal absence to be recorded (Kanaji & Okazaki 2014). The set of observations, with all environmental parameters attached, including the correct SST and sea-ice concentration data for the appropriate month of each individual observation, was converted into a CSV file, and this was added into “Samples” in the Maxent software. Models were displayed relative to a grid of background data from August 2014. This was a CSV file composed of the 12.5 km2 resolution grid, with
each cell containing the mean values for each of the bathymetric parameters over that area, as well as the mean SST and ice concentration from August 2014, selected because August is the month of greatest observation frequency (Supplementary Fig. Sla) and 2014 was the latest year of the study period, and presumed to be the most representative of current conditions.
Models were run using 70% of the observations for model training, and the remaining 30% for model testing. All other model settings were left at standard values, which assumes species to be evenly distributed across the entire environment (see Merow et al. 2013). The modelled habitat suitability CSV files were converted into point features, and then into rasters using the Feature to Raster tool in ArcMap, with an output cell size of 12.5 km. All modelled outputs were resampled during display using bilinear interpolation.
AUC and percentage contribution of each variable were calculated for all species models. AUC was used to measure model performance. With presence-only data the maximum achievable AUC is less than 1 and a random model prediction gives an AUC of 0.5 (Phillips et al. 2006). The percentage contribution is calculated by randomly altering the variable values amongst the training points and measuring the subsequent decrease in training AUC, with large decreases indicating a heavy dependence by the model on that variable (Phillips 2012).
Comparisons of modelled habitats were undertaken using ENM Tools software (version 1.4.4; see Warren et al. 2010). Niche similarity was measured using Schoener’s D and a measure I, derived from Hellinger distance. Both measures range from 0 to 1, with 0 denoting no overlap in the modelled grids of environmental suitability and 1 denoting 100% overlap, i.e., with all grid cells being equally suitable for both species (Warren et al. 2010). Schoener’s D treats the modelled suitability scores as proportional to species abundance, whereas I treats them as probability distributions (Warren et al. 2010). The I statistic was used to classify degrees of overlap, with I > 0.9 denoting a high level of overlap and I > 0.8 denoting a moderate level of overlap.
Results
A few caveats must be considered when interpreting this data set. Vessel activity is greatest around the coastal regions, particularly on the west coast of Spitsbergen. Few vessels venture into areas with heavy ice cover, although EV visits to the ice edge are quite common. The opportunistic nature of the observations means there is no way to account for multiple sightings of the same individual, although tourist ships have a system whereby they avoid being in sight of each other as much as is possible, which minimizes resighting of the same individual on short- time frames. Ship traffic is greatest from June through September so effort is concentrated in these months (Supplementary Fig. Sla). Additionally, the increase in EV activity through the study period (from approximately 50 000 cruise tourists in 2002 to 60 000 in 2014; MOSJ 2017) may have increased effort towards the later years of this study. Finally, the tourist visitation season has grown longer, and tourism has expanded northward, as sea-ice cover has declined (markedly from 2006 onward).
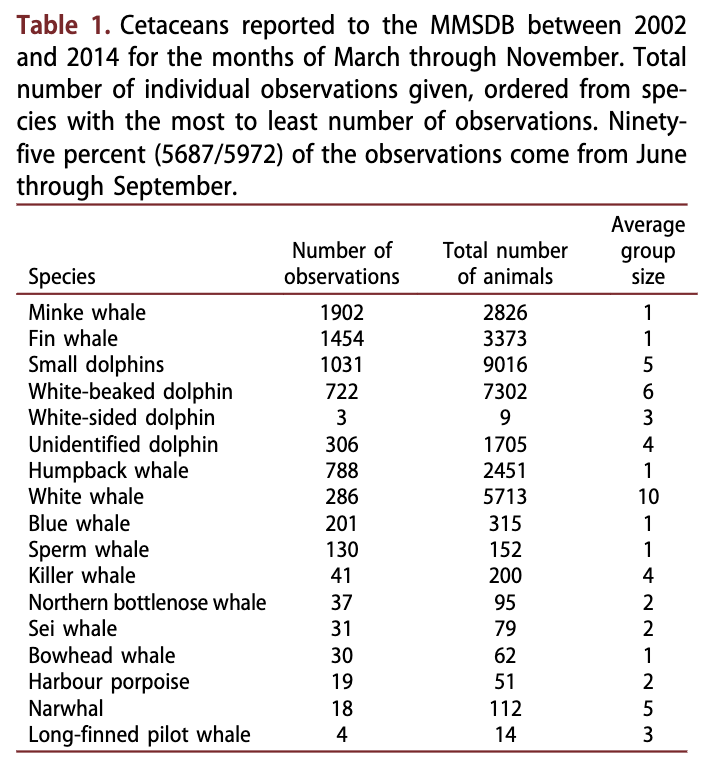
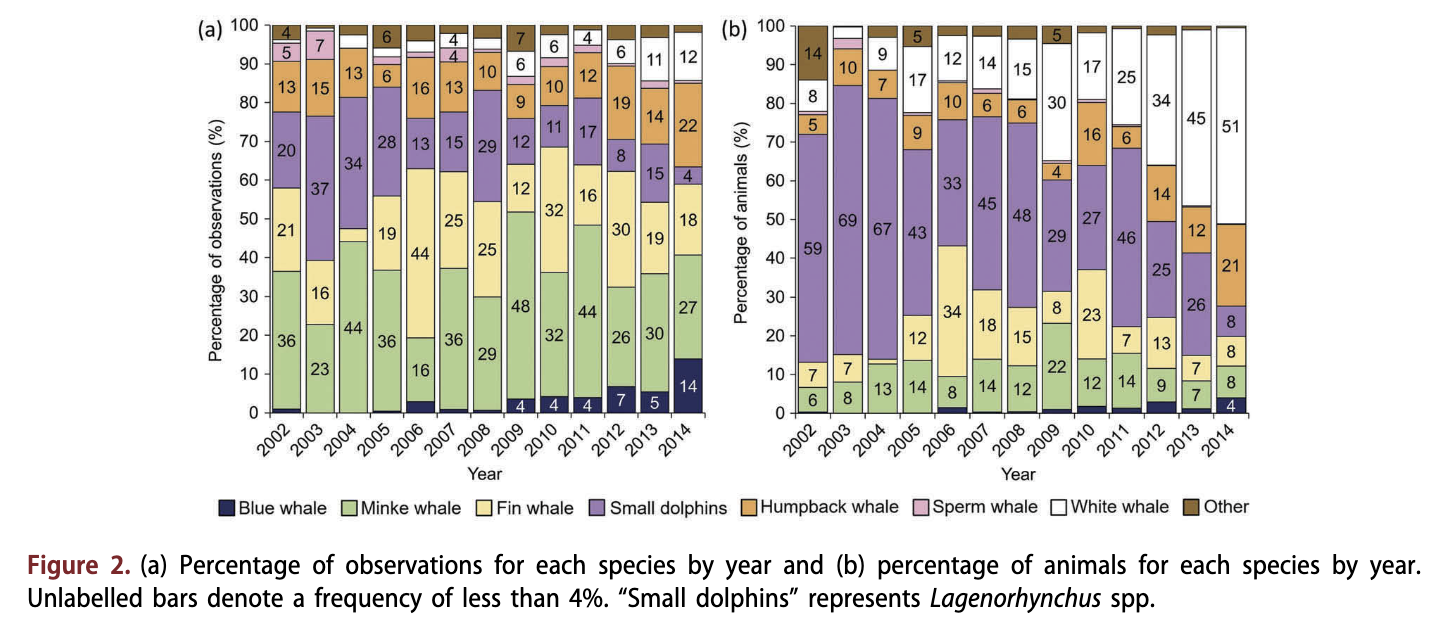
The MMSDB included 6676 cetacean sighting records in the period 2002-2014; 613 (9%) of these were not identified to species (or group in the case of dolphins), and 91 (1%) were recorded in the dark winter months (December-February) and hence are not included in the analyses herein. MMSDB cetacean records included 15 species (Table 1) during the study period. Minke whales were the most frequently observed whale species over the study period (Table 1, Fig 2a); however, the total number of individual minke whales was low compared to some other species because of the solitary behavioural tendencies in this species (Table 1, Fig. 2b). Fin whales, small dolphins and humpback whales were the next most frequently observed taxa (Table 1, Fig. 2a), with small dolphins accounting for the greatest number of animals amongst all of the cetaceans (Table 1, Fig. 2b). White whales were observed frequently, and accounted for the second greatest total number of animals because of their large pod sizes (Table 1, Fig. 2). The two other resident, ice- associated whales, the bowhead whale and the narwhal, were observed during most years of the study, though quite infrequently, with 30 and 18 observations, respectively (Table 1). Blue whales and sperm whales each had over 100 observations in the database. Several of the other seasonally resident species - killer whales, northern bottlenose whales and sei whales (B. borealis) - were observed relatively infrequently, with <41 observations. Two species - harbour porpoises (Phocoena phocoena) and long-finned pilot whales - were rare, with <19 observations (Table 1).
Maxent habitat models produced high training and test AUC values (>0.86) for all species that had numerous sightings (>100) (Supplementary Table SI). High scores were also achieved in models inferring habitat suitability for killer whales, northern bottlenose whales and sei whales. Model outputs are presented for all of these species. Distance to land and ice cover were important parameters for many species, while slope, SST, depth and aspect were critical to only a few (see Supplementary Table SI for details). The remaining species were deemed unsuitable for modelling because of either few observations (long-finned pilot whales and harbour porpoises) or lack of coverage of core habitat (bowhead whales and narwhals).
Arctic resident species
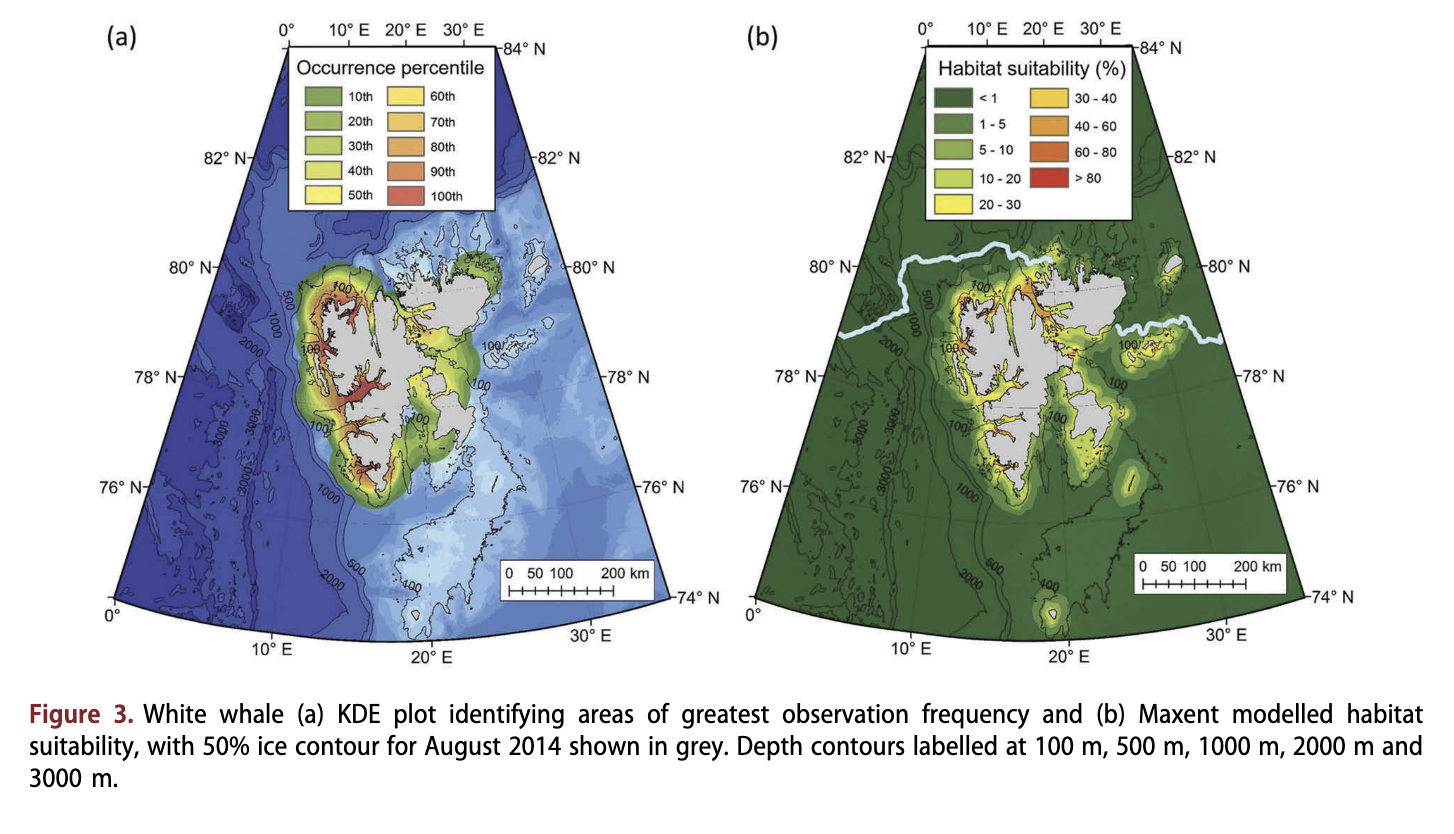
White whales were the most frequently observed resident cetacean, with 286 observations and pod sizes of over 50 individuals seen regularly, although average pod size was 10 (Table 1, Supplementary Fig. S2). This species was found close to the coast (Fig. 3a) (median distance = 1.47 km; Fig. 4d), in shallow water (median = 57 m; Fig. 4c). White whales were observed frequently in areas with considerable amounts of sea-ice coverage, with a quarter of the recorded observations coming from areas with at least 30% ice cover (Fig. 4a). However, half of the observations of this species were made in localities with less than 2% ice cover. White whales were observed in areas with somewhat lower SSTs than the seasonally resident species, with ca. 25% of the records being made in waters where SST was <2°C (Fig. 4b). Although white whales occurred in most fjords in Svalbard, they were most commonly seen along the west coast of Spitsbergen (Fig. 3a, Supplementary Fig. S2). Habitat modelling suggested that white whales occupy the narrowest range of habitats of all the species investigated (Fig. 3b); their habitat was concentrated in fjords and straits, very close to the coast, with habitat suitability dropping to <5% at a distance of 20 km from land (Fig. 3b).

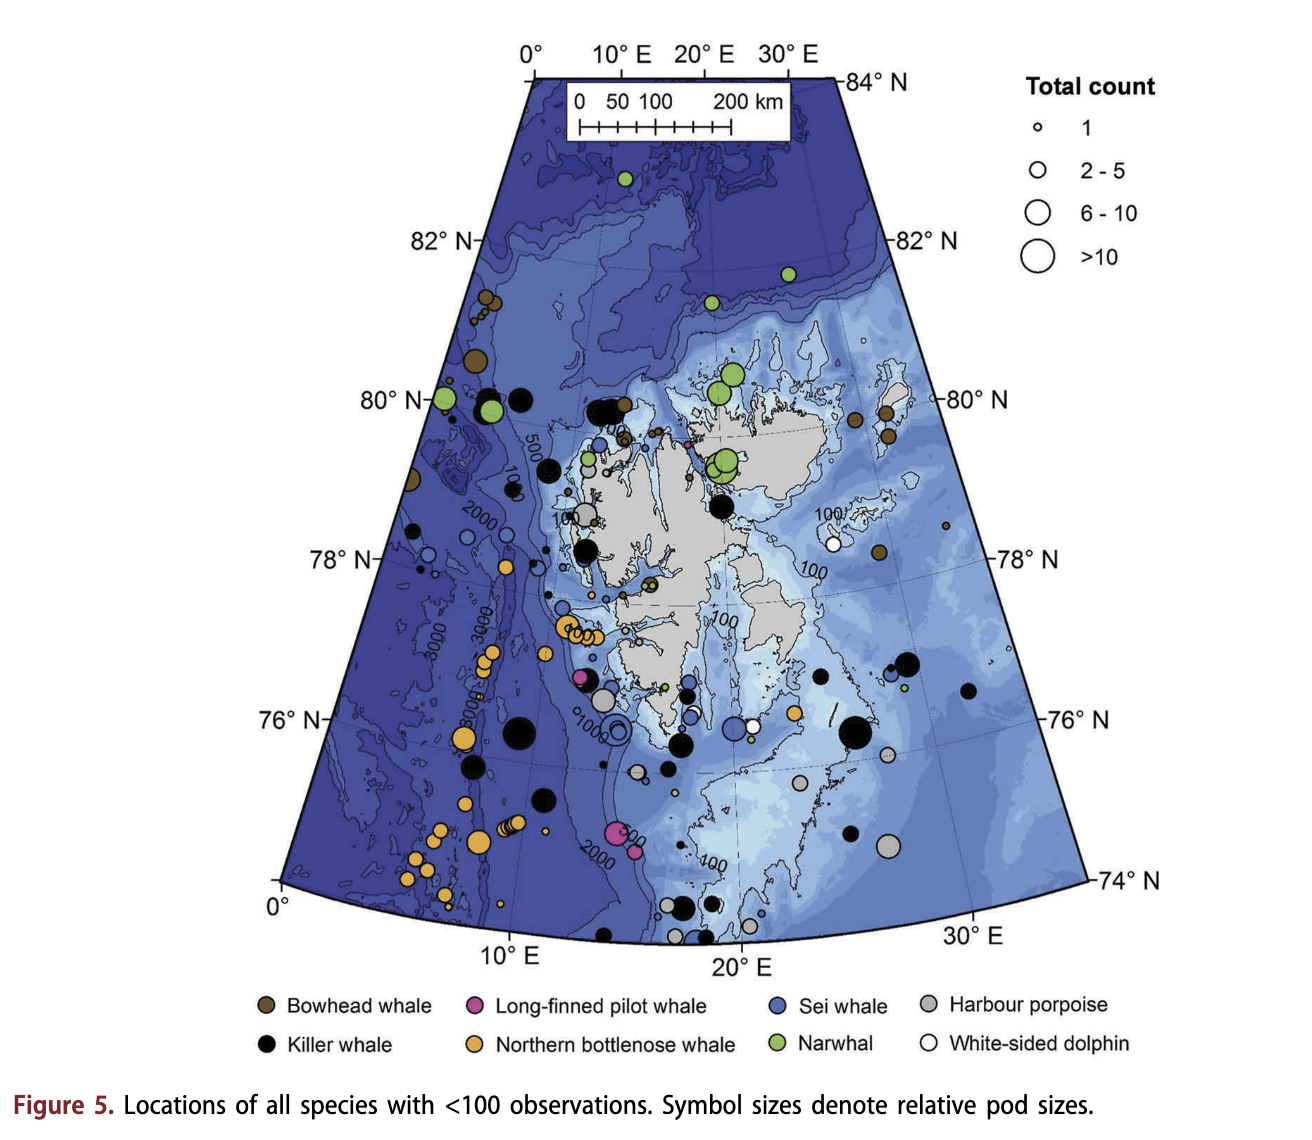
Bowhead whales were reported infrequently (Fig. 5). Pod sizes ranged from one to seven animals in the 30 observations in the MMSDB (Table 1). Most of the observations of this species occurred along the slope of the Yermak Plateau to the north-west of Spitsbergen, in an area known as Whalers Bay, although some sightings did occur in the north-east parts of the archipelago and along the west coast.
Similar to bowhead whales, the other resident Arctic species, the narwhal, was observed infrequently (Table 1, Fig. 5). Typically, observations of narwhals were made at high latitudes, in areas that had relatively dense ice cover, such as in W ahlenbergfj or den on the west side of Nordaustlandet, or associated with pack ice north of 80°N. Narwhals were observed both in shallow coastal environments and in deep waters beyond the continental slope. Narwhals were found at higher latitudes than other species (Fig. 5).
Seasonally resident species
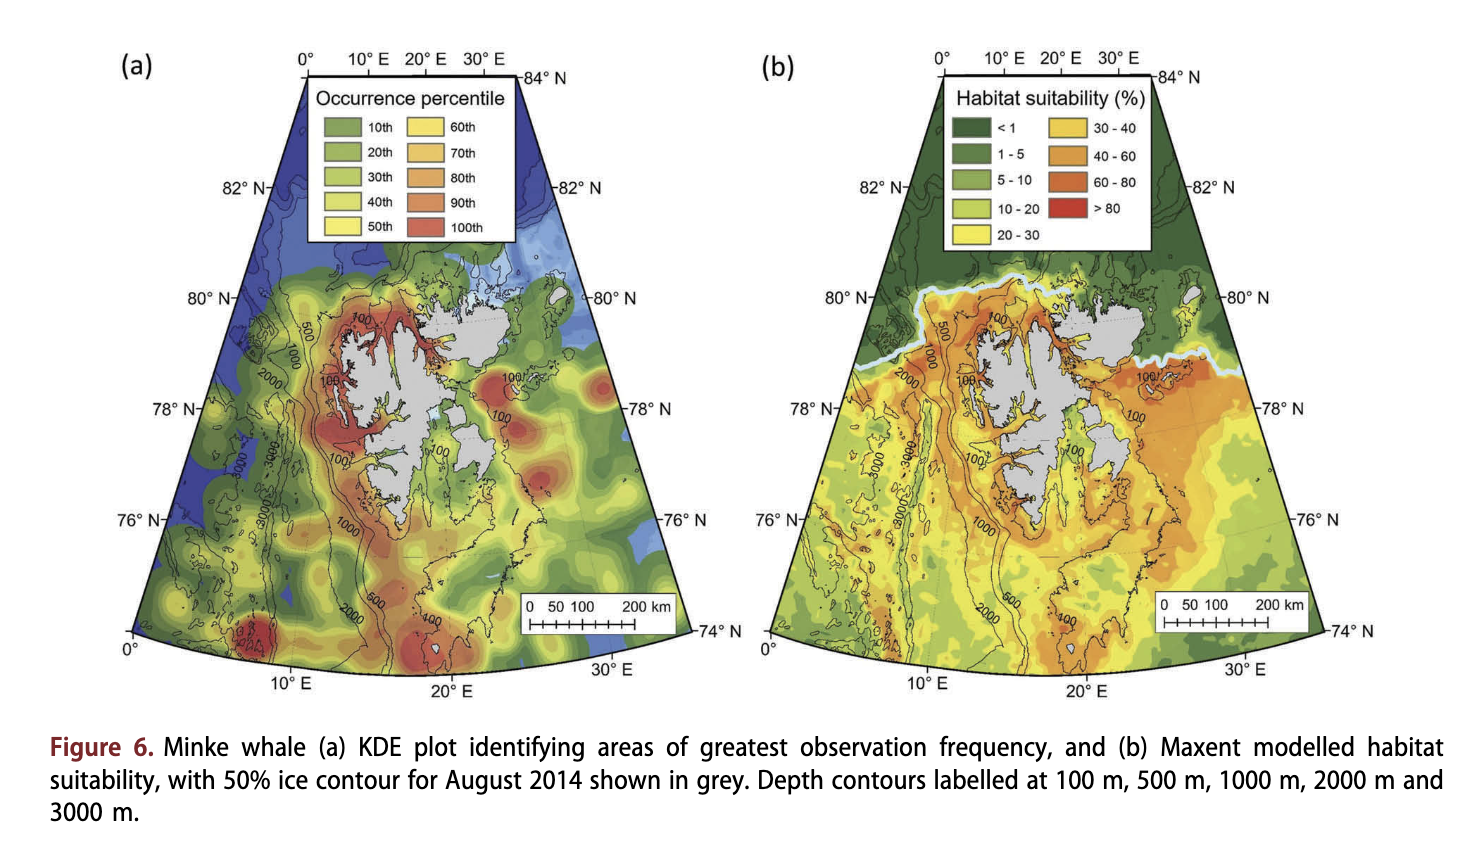
Minke whales were reported throughout much of the study area (Fig. 6a), to as far north as 81.6°N (Supplementary Fig. S3). The greatest densities of sightings occurred around Bjsrnsya, along the continental shelf to the west and north of Spitsbergen, and at the 100 m slope edge east ofEdgeoya. This species occupied areas with depths from <20 m to >4000 m, however they were typically found in areas with intermediate depths (median depth = 188 m; Fig. 4c) over the continental slope and therefore fairly close to land (median distance = 38.2 km; Fig. 4d). Most observations came from open-water areas, although a few sightings came from areas with some drift ice (Fig. 4a). Habitat modelling suggested that minke whales occupy a broad array of open-water and coastal habitats (Fig. 6b), all the way up to the ice edge. The habitat model for this species suggested that areas over deep water beyond the continental slope and areas with high ice cover were unsuitable habitats (<20%; Fig. 6b).
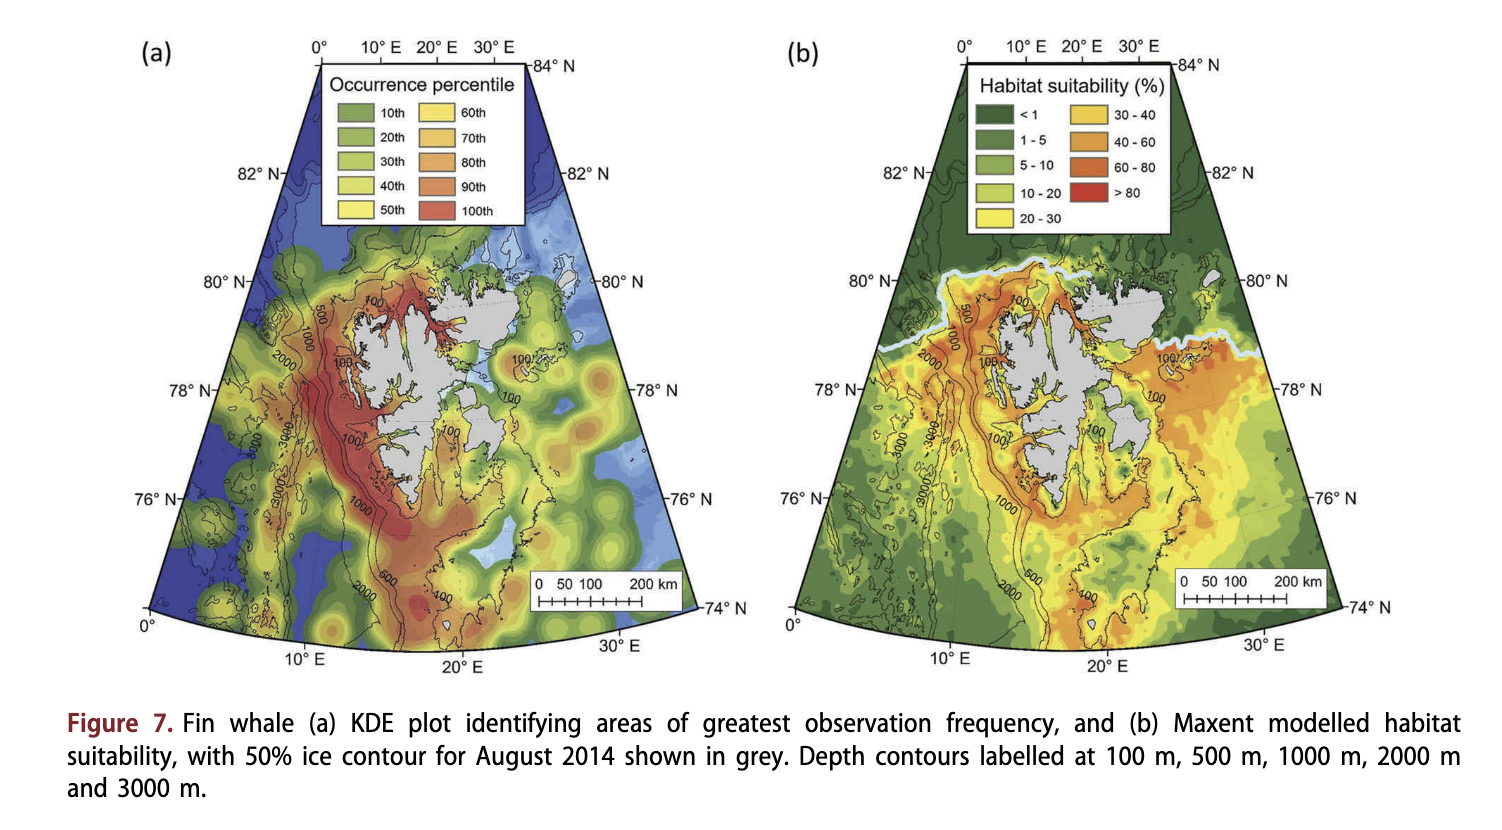
Similar to minke whales, fin whales were observed throughout most of the study area (Fig. 7a), as far north as 81.5°N (Supplementary Fig. S4). Greatest densities of sightings for this species came from around Bjornoya and along the continental slope to the west and north of Spitsbergen (Fig. 7a). Fin whales were observed over a broad array of depths (median depth = 250 m; Fig. 7c); however, they tended to be found in slightly deeper areas than minke whales (Fig. 7a). Fin whales occupied areas with open water; however, a few observations came from areas with loose drift ice (Fig. 4a). Fin whales were less prevalent to the east of Edgeoya compared to minke whales, but were more common in Storfjorden in south-eastern Svalbard. Many fin whale observations were made close to the Knipovich Ridge west of Spitsbergen. Modelling suggested that fin whales occupy a broad array of habitats (Fig. 7b), with the most suitable habitats occurring along the steeper areas of the continental slope around the 500 m depth contour (Fig. 7b). Areas with particularly shallow and flat bathymetry were modelled to be unsuitable habitats (<20%), including Spitsbergenbanken and around Edgeoya. Additionally, deep areas beyond the slope, shallow areas of the Barents Sea and areas with dense ice cover were also found to be unsuitable habitats (<10%).
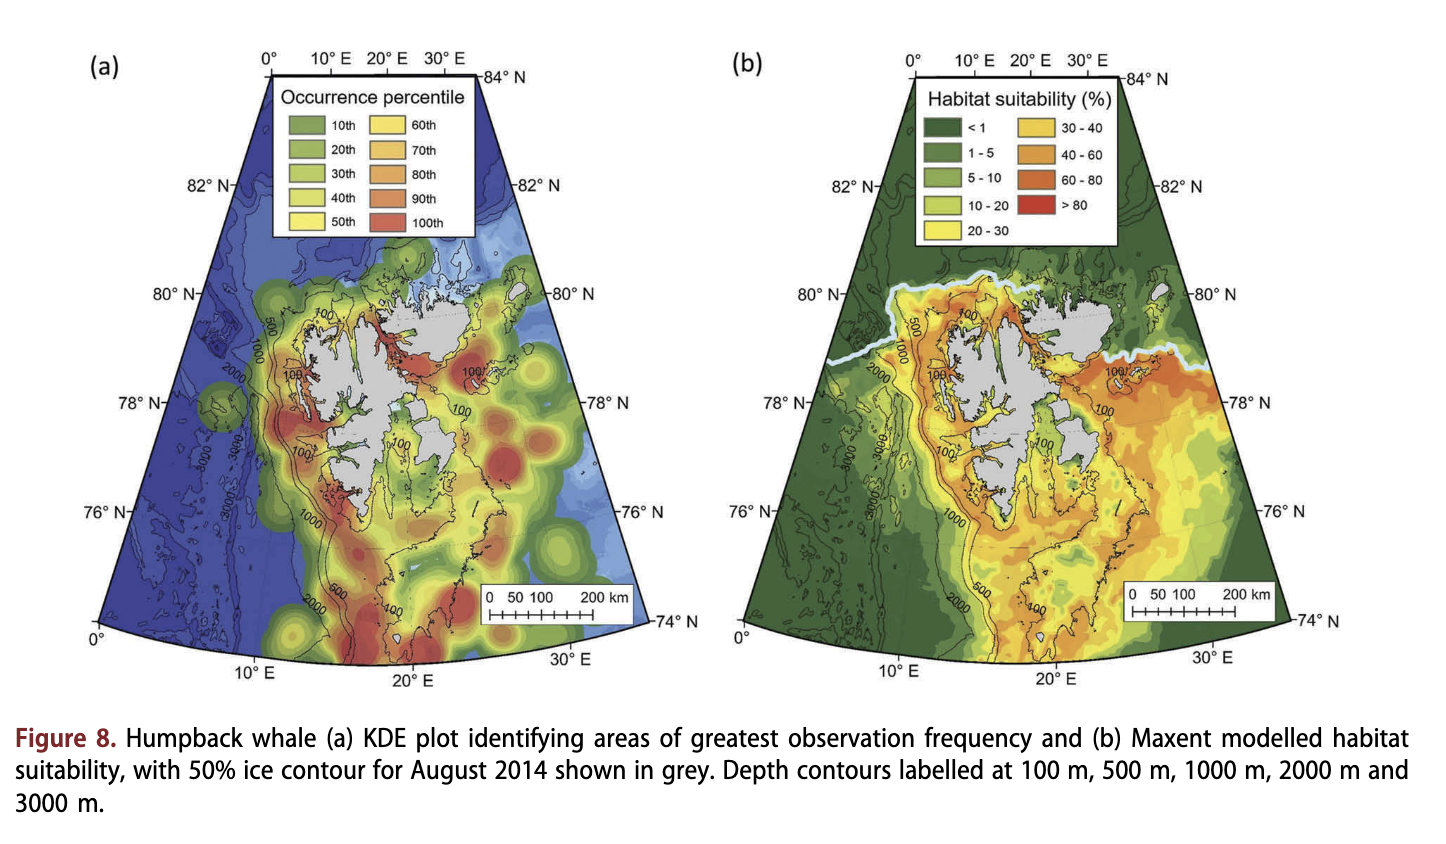
Humpback whales had a patchy distribution, which extended as far north as 81.1°N (Fig. 8a, Supplementary Fig. S5). This species was observed frequently along the continental slope and in shallow areas west of Spitsbergen. However, contrary to the distribution of the other rorquals in this study, humpback whales were also found in large numbers to the south of Nordaustlandet. This species tended to occupy shallower depths, within a narrower range than the other rorquals, with 75% of the records coming from areas with depths of <263 m (Fig. 4c, Supplementary Fig. S5). This species was not observed in areas with sea ice (Fig. 4a). The Maxent model demonstrated that humpback whale habitat occurred along the continental shelf and slope, but not beyond the slope into deep water (Fig. 8b). The major fjord systems around Spitsbergen were fairly suitable habitat (>30%), as were some areas southeast of Spitsbergen (suitability >40%).
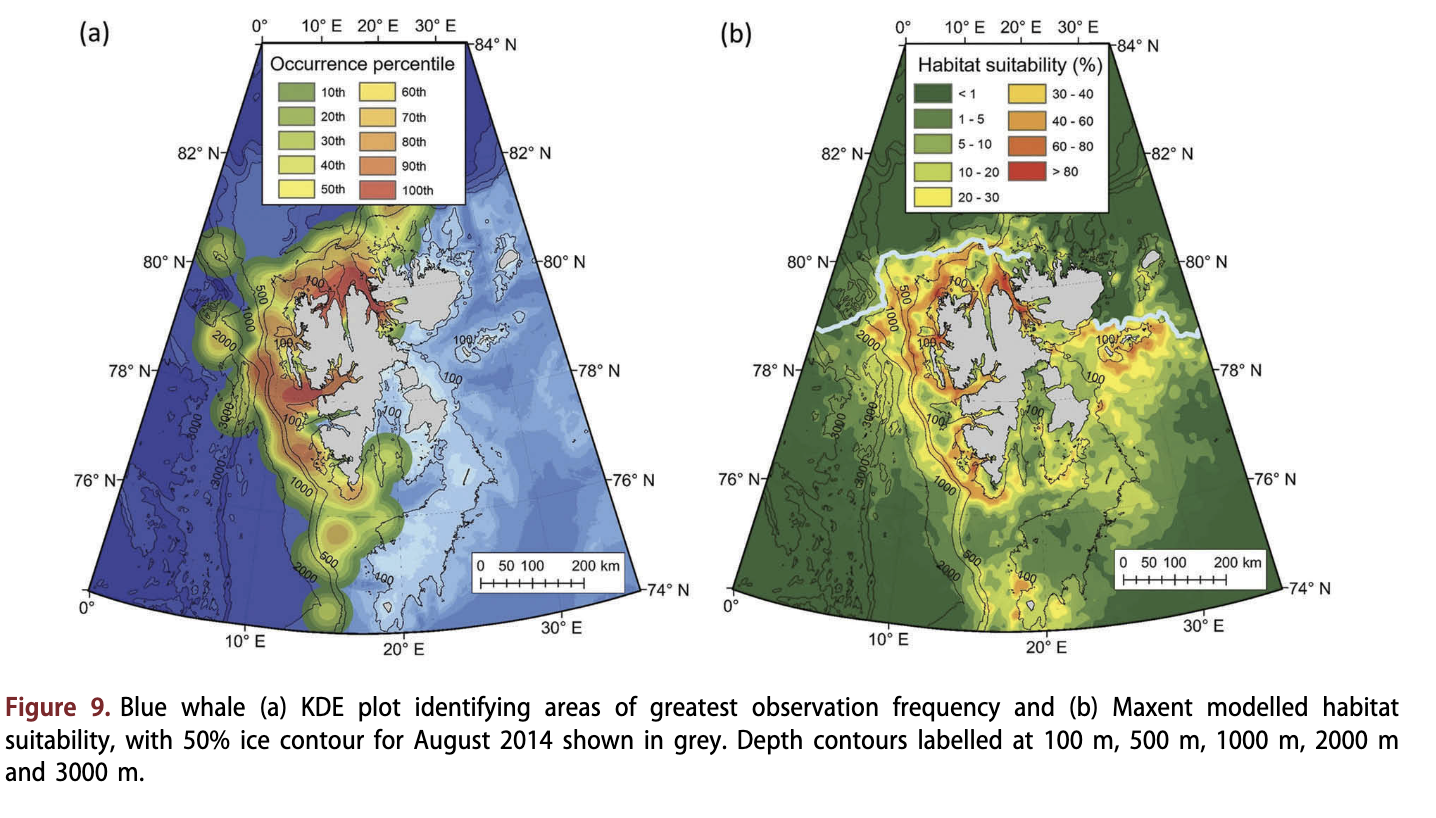
Blue whales were observed west and north of Spitsbergen (Fig. 9a). They were most frequently seen in coastal habitats (median distance = 11.5 km; Fig. 4d) and occasionally along the continental slope (Fig. 9a). The northernmost record was 81.5°N (Supplementary Fig. S6). Blue whales were not observed in the east of the Svalbard Archipelago, nor were they seen frequently beyond the continental slope to the west (Fig. S6). They occurred in waters of moderate depths (median depth = 214 m; Fig. 4c), sometimes in close proximity to loose sea ice; a quarter of the observations were from areas with at least 16% ice cover (Fig. 4a). The most suitable habitats identified from the Maxent model were steep coastal areas (Fig. 9b), reflecting the contribution of the distance to land and slope parameters to the model (Supplementary Table SI). Hinlopenstretet was particularly suitable (>75%), as was Isfjorden (40-70% suitability) (Fig. 9b). The continental slope along the 500 m depth isobath was also a fairly suitable habitat (>40%). However, suitability dropped rapidly to less than 10% at greater depths, and was less than 1% beyond the slope. Habitat tended to be unsuitable for blue whales to the east of Spitsbergen (Fig. 9b).
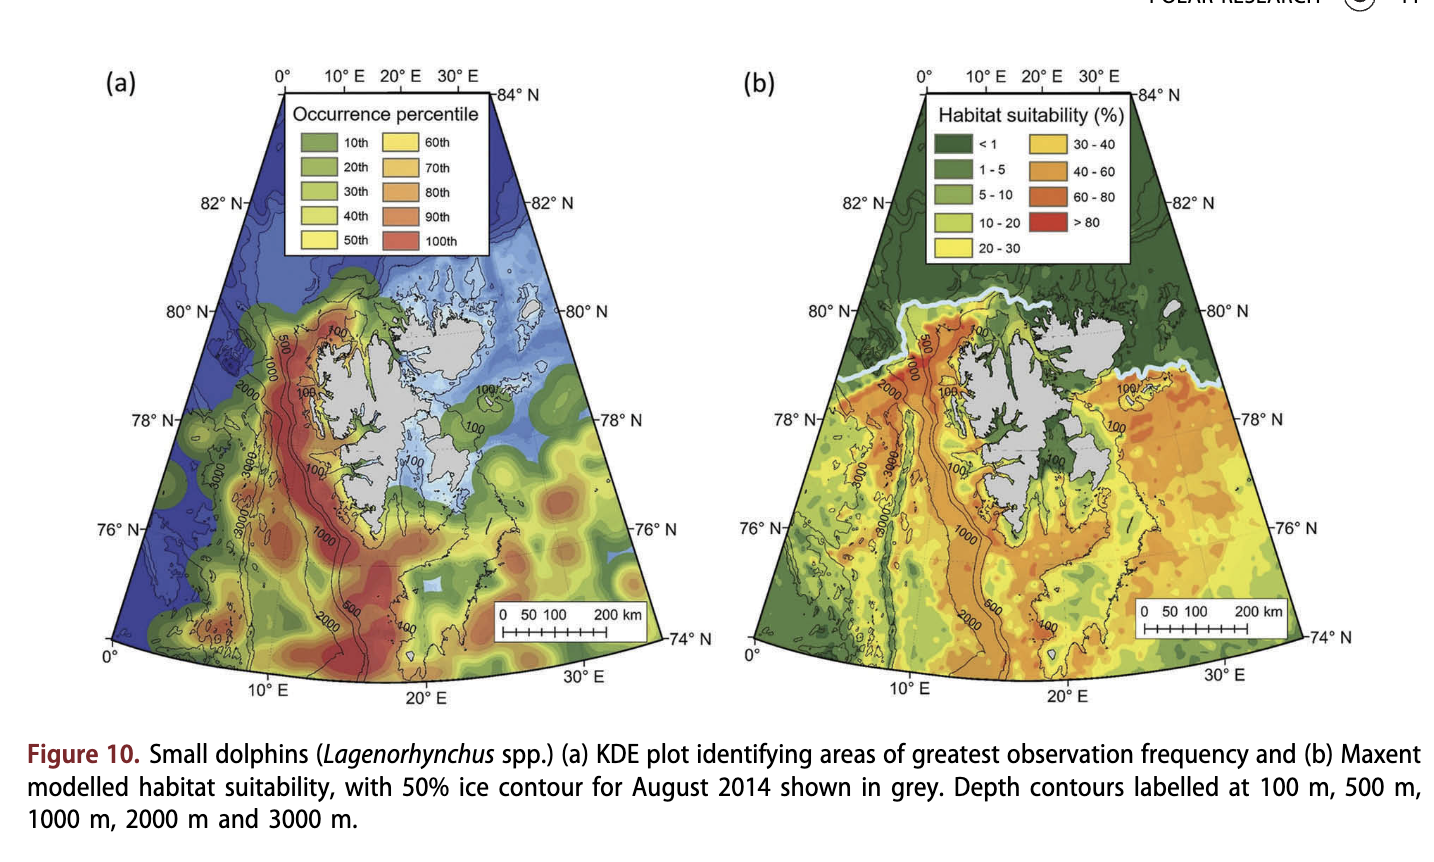
Small dolphins were observed across much of the study area (Fig. 10a), as far north as 80.8°N (Supplementary Fig. S7). They were encountered most frequently along the shelf-break to the south and west of Svalbard, and in deep-water areas (median depth = 355 m; Fig. 4c) affiliated with the Knipovich Ridge (Fig. 10a). Small dolphin observations occurred most commonly in open water, far from land (median distance = 80.2 km; Fig. 4d), with only 37 out of 1031 observations being within 10 km of the coastline. Small dolphins tended to be observed in waters with slightly higher temperatures than most other seasonally resident species (median = 5.7° C; Fig. 4b), and were not seen in areas with sea ice (Fig. 4a). Modelling suggested that the continental slope from a depth of 500-1000 m (Fig. 10b) was the best habitat for small dolphins. Areas with sea ice cover were modelled to be unsuitable (<10%).
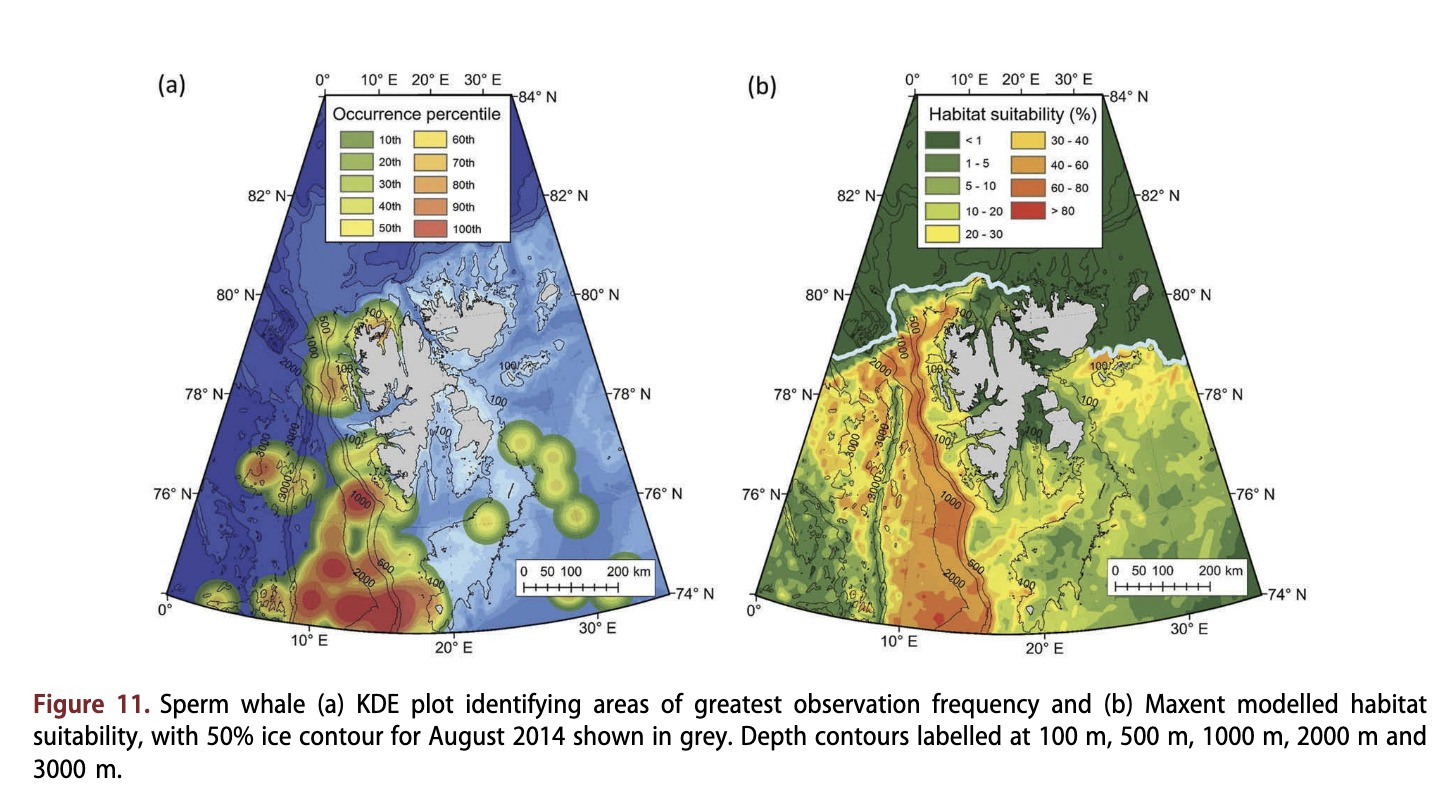
Sperm whales were observed most frequently in the south-west of the archipelago, west of Bjornoya (Fig. Ila), primarily in deep water (median depth = 1594 m; Fig. 4c) along and beyond the continental slope, far from land (median distance = 119.2 km; Fig. 4d). Only 34 out of 130 observations came from north of 76°N; however, several observations were made close to 80°N (Supplementary Fig. S8). Sperm whales were associated with the highest SSTs (median temperature = 7.5°C; Fig. 4(b). Suitable habitats occurred from the continental slope out into Fram Strait (Fig. 11b), primarily along the slope between the 500 m and 2000 m isobaths (suitability 60-85%; Fig. 11b).
Most areas shallower than the 500 m isobath were modelled to be unsuitable (<25%) for sperm whales, apart from some areas around Kong Karls Land and off north-west Spitsbergen. Areas with sea ice were modelled to be unsuitable habitats (<5%; Fig. 1 lb).
Some few seasonally resident species had few observations, so their habitat models should be viewed with caution, but the locations of their occurrences were deemed noteworthy particularly in the context of expected expansion into the Svalbard area with climate change induced alterations of habitat and prey (habitat models for species with 31-41 observations are shown in Supplementary Fig. S9). Killer whales were observed over a broad area and across a broad range of habitats north to 80°N (Fig. 5). Sei whales were the least frequently observed seasonally resident baleen whale. They were seen as far north as the northern tip of Spitsbergen (79.87° N, 14.88° E; Fig. 5). Northern bottlenose whales were primarily seen in deep offshore waters south-east of Spitsbergen, close to the Knipovich Ridge (Fig. 5). Only eight of 37 observations took place in waters of <1800 m depth, all of these just west of the entrance of IsHorden. Harbour porpoises and long-finned pilot whales were both observed only infrequently around Svalbard, in relatively shallow areas mostly in the southern parts of the study area (Fig. 5).
Niche similarity
Niche similarity analyses suggested that no two species were suited to identical niches (see Table 2). Habitat models suggest that white whales occupied a unique niche. However, some species did show overlap. Minke whales, fin whales, humpback whales and small dolphins had high or moderate degrees of habitat overlap (Table 2). The habitat of blue whales overlapped with minke whales, fin whales and humpback whales.
Killer whale habitat models need to be viewed with caution because of low numbers of sightings of this species in the MMSDB. However, the areas suggested to contain suitable habitat for them overlapped the ranges of many other cetaceans including small dolphins, minke whales, fin whales, humpback whales and, to a degree, sperm whales (see Fig. 5 Supplementary S9a and species-specific figures) as well as sei whales. Regions with heavy ice cover, where bowhead whale and narwhal were observed, abutted the extremes of the range in which killer whales were observed.
Temporal changes
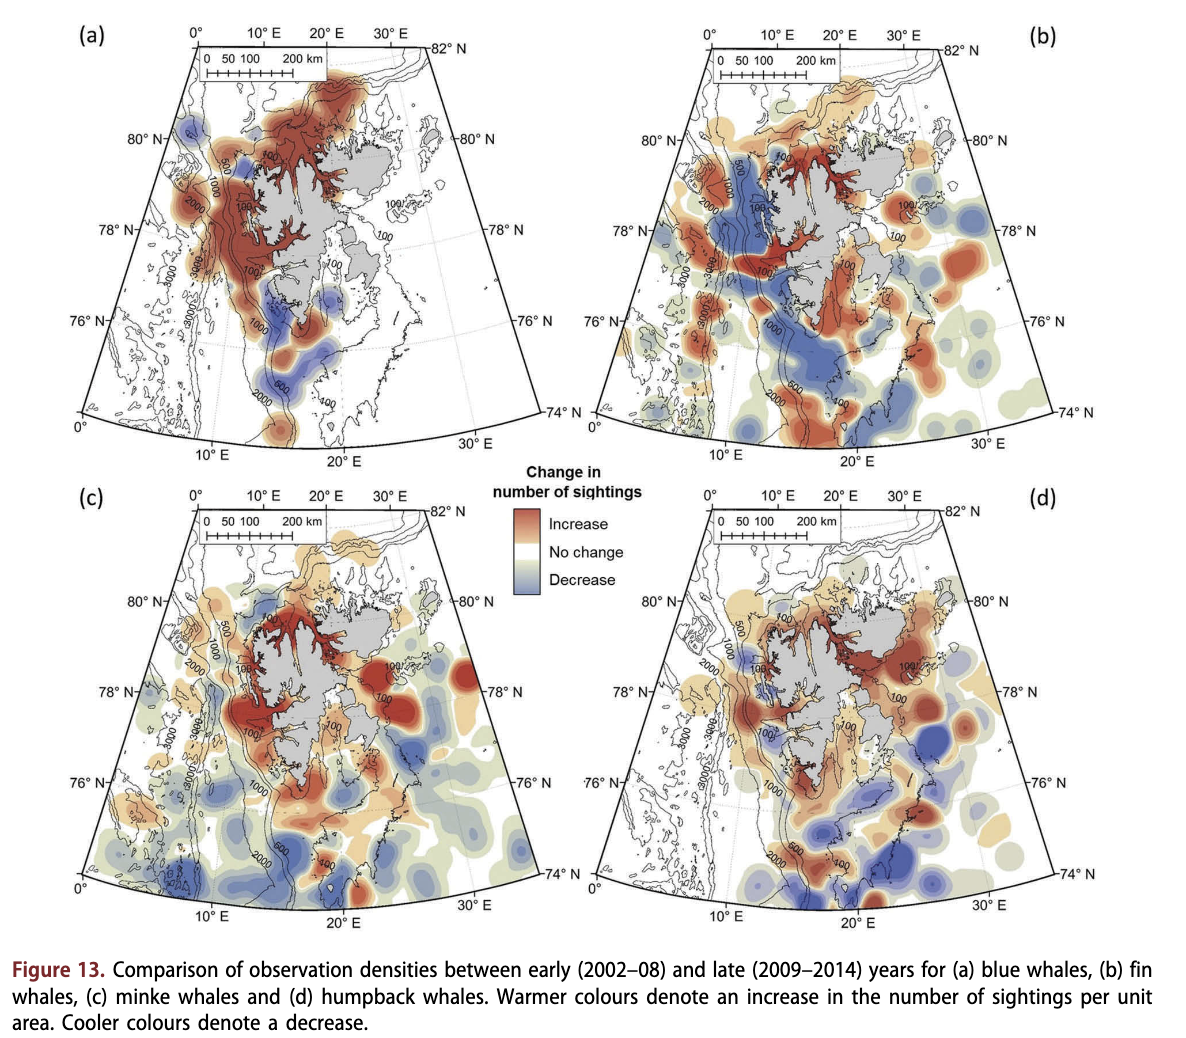
Minke whales, fin whales, blue whales, humpback whales and sperm whales were all observed more frequently at higher latitudes towards the end of the study period, whereas other species such as the small dolphins did not exhibit such a latitudinal change (Fig. 12). Blue whales exhibited the steepest gradient for this trend. Five sightings of blue whales have been made in areas above 81°N since 2012; all three of these observations were groups of three individuals (Supplementary Fig. 86). Blue whales have also contributed to a greater proportion of the observations in recent years (Fig. 2a); 29 observations were made in the early period of this study, whereas 172 observations of this species were made in the late period (see Fig. 2a).

Blue whales, fin whales, minke whales and humpback whales have all been observed more frequently in near-shore areas within the archipelago in late years compared to early years. All four species were also sighted at more northerly latitudes in recent years (Fig. 13). Similarly, white whales exhibited an increase in the number of observations and total animals throughout the study period (Fig. 2). Only 14 recorded observations of this species were made from 2002 to 2005; 91 observations were made between 2006 and 2009; and 181 observations were made between 2010 and 2014. White whales were also unusual in being reported most frequently in June and July (the months with fourth and third highest total reporting, respectively), whereas all other species with >100 observations were observed most frequently in August, when the monthly peak in sightings occurred (Supplementary Fig. 810). The long-term patterns were seen despite no systematic increase in the numbers of sightings reported to the database through the study period. The number of sightings was on average 466 ± 262 annually, but varied from 100 to 900 over the study period with no specific time trend (see Supplementary Fig. Sib).
Discussion
The logistical and financial challenges of monitoring cetaceans over large temporal and spatial scales make databases such as the MMSDB, which use opportunistic sightings, a cost-effective way of gathering data on cetacean habitat use. Previous cetacean studies that utilize citizen science have provided useful insight into the abundance and distribution of cetaceans elsewhere (e.g., Tonachella et al. 2012; Cheney et al. 2013; Beck et al. 2014; Bruce et al. 2014). This project aimed to provide a baseline description of the assemblage and habitat use by cetaceans in the Svalbard region, and provide insight into any evidence of changes that may be occurring. However, it is important to note that the sightings in this study were not part of systematically designed surveys, and we have no accurate measures of sighting effort, though the routes covered by the EVs have remained very similar in most years in the study period. Some considerations must be taken into account when interpreting the results because biases do exist within the data. Most of the Spitsbergen (the largest island in the archipelago) coast is heavily trafficked by EVs, which consistently travel to locations including specific glacier fronts, walrus haul-out sites and bird colonies; they also go to areas where they have heard of recent animal sightings (especially bears and whales). Years of very dense pack ice to the north and east naturally restrict visitation to these areas, whilst overall observer effort has expanded into newly openwater areas to the north where the sea ice has receded. Boats tend to spend little time in Storfjorden; exemplified by the few observations of white whales there, despite this area being known from tracking studies to be an area heavily used by this species (e.g., Lydersen et al. 2001). There is also relatively little effort in the deep waters beyond the shelf break, such as those associated with the Knipovich Ridge; species occupying these areas will be under-represented. Visual shipbased detection of cetaceans also includes inherent bias. Different species vary in their detectability, which can further be affected by sea state (e.g., Barlow 2015), and in their behaviour in relation to boat activity (e.g., Richardson & Wursig 1997).
The NPI's MMSDB records confirm that the waters around the Svalbard Archipelago comprise important summer foraging habitat for a wide variety of seasonally resident cetacean species, as well as being core habitat for white whales. Bowhead whales and narwhals are seen in the area, though infrequently in open-water areas. This study also clearly demonstrates that the IUCN and other organizations presenting overviews of the distribution of cetacean species need to update northerly range boundaries for several cetaceans (Kovacs & Lydersen 2008) within the North Atlantic Arctic including sperm whales (Taylor et al. 2008a), northern bottlenose whales (Taylor et al. 2008b) and sei whales (Reilly et al. 2008a).
Arctic resident cetaceans
White whales have received more research attention than any other cetacean species in Svalbard waters. Distribution has been studied using satellite-tracking studies (Lydersen et al. 2001; Lydersen et al. 2002; Lydersen et al. 2014), Marginal Ice Zone aerial surveying (Vacquie-Garcia et al. 2017) and passive acoustic monitoring (Castellote et al. 2013). Additionally, dietary studies and toxicological studies have been undertaken (e.g., Dahl et al. 2000; Villanger et al. 2011). The KDEs in the current study confirm the tightly coastal distribution of this species in the Svalbard area, consistent with earlier satellite tracking records, as well as the preferential use of Hords that terminate in tidal glaciers. However, the habitat modelling undertaken herein for this species did not identify areas in the northern parts of Storfjorden as good habitats, although this area is known to be heavily utilized (Lydersen et al. 2001), and it also overemphasized the attractiveness of Hirdopenstretet as habitat compared to what both sightings and tracking suggest. These differences likely arise because of the extraordinarily coastal distribution of this white whale population - most locations from satellite tags are within tens of metres from land, which makes the estimation of ice cover and other variables challenging at small spatial scales (environmental grid resolution of 12.5 km). This, in combination with the fact that the actual locations of glacier fronts are changing rapidly and the fact that depth, and SST values are few and crude this close to shore undoubtedly contribute to poor model performance for this species.
White whale observations occurred mostly in June and July, whereas background data for all species were mapped for August 2014, which might also influence the modelling results for this species. This study found that white whales were frequently observed in areas with moderate ice cover, even after the collapse of annually-formed sea ice in western Svalbard in 2006, which is related to their use of tidal glacier fronts, where pieces of glacier ice are often found in significant concentrations. These areas provide refugia for Arctic fish and invertebrate species in Svalbard because of the presence of ice and the cold temperatures of glacial runoff waters. They also have high prey biomass for mammals and birds because circulation patterns induced by the freshwater outflows advect large amounts of production towards the glaciers (Lydersen et al. 2014). The preferred prey of white whales, polar cod (Boreogadus saida) (Dahl et al. 2000), are increasingly restricted to areas in front of glaciers because of warm Atlantic water inflows into Hords on the west and north coasts of Spitsbergen (see Hop & Gjosaeter 2013; Dalpadado et al. 2016; for details). The tightly coastal distribution of Svalbard white whales, without any offshore seasonal migration, is in contrast to white whales elsewhere in their range, which routinely exhibit clear offshore seasonal migration patterns (e.g., Goering & McRoy 1974; Davis et al. 1980; Heide- Jorgensen et al. 2010; Asselin et al. 2012).
The global white whale population was recently listed as Near Threatened on the IUCN Red List (Jefferson et al. 2012), largely on the basis of expected negative impacts of climate change on some populations. Actual trends are known for only a quarter of the recognized populations (five out of 18, three of which are declining [Laidre et al. 2015]). Nothing is known about abundance or trends for the Svalbard population. This species does have an extensive range, south to the St Lawrence Estuary in North America (Lesage & Kingsley 1998), and its flexible dietary habits should serve to reduce the impacts of climate-induced habitat changes (see Laidre et al. 2008). However, their extensive use of the lipid-rich polar cod as prey, and the observed declines in this Arctic fish species in the Barents region (Hop & Gjosaeter 2013), could pose a problem for white whales in Svalbard if they do not readily prey shift. Moreover, even if they do shift to more open-water temperate prey, they are likely to face increased competition from other cetacean species. Increased sighting frequency through this study could be a positive sign of increased abundance, but unstructured observational data alone are insufficient to conclude numerical trends. This species should be assessed, and monitored in the future in Svalbard.
Bowhead whales have been reported to the MMSDB only infrequently, which is not surprising given that the Spitsbergen bowhead whale population is Critically Endangered (Reilly et al. 2012). However, it should be noted that a recent survey in the Marginal Ice Zone north of Svalbard using both ship and helicopter transects found that this species occupied areas with ice cover from 50 to 80%, with sightings only occurring from the air (Vacquie-Garcia et al. 2017). This survey suggests that several hundred bowhead whales occur in the surveyed area, rather than the tens of animals estimated for this population some decades ago. These findings, in combination with surprisingly high occurrences of bowhead whale calls on passive acoustic devices located in Eram Strait gives cause for optimism regarding an increasing trend in this population (Wiig et al. 2007; Wiig et al. 2010; Moore et al. 2012; Stafford et al. 2012). Elsewhere in their range, this species has been shown to be remarkably flexible in their selection of prey and feeding areas and some populations are increasing (Zeh & Punt 2005; Moore et al. 2010; Nielsen et al. 2015). However, Svalbard bowhead whales appear to exhibit a very strong preference for sea-ice habitats where high concentrations of their Arctic calanoid prey occur (Lydersen et al. 2012; Falk-Petersen et al. 2015) and are therefore likely currently experiencing range contraction.
Similar to the situation for bowhead whales, narwhal habitat was impossible to infer in this study because of the small number of sightings in the open-water areas covered by the MMSDB. This species is tightly associated with sea ice, using leads and cracks deep into heavily ice-covered areas (e.g., Laidre et al. 2008; Reeves et al. 2014). There have been very few studies on the distribution, habitat use and general ecology of narwhals in the Svalbard region (Gjertz 1991; Lydersen et al. 2007) compared to the Canadian Arctic and West Greenland (e.g., Finley & Renaud 1980; Heide-Jorgensen et al. 2002; Laidre et al. 2004; Laidre & Heide-Jorgensen 2005; Dietz et al. 2008; Richard et al. 2010; Reeves et al. 2014). Satellite tracking of a few young narwhals in Svalbard revealed that they do sometimes occupy coastal ice-free areas in late summer, diving into deep trenches to the north-east of Nordaustlandet (Lydersen et al. 2007), which provide some of the only deep-water areas in the region. This species is known to dive to depths of 1000 m when hunting their preferred prey, Greenland halibut (Reinhardtius hippoglossoides) in other Arctic areas (Heide- Jorgensen et al. 2015). A ship and helicopter survey conducted in 2015 in the Marginal Ice Zone north of Svalbard estimated close to 1000 narwhal in the surveyed area (Vacquie-Garcia et al. 2017), which represents less than half of the habitat available between Svalbard and the eastern side of Franz Josef Land. This species was found deep into the ice, extending as far as the survey lines were flown (185 km), so their complete distribution was certainly not covered. Their extreme affiliation with heavy sea ice explains why few open-water observations are reported to the MMSDB.
Seasonally resident cetacean habitat use and niche partitioning
Minke whales, fin whales, humpback whales and small dolphins were the most frequently observed taxa in Svalbard waters, and all exhibited broad and overlapping habitat use. However, some key differences were also observed. Minke whales covered the broadest area from coastal regions to beyond the continental shelf. Humpback whales tended to occur in shallower waters over the continental shelf, and fin whales generally occupied steeper and deeper regions. These three baleen whales co-occur throughout much of their global range by various forms of niche partitioning, such as preferred depths for foraging and specific food preferences (e.g., Goldbogen et al. 2011; Friedlaender et al. 2015). The diet of these three cetaceans in the Barents Sea is known to consist primarily of krill, although they also target capelin (Mallotus villosus), herring (Clupea harengus), polar cod and amphipods to varying degrees (Lydersen et al. 1991; Skern-Mauritzen et al. 2011). Recent increases in the temperature and salinity of Icelandic waters, and subsequent shifts in the fish assemblages have resulted in minke whales shifting their diet from high quantities of krill and capelin to larger benthic gadoids, primarily Atlantic cod (Gadhus morhua) and haddock (Melanogrammus aeglefinus) (Vikingsson et al. 2014). Small dolphins showed a particular preference for the continental slope and did not occur often in coastal environments. They are known to target capelin in this region, and shift their distribution to track this fish species (Skern-Mauritzen et al. 2011). However, they also eat a wide range of other small fish, including herring and some gadoids (Fall & Skern-Mauritzen 2014). The increased abundance of boreal fish species in Svalbard (Berge et al. 2015; Fossheim et al. 2015) and plasticity in prey choice by these seasonally resident balaenopterids and dolphins are likely to lead to an increased presence of these cetaceans in Svalbard waters.
Blue whales across the world are most frequently sighted in association with continental slopes. This was the case early (2002-08) in the study period reported herein. Upwelling in these regions stimulates high productivity and supports large densities of krill (Fiedler et al. 1998; Gill 2002; Wall et al. 2009). However, in the latter years (2009-2014) of the current study, blue whales used coastal and Hord environments more often. This shift in location is almost certainly driven by incursions of warm Atlantic Water and associated krill into Svalbard’s Hords in recent years, concomitant with decreased formation of coastal sea ice in winter (see Eriksen & Dalpadado 2011; Buchholz et al. 2012; Dalpadado et al. 2016).
Sperm whales and northern bottlenose whales also occurred in Svalbard in modest numbers. The habitat model for sperm whales suggested suitable areas along 1000 m isobaths and in deeper waters along the continental slope, consistent with their known use of deep water areas associated with their cephalopod prey throughout their range (e.g., Weir et al. 2001). The northern bottlenose whale distribution in Svalbard waters was consistent with studies of this species elsewhere in the North Atlantic, with good habitat identified beyond the 1000 m isobath (Reeves et al. 1997; Weir et al. 2001; Whitehead & Hooker 2012). Both sperm whales and northern bottlenose whales rely heavily on the squid species Gonatus fabricii in Norwegian waters, adults of which have been recorded as deep as 2700 m (Bjorke 2001).
Sei whales were sighted only infrequently in this study. However, they were seen at the northern tip of Spitsbergen, their most northerly recorded sighting (see Reilly et al. 2008a), suggesting a possible range expansion might be taking place. Although sample size for sei whales in the MMSDB deems it appropriate to be cautious, the habitat suitability model for sei whales suggested that this species occupies a habitat similar to minke, fin and humpback whales; sei whales tend to prefer waters along the continental slope, concordant with the known habitat use of this species in the North Atlantic (Prieto et al. 2014). Sei whales consume copepods and krill (Jonsgard & Darling 1977); the increase in krill abundance and diversity in Svalbard waters (Buchholz et al. 2012) could provide a food supply for this species to exploit in the future.
Killer whales were observed throughout the study area right up to the ice edge, although they were only seen infrequently. Killer whales were hunted along the Norwegian coast until 1981 (0ien 1988). This species is known to prey on all of the ice-associated whales in other Arctic locales (Ferguson et al. 2010; Higdon et al. 2012), and white whales in Svalbard have been suggested to exhibit behaviours that could be anti-predatory responses to killer whales, including spending most of their time very close to shore and not vocalizing often (Lydersen et al. 2001; Karlsen et al. 2002). In the north-eastern Canadian Arctic, killer whale sightings have increased exponentially since 1900, associated with the decreasing sea-ice extent opening up new hunting grounds (Higdon & Ferguson 2009). Given their occasional presence throughout Svalbard waters, as well as the crudely modelled suitability of a broad array of habitats in the region, especially dose to the ice edge, there is potential for killer whales to become a significant predator in this ecosystem in the future (e.g., Baylis et al. 2015).
Long-finned pilot whales, harbour porpoises and white-sided dolphins were all reported to the MMSDB during the study period, but must currently be considered vagrants to the area. Long-finned pilot whales have previously been recorded from Bjornoya, and a solitary harbour porpoise was sighted in association with white whales on the north coast of Spitsbergen between 2005 and 2007 (Kovacs et al. 2009). These three species are not currently regular residents of Svalbard, however given the ongoing increases in their preferred prey species in these waters (Gannon et al. 1997; Eriksen & Dalpadado 2011; Sveegaard et al. 2012; Golikov et al. 2013; Berge et al. 2015), future changes in the abundance and northerly distribution of these cetaceans are likely in the coming decades.
Range changes in the North Atlantic
This study provided some indication that latitudinal shifts may be occurring in the ranges of several cetacean species in this region. Such shifts follow a broader pattern of cetacean range changes associated with increasing water temperatures across the North Atlantic (e.g., MacLeod et al. 2005; MacLeod 2009; Lambert et al. 2014). This study provides the first indication for an increased presence of blue whales in Svalbard waters. The northward expansion of this species is consistent with observations from the central north-east Atlantic
between 1987 and 2001 (Pike et al. 2009), and in Icelandic waters from 1996 to 2004 (Vikingsson et al. 2015). Northward shifts were also observed in minke whales, fin whales, humpback whales (all of which were also increasingly sighted in coastal environments in recent years in this study), sei whales and sperm whales. These observed shifts coincide with recent increases in the Atlantic Water temperatures reaching this High-Arctic region, and concomitant newfound abundance of many of the whales’ prey species in the waters around and within the Hords of Svalbard. Boreal fish species including Atlantic cod, haddock, herring and mackerel (Scomber scombrus), none of which was found regularly in Svalbard waters in previous decades, have all been increasing in abundance since the 2000s and are now regularly caught in the Hords of west Spitsbergen (Berge et al. 2015). Krill is increasing in abundance and has recently experienced reproductive success in Svalbard waters (Eriksen & Dalpadado 2011; Buchholz et al. 2012). Several squid species have also expanded their ranges into the Arctic (see Golikov et al. 2013). Cetacean species in the North Atlantic are likely to continue undergoing range changes associated with their prey’s response to increasing water temperature, and the study herein provides an indication that this is already occurring around Svalbard. The extent of these distribution changes will be determined somewhat by the thermal preferences of the species; but likely more importantly by competition with ecologically similar species from slightly different thermal regimes, and presence of their temperature-dependent prey (see MacLeod 2009 and references therein).
The large numbers of seasonally resident species seen in the Svalbard region and the observed expansion into higher latitudes could also reflect population increases within these species, as has been suggested for cetaceans in the Southern Chukchi Sea (Clarke et al. 2013). Historical whaling records indicate the presence of several seasonally resident cetaceans in Svalbard waters during the early 20th century. There are records of blue whales being caught along the west coast of Spitsbergen, including within IsHorden and north of 80°N in the 1930s (Smith no date). Humpback whales and fin whales were also caught in this region, and there is at least one record of a sperm whale having been caught at 80.68°N, 12.33°E in 1938 (Smith no date) The implementation of the International Whaling Commission’s “moratorium” on commercial whaling in 1986 led to cessation of the vast majority of whaling across the globe, allowing for recovery of many populations (e.g., Sears & Calambokidis 2002; Magera et al. 2013; Rocha et al. 2015; Thomas et al. 2016). For example, North Atlantic blue whale and humpback whale populations have been estimated to be increasing at 5% and 3% per year, respectively, in recent decades (Sears & Calambokidis 2002; Reilly et al. 2008b). It is therefore difficult to differentiate between range changes and population recovery.
Conclusion
This study provides the first comprehensive baseline description of the cetacean assemblage occupying Svalbard waters from March through November. The year-round Arctic resident white whales were observed exclusively in coastal habitats, in accordance with their previously documented use of tidal glacier fronts as feeding grounds, and their use of shallow near shore corridors during transits between glaciers. Bowhead whales and narwhals were observed very infrequently, likely on account of their extreme affinity for heavy sea-ice cover in this region, beyond the reach of most reporting vessels. Seasonally resident minke whales, fin whales, humpback whales and small dolphins were all observed often around Svalbard. The continental slope was an important habitat for these species, however they were also observed across the whole study areas in somewhat overlapping habitats, which is likely explained by their flexibility in prey choice and niche partitioning.
Many of the seasonally resident cetaceans showed possible signs of range expansions during the decadal+ study period. This was most pronounced for blue whales, the relative abundance of which increased dramatically in Svalbard waters over the study period. Minke whales, fin whales and humpback whales also used increasingly higher latitudes (and coastal habitats) as the study period progressed. In this study, sperm whales, northern bottlenose whales and sei whales were all seen at latitudes further north than their reported known ranges; definitions of northerly range boundaries for these cetacean species therefore need to be updated by the IUCN and other organizations presenting global or regional overviews. Such range expansions are likely linked to the increasing water temperatures and the concomitant increase in temperate prey species, including krill and various fish, in these high latitude coastal habitats. The continued use of the MMSDB and similar databases can provide a cost-effective means for collecting observational data to track major shifts in distribution and abundance in locations where there are sufficient observational platforms, and help identify areas where research effort should be focussed.
Acknowledgements
We thank the AECO, the Marine Research Institute, the Norwegian Coast Guard and all other contributors to the MMSDB. SST data herein is courtesy of NASA GSFC, Ocean Ecology Laboratory, Ocean Biology Processing Group. ASI algorithm SSMI/S sea-ice concentration data, originally computed at and provided by the Institut Framjais de Recherche pour 1’Exploitation de la Mer, Brest, France, were obtained as five-day median- filtered and gap-filled product for 2002-2014 from the Integrated Climate Data Center (icdc.cen.uni-hamburg. de), University of Hamburg. Siri Uldal created the database software frames. Comments from Dr Janet Clarke and an anonymous reviewer helped us improve the manuscript.
Disclosure statement
No potential conflict of interest was reported by the authors.
Funding
This work was supported by the Norwegian Research Council ICE Whales project (no. 244488/E10), and the Norwegian Polar Institute and the World Wide Fund for Nature (WWF).
References
- Ainley D., Ballard G., Ackley S., Blight L.K., Eastman J. T., Emslie S.D., Lescroel A., Olmastron S., Townsend S.E., Tynan C.T., Wilson P. & Woehler E. 2007. Paradigm lost, or is top-down forcing no longer significant in the Antarctic marine ecosystem? Antarctic Science 19, 283-290.
- Ainley D.G. & Hyrenbach K.D. 2010. Top-down and bottom-up factors affecting seabird population trends in the California current system (1985-2006). Progress in Oceanography 84, 242-254.
- Arlov T. 1994. A short history of Svalbard. Polarhandbok 4. Oslo: Norwegian Polar Institute
- Asselin N.C., Barber D.G., Richard P.R. & Ferguson S. H. 2012. Occurrence, distribution and behaviour of beluga (Delphinapterus leucas) and bowhead (Balaena mysticetus) whales at the Franklin Bay ice edge in June 2008. Arctic 65, 121-132.
- Barlow J. 2015. Inferring traddine detection probabilities, g(0), for cetaceans from apparent densities in different survey conditions. Marine Mammal Science 31, 923-943.
- Baylis A.M.M., Orben R.A., Arnould J.P.Y., Christiansen F., Hays G.C. & Staniland I.J. 2015. Disentangling the cause of a catastrophic population decline in a large marine mammal. Ecology 96, 2834-2847.
- Beck S., Foote A.D., Kotter S., Harries O., Mandleberg L., Stevick P.T., Whooley P. & Durban J.W. 2014. Using opportunistic photo-identifications to detect a population decline of killer whales (Orcinus orca) in British and Irish waters. Journal of the Marine Biological Association of the UK 94, 1327-1333.
- Berge J., Heggland K., Lonne OJ., Cottier F., Hop H., Gabrielsen G.W., Nottestad L. & Misund O.A. 2015. First records of Atlantic mackerel (Scomber scombrus) from the Svalbard Archipelago, Norway, with possible explanations for the extension of its distribution. Arctic 68, 54-61.
- Bjorke H. 2001. Predators of the squid Gonatus fabricii (Lichtenstein) in the Norwegian Sea. Fisheries Research 52, 113-120.
- Bogstad B., Gjosaeter H., Haug T. & Lindstrom U. 2015. A review of the battle for food in the Barents Sea: cod vs. marine mammals. Frontiers in Ecology and Evolution 3, 1-17.
- Bowen W.D. 1997. Role of marine mammals in aquatic ecosystems. Marine Ecology Progress Series 158, 267-274.
- Bruce E., Albright L., Sheehan S. & Blewitt M. 2014. Distribution patterns of migrating humpback whales (Megaptera novaengliae) in Jervis Bay, Australia: a spatial analysis using geographical citizen science data. Applied Geography 54, 83-95.
- Buchholz F., Werner T. & Buchholz C. 2012. First observation of krill spawning in the High Arctic Kongsfjorden, west Spitsbergen. Polar Biology 35, 1273-1279
- Burnett D.G. 2012. Into the belly of the beast. In D.G. Burnett (ed.): The sounding of the whale: science and cetaceans in the twentieth century. Pp. 23-191. Chicago: University of Chicago Press
- Castellote M., Leeney R.H., O’Corry-Crowe G., Lauhakangas R., Kovacs K.M., Lucey W., Krasnova V., Lydersen C., Stafford K.M. & Belikov R. 2013. Monitoring white whales (Delphinapterus leucas) with echolocation loggers. Polar Biology 36, 493-509.
- Cheney B., Thompson P.M., Ingam S.N., Hammond P.S., Stevick P.T., Durban J.W., Culloch R.M., Elwen S.H., Mandleberg L., Janik V.M., Quick NJ., Islas-Villanueva V., Robinson K.P., Costa M., Eisfeld S.M., Walters A., Phillips C., Weir C.R., Evans P.G.H., Anderwald P., Reid RJ., Reid J.B. & Wilson B. 2013. Integrating multiple data sources to assess the distribution and abundance of bottlenose dolphins Tursiops truncates in Scottish waters. Mammal Review 43, 71-88.
- Clarke J., Stafford K., Moore S.E., Rone B., Aerts L. & Crance J. 2013. Subarctic cetaceans in the southern Chukchi Sea: evidence of recovery or response to a changing environment. Oceanography 26, 136-149.
- Coyle K.O., Bluhm B., Konar B., Blanchard A. & Highsmith R.C. 2007. Amphipod prey of gray whales in the northern Bering Sea: comparison of biomass and distribution between the 1980s and 2002-2003. Deep-Sea Research Part II, Topical Studies in Oceanography 54, 2906-2918.
- Dahl T.M., Lydersen C., Kovacs K.M., Falk-Petersen S., Sargent J., Gjertz I. & Gulliksen B. 2000. Fatty acid composition of the blubber in white whales (Delphinapterus leucas). Polar Biology 23, 401-409.
- Dalia Rosa L., Secchi E.R., Maia Y.G., Zerbini A.N. & Heide-Jorgensen M.P. 2008. Movements of satellite- monitored humpback whales on their feeding ground along the Antarctic Peninsula. Polar Biology 31, 771-781.
- Dalpadado P., Hop H., Ronning J., Pavlov V., Sperfeld E., Bucholz F., Rey A. & Wold A. 2016. Distribution and abundance of euphausiids and pelagic amphipods in Kongsfjorden, Isfjorden and Rijpfjorden (Svalbard) and changes in their relative importance as key prey in a warming ecosystem. Polar Biology 39, 765-1784.
- Davis R.A., Finley KJ. & Richardson WJ. 1980. The present status and future management of Arctic marine mammals in Canada. Yellowknife: Department of Information, Government of the Northwest Territories.
- Descamps S., Aars J., Fuglei E., Kovacs K.M., Lydersen C., Pavlova O., Pedersen A.0., Ravolainen V. & Strom H. 2017. Climate change impacts on wildlife in a High Arctic archipelago - Svalbard, Norway. Global Change Biology 23, 490-502.
- Dietz R., Heide-Jorgensen M.P., Richard Orr J., Laidre 2008 K. & Schmidt H.C. Movements of narwhals (Monodon monoceros) from Admiralty Inlet monitored by satellite telemetry. Polar Biology 31, 1295-1306.
- Eriksen E. & Dalpadado P. 2011. Long-term changes in krill biomass and distribution in the Barents Sea: are the changes mainly related to capelin stock size and temperature conditions? Polar Biology 34, 1399-1409.
- Falk-Petersen S., Pavlov V., Berge J., Cottier F., Kovacs K. M. & Lydersen C. 2015. At the rainbow’s end: high productivity fueled by winter upwelling along an Arctic shelf. Polar Biology 38, 5-11.
- Fall J. & Skern-Mauritzen M. 2014. White-beaked dolphin distribution and association with prey in the Barents Sea. Marine Biology Research 10, 957-971.
- Ferguson S.H., Higdon J.W. & Chmelnitsky E.G. 2010. The rise of killer whales as a major Arctic predator. In S.H. Ferguson et al. (eds.): A little less Arctic: top predators in the world’s largest northern inland sea, Hudson Bay. Pp. 117-136. Berlin: Springer.
- Fiedler P.C., Reilly S.B., Hewitt R.P., Demer D., Philbrick V.A., Smith S., Armstrong W., Croll D.A., Tershy B.R. & Mate B.R. 1998. Blue whale habitat and prey in the California Channel Islands. Deep-Sea Research Part II, Topical Studies in Oceanography 45, 1781-1801.
- Finley KJ. & Renaud W.E. 1980. Marine mammals inhabiting the Baffin Bay North Water in winter. Arctic 33, 724-738.
- Fossheim M., Primicerio R., Johannesen E., Ingvaldsen R. B., Aschan M.M. & Dolgov A.V. 2015. Recent warming leads to a rapid borealization of fish communities in the Arctic. Nature Climate Change 5, 673-677.
- Fraser W.R., Trivelpiece W.Z., Ainley D.G. & Trivelpiece S. G. 1992. Increases in Antarctic penguin populations: reduced competition with whales or a loss of sea ice due to environmental warming? Polar Biology 11, 525-531.
- Friedlaender A.S., Goldbogen J.A., Hazen E.L., Calambokidis J. & Southall B.L. 2015. Feeding performance by sympatric blue and fin whales exploiting a common prey resource. Marine Mammal Science 31, 345-354.
- Gannon D.P., Read A.J., Craddock J.E., Fristrup K.M. & Nicolas J.R. 1997. Feeding ecology of long-finned pilot whales Globicephala melas in the western north Atlantic. Marine Ecology Progress Series 148, 1-10.
- Gaston KJ. & Fuller R.A. 2009. The sizes of species’ geographic ranges. Journal of Applied Ecology 46, 1-9.
- Gilg O., Kovacs K.M., Aars J., Fort J., Gauthier G., Gremillet D., Ims R.A., Meltofte H., Moreau J., Post E., Schmidt N.M., Yannic G. & Bollache L. 2012. Climate change and the ecology and evolution of Arctic vertebrates. Annals of the New York Academy of Sciences 1249, 166-190.
- Gill P.C. 2002. A blue whale (Balaenoptera musculus) feeding ground in a southern Australian coastal upwelling zone. Journal of Cetacean Research and Management 4, 179-184.
- Gjertz I. 1991. The narwhal, Monodon monoceros, in the Norwegian High Arctic. Marine Mammal Science 7, 402- 408.
- Gluchowska M., Kwasniewski S., Prominska A., Olszewska A., Goszczko I., Falk-Petersen S., Hop H. & Weslawski J. M. 2016. Zooplankton in Svalbard Hords on the Atlantic-Arctic boundary. Polar Biology 39, 1785-1802.
- Goering JJ. & McRoy C.P. 1974. Sea ice and under ice plankton. In H.T. Odum et al. (eds.): Coastal ecological systems of the USA. Pp. 55-70. Washington, D.C.: The Conservation Foundation.
- Goldbogen J.A., Calambokidis J., McKenna M., Oleson E., Potvin J., Pyenson N.. Schorr G. & Shadwick R. 2011. Mechanics, hydrodynamics and energetics of blue whale lunge feeding: predatory strategies and efficiency dependence on krill density. Integrative and Comparative Biology 214, 131-146.
- Golikov A.V., Sabirov R.M., Lubin P.A. & Jorgensen L.L. 2013 Changes in distribution and range structure of Arctic cephalopods due to climatic changes of the last decades. Biodiversity 14, 28-35.
- Hacquebord L. 1999. The hunting of the Greenland right whale in Svalbard, its interaction with climate and its impact on the marine ecosystem. Polar Research 18, 375-382.
- Harington C.R. 2008. The evolution of Arctic marine mammals. Ecological Applications S18, S20-S40.
- Heide-Jorgensen M.P., Dietz R., Laidre K.L. & Richard P. 2002. Autumn movements, home ranges, and winter density of narwhals (Monodon monoceros) tagged in Tremblay Sound, Baffin Bay. Polar Biology 25, 331-341.
- Heide-Jorgensen M.P., Laidre K.L., Borchers D., Marques T.A., Stern H. & Simon M. 2010. The effect of sea-ice loss on beluga whales (Delphinapterus leucas) in West Greenland. Polar Research 29, 198-208.
- Heide-Jorgensen M.P., Laidre K.L., Litovka D., Jensen M. V., Grebmeier J.M. & Sirenko B.L 2012. Identifying gray whale (Eschrictius robustus) foraging grounds along the Chukotka Peninsula, Russia, using satellite telemetry. Polar Biology 35, 1035-1045.
- Heide-Jorgensen M.P., Nielsen N.H., Hansen R.G., Schmidt H.C., Blackwell S.B. & Jorgensen O.A. 2015. The predictable narwhal: satellite tracking shows behavioural similarities between isolated subpopulations. Journal of Zoology 297, 54-65.
- Higdon J.W. & Ferguson S.H. 2009. Loss of Arctic sea ice causing punctuated change in sightings of killer whales (Orcinus orca) over the past century. Ecological Applications 19, 1365-1375.
- Higdon J.W., Hauser D.D.W. & Ferguson S.H. 2012. Killer whales (Orcinus orca) in the Canadian Arctic: distribution, prey items, group sizes, and seasonality. Marine Mammal Science 28, E93-E109.
- Hobbs R.C., Laidre K.L., Vos D.J., Mahoney B.A. & Eagleton M. 2005. Movements and area use of belugas, Delphinapterus leucas, in a Subarctic Alaskan estuary. Arctic 58, 331-340.
- Hop H. & Gjosaeter H. 2013. Polar cod (Boreogadus saida) and capelin (Mallotus villosus) as key species in marine food webs of the Arctic and the Barents Sea. Marine Biology Research 9, 878-894.
- Jakobsson M., Mayer L., Coakley B., Dowdeswell J.A., Forbes S., Fridman B., Hodnesdal H., Noormets R., Pedersen R., Rebesco M. & Schenke H.W. 2012. The International Bathymetric Chart of the Arctic Ocean (IBCAO) Version 3.0. Geophysical Research Letters 39, LI2609, doi: 10.1029/2012GL052219.
- Jefferson T.A., Karkzmarski L., Laidre K., O’Corry-Crowe G., Reeves R., Rojas-Bracho L., Secchi E., Slooten E., Smith B.D., Wang J.Y. & Zhou К 2012. Delphinapterus leucas. The IUCN Red List of Threatened Species 2012: e. T6335A17690692. Accessed on the internet at 10.2305/ IUCN.UK2012.RLTS.T6335A17690692.en on 4 May 2016.
- Jonsgard A. & Darling K. 1977. On the biology of the eastern North Atlantic sei whale Balaenoptera borealis- international Whaling Commission Report of the Commission Special Issue 1977, 124-129.
- Kaleschke L., Liipkes C., Vihma T., Haarpaintner J., Bochert A., Hartmann J. & Heygster G. 2001. SSM/I sea ice remote sensing for mesoscale ocean-atmosphere interaction analysis: ice and icebergs. Canadian Journal of Remote Sensing 27, 526-537.
- Kanaji Y. & Okazaki M. 2014. Habitat modelling for cetaceans. Aquabiology (Tokyo) 36, 453-460.
- Karlsen J.D., Bisther A., Lydersen C., Haug T. & Kovacs K. M. 2002. Summer vocalisations of adult male white whales (Delphinapterus leucas) in Svalbard, Norway. Polar Biology 25, 808-817.
- Kennedy A.S., Zerbini A.N., Rone B.K. & Clapham P.J. 2014 Individual variation in movements of satellite- tracked humpback whales Megaptera novaeangliae in the eastern Aleutian Islands and Bering Sea. Endangered Species Research 23, 187-195.
- Kern S., Kaleschke L. & Spreen G. 2010. Climatology of the Nordic (Irminger, Greenland, Barents, Kara and White/ Pechora) seas ice cover based on 85 GHz satellite microwave radiometry: 1992-2008. Tellus 62A, 411-434.
- Kovacs K.M., Haug T. & Lydersen C. 2009. Marine mammals of the Barents Sea. In E. Sakshaug et al. (eds.): Ecosystem Barents Sea. pp. 453-497. Trondheim: Tapir Academic Press
- Kovacs K.M. & Lydersen C. (eds.) 2006. Birds and mammals of Svalbard. Polarhandbok 13. Tromso: Norwegian Polar Institute.
- Kovacs K.M. & Lydersen C. 2008. Climate change impacts on seals and whales in the North Atlantic Arctic and adjacent shelf seas. Science Progress 91, 117-150.
- Kovacs K.M., Lydersen C., Overland J.E. & Moore S.E. 2011. Impacts of changing sea-ice conditions on Arctic marine mammals. Marine Biodiversity 41, 181-194.
- Laidre K.L. & Heide-Jorgensen M.P. 2005. Arctic sea ice trends and narwhal vulnerability. Biological Conservation 121, 509-517.
- Laidre K.L., Heide-Jorgensen M.P., Logdson M.L., Hobbs R.C., Heagerty P., Dietz R., Jorgensen O.A. & Treble M. A. 2004. Seasonal narwhal habitat associations in the High Arctic. Marine Biology 145, 821-831.
- Laidre K.L., Stem H., Kovacs K.M., Lowry L., Moore S.E., Regehr E.V., Ferguson S.H., Wiig 0., Boveng P., Angliss R. P. Bom E.W., Litovka D., Quakenbush L., Lydersen C., Vongraven D. & Ugarte F. 2015. Arctic marine mammal population status, sea ice habitat loss, and conservation recommendations for the 21st century. Conservation Biology 29, 724-737.
- Laidre K.L., Stirling I., Lowry L.F., Wiig 0., Heide- Jorgensen M.P. & Ferguson S.H. 2008. Quantifying the sensitivity of Arctic marine mammals to climate-induced habitat change. Ecological Applications 18, S97-S125.
- Lambert E., Pierce GJ., Hall K., Brereton T., Dunn T.E., Wall D., Jepson P.D., Deaville R. & Macleod C.D. 2014. Cetacean range and climate in the eastern North Atlantic: future predictions and implications for conservation. Global Change Biology 20, 1782-1793.
- Lavery T.J., Roudnew B., Seymour J., Mitchell J.G., Smetacek V. & Nicol S. 2014. Whales sustain fisheries: blue whales stimulate primary production in the Southern Ocean. Marine Mammal Science 30, 888-904.
- Lesage V. & Kingsley M.C.S. 1998. Updated status of the St Lawrence River population of the beluga, Delphinapterus leucas. Canadian Field Naturalist 112, 98-113.
- Lydersen C., Assmy P., Falk-Petersen S., Kohler J., Kovacs K.M., Reigstad M., Steen H., Strom H., Sundfjord A., Varpe 0. & Walczowski W. 2014. The importance of tidewater glaciers for marine mammals and seabirds in Svalbard, Norway. Journal of Marine Systems 129, 452-471.
- Lydersen C., Freitas C., Wiig 0., Bachmann L., Heide- Jorgensen M.P., Swift R. & Kovacs K.M. 2012. Lost highway not forgotten: satellite tracking of a bowhead whale (Balaena mysticetus) from the Critically Endangered Spitsbergen stock. Arctic 65, 76-86.
- Lydersen C., Martin A.R., Gjertz I. & Kovacs K.M. 2007. Satellite tracking and diving behaviour of sub-adult nar- whales (Monodon monoceros) in Svalbard, Norway. Polar Biology 30, 437-442.
- Lydersen C., Martin A.R., Kovacs K.M. & Gjertz I. 2001. Summer and autumn movements of white whales Delphinapterus leucas in Svalbard, Norway. Marine Ecology Progress Series 219, 265-274.
- Lydersen C., Nost O.A., Lovell P., McConnell BJ., Gammelsrod T., Hunter C., Fedak M.A. & Kovacs K. M. 2002. Salinity and temperature structure of a freezing Arctic fjord monitored by white whales (Delphinapterus leucas). Geophysical Research Letters 29, article no. 2119, doi: 10.1029/2002GL015462.
- Lydersen C., Weslawski J.M. & 0ritsland N.A. 1991. Stomach content analysis of minke whales (Balaenoptera acutorostrata) from the Lofoten and Vesteralen areas, Norway, August 1988. Holarctic Ecology 14, 219-222.
- MacLeod C.D. 2009. Global climate change, range changes and potential implications for the conservation of marine cetaceans: a review and synthesis. Endangered Species Research 7, 125-136.
- MacLeod CD., Bannon S.M., Pierce GJ., Schweder C., Learmonth J.A., Herman J.S. & Reid RJ. 2005. Climate change and the cetacean community of north-west Scotland. Biological Conservation 124, 477-483.
- Magera A.M., Flemming J.E.M., Kaschner K., Christensen 2013 & Lotze H.K. 2013. Recovery trends in marine mammal populations. PloS One 8, e77908, doi: 10.1371/journal.pone.0077908.
- Merow C., Smith MJ. & Silander J.A. 2013. A practical guide to MaxEnt for modeling species’ distributions: what it does, and why inputs and settings matter. Ecography 36, 1058-1069.
- Moore S.E., George J.C., Sheffield G., Bacon J. & Ashjian CJ. 2010 Bowhead whale distribution and feeding near Barrow, Alaska in late summer 2005-06. Arctic 63,195-205.
- Moore S.E., Stafford K.M., Melling H., Berchok C., Wiig 2012 O. , Kovacs K.M., Lydersen C. & Richter-Menge J. Comparing marine mammal acoustic habitats in Atlantic and Pacific sectors of the High Arctic: yearlong records from Fram Strait and the Chukchi Plateau. Polar Biology 3, 475-480.
- MOSJ 2017. Cruise tourism statistics. Environmental Monitoring of Svalbard and Jan Mayen. Accessed on the internet at http://www.mosj.no/en/influence/traffic/cruise-tourism.html on 15 September 2017.
- NASA GSFC, Ocean Biology Processing Group 2014. Aqua Moderate Resolution Imaging Spectroradiometer (Aqua MODIS) sea surface temperature data. Maintained by NASA Ocean Biology Distributed Active Archive Center (OB.DAAC), GSFC, Greenbelt, MD. Accessed on the internet at https://oceancolor.gsfc.nasa.gov/cgi/13 on 20 July 2016.
- Nielsen N.H., Laidre K., Larsen R.S. & Heide-Jorgensen M. 2015 P. Identification of potential foraging areas for bowhead whales in Baffin Bay and adjacent waters. Arctic 68, 169-179.
- 0ien N. 1988. The distribution of killer whales Orcinus orca in the North Atlantic based on Norwegian catches 1938-1981 and incidental sightings 1967-1987. Rit Fiskideildar 11, 65-78.
- Onarheim I.H., Smedsrud L.H., Ingvaldsen R.B. & Nilsen 2014 Loss of sea ice during winter north of Svalbard. Tellus Series A, Dynamic Meteorology and Oceanography 66, article no. 23933, doi: 10.3402/tellusa.v66.23933.
- Pavlova O., Pavlov V. & Gerland S. 2014. The impact of winds and sea surface temperatures on the Barents Sea ice extent, a statistical approach. Journal of Marine Systems 130, 248-255.
- Phillips S. 2012. A brief tutorial on Maxent. Lessons in Conservation 3. 107-135
- Phillips S.J., Anderson R.P. & Schapire R.B. 2006. Maximum entropy modeling of species geographic distributions. Ecological Modelling 190, 231-259.
- Pike D.G., Vikingsson G.A., Gunnlaugsson T. & 0ien N. 2009. A note on the distribution and abundance of blue whales (Balaenoptera musculus) in the central and northeast North Atlantic. NAMMCO Scientific Publications 7, 19-29.
- Powell R.A. 2000. Animal home ranges and territories and home range estimators. In L. Boitani & T.K. Fuller (eds.) Research techniques in animal ecology: controversies and consequences. Pp. 65-110. New York: Columbia University Press.
- Prieto R., Silva M.A., Waring G.T. & Goncalves J.M.A. 2014. Sei whale movements and behaviour in the North Atlantic inferred from satellite telemetry. Endangered Species Research 26, 103-113.
- Reeves R.R., Ewins PJ., Agbayani S., Heide-Jorgensen M.P., Kovacs K.M., Lydersen C., Suydam R., Elliott W., Polet 2014, Van Dijk Y. & Blijleven R. Distribution of endemic cetaceans in relation to hydrocarbon development and commercial shipping in a warming Arctic. Marine Policy 44, 375-389.
- Reeves R.R., Mitchell E. & Whitehead H. 1997. Status of the northern bottlenose whale, Hyperoodon ampullatus, in the Gully, Nova Scotia. Canadian Field Naturalist 111, 287-292.
- Reilly S.B., Bannister J.L., Best P.B., Brown M., Brownell R. L. Jr., Butterworth D.S., Clapham PJ., Cooke J., Donovan G.P., Urban J. & Zerbini A.N. 2008a. Balaenoptera borealis. The IUCN Red List of Threatened Species 2008: e.T2475A9445100. Accessed on the internet at 10.2305/IUCN.UK.2008.RLTS. T2475A9445100.en on 4 May 2016.
- Reilly S.B., Bannister J.L., Best P.B., Brown M., Brownell R.L. Jr., Butterworth D.S., Clapham PJ., Cooke J., Donovan G.P., Urban J. & Zerbini A.N. 2008b. Megaptera novaeangliae. The IUCN Red List of Threatened Species 2008: e. T13006A3405371. Accessed on the internet at 10.2305/ IUCN.UK.2008.RLTS.T13006A3405371.en on 11 October 2016.
- Reilly S.B., Bannister J.L., Best P.B., Brown M., Brownell R.L. Jr., Butterworth D.S., Clapham PJ., Cooke J., Donovan G.P., Urban J. & Zerbini A.N. 2012. Balaena mysticetus (Svalbard- barents Sea [Spitsbergen] subpopulation). The IUCN Red List of Threatened Species 2012: e.T2472A17879836. Accessed on the internet at 10.2305/IUCN.UK.2012.RLTS. T2472A17879836.en on 6 May 2016.
- Richard P.R., Laake J.L., Hobbs R.C., Heide-Jorgensen M. P., Asselin N.C . & Cleator H. 2010. Baffin Bay narwhal population distribution and numbers: aerial surveys in the Canadian High Arctic, 2002-04. Arctic 63, 85-99.
- Richardson WJ. & Wiirsig B. 1997. Influences of manmade noise and other human actions on cetacean behaviour. Marine and Freshwater Behaviour and Physiology 29, 183-209.
- Rocha R.C. Jr., Clapham PJ. & Ivashchenko Y.V. 2015. Emptying the oceans: a summary of industrial whaling catches in the 20th century. Marine Fisheries Review 76, 37-48.
- Rugh D., Demaster D., Rooney A., Breiwick J., Shelden K. & Moore S. 2003. A review of bowhead whale (Balaena mysticetus) stock identity. Journal of Cetacean Research and Management 5, 267-279.
- Scheffers B.R., De Meester L., Bridge T.C.L., Hoffmann A. A., Pandolfi J.M., Corlett R.T., Butchart S.H.M., Pearce- Kelly P., Kovacs K.M., Dudgeon D., Pacific! M., Rondinini C., Foden W.B., Martin T.G., Mora C., Bickford D. & Watson J.E.M. 2016. The broad footprint of climate change from genes to biomes to people. Science 354, aaf7671, doi: 10.1126/science.aaf7671.
- Sears R. & Calambokidis J. 2002. Update COSEWIC status report on the blue whale Balaenoptera musculus in Canada. COSEWIC assessment and update status report on the blue whale Balaenoptera musculus in Canada. Ottawa: Committee on the Status of Endangered Wildlife in Canada Silvermanc B.W. 1986. Density estimation for statistics and data analysis. Monographs on statistics and applied probability. Vol. 26. London: Chapman and Hall
- Silvertown J. 2009. A new dawn for citizen science. Trends in Ecology & Evolution 24, 467-471.
- Skern-Mauritzen M., Johannesen E., Bjorge A. & 0ien N. 2011. Baleen whale distributions and prey associations in the Barents Sea. Marine Ecology Progress Series 426, 289-301.
- Smetacek V. & Nicol S. 2005. Polar ocean ecosystems in a changing world. Nature 437, 362-368.
- Smith T.D. (ed.) no date. World whaling database: individual whale catches, North Atlantic. In M.G Barnard & J.H. Nicholls (comp.): HMAP data pages. Accessed on the internet at https://hydra.hull.ac.uk/resources/hull:2155on on 15 October 2016.
- Spreen G., Kaleschke L. & Heygster G. 2008. Sea ice remote sensing using AMSR-E 89-GHz channels. Journal of Geophysical Research—Oceans 113, C02S03, doi: 10.1029/2005JC003384.
- Stafford K.M., Moore S.E., Berchok C.L., Wiig 0., Lydersen C., Hansen E., Kalmbach D. & Kovacs K.M. 2012. Spitsbergen’s endangered bowhead whales sing through the polar night. Endangered Species Research 18, 95-103.
- Surma S. & Pitcher TJ. 2015. Predicting the effects of whale population recovery on Northeast Pacific food webs and fisheries: an ecosystem modelling approach. Fisheries Oceanography 24, 291-305.
- Sveegaard S., Nabe-Nielsen J., Staehr KJ., Jensen T.F., Mouritsen K.N. & Teilmann J. 2012. Spatial interactions between marine predators and their prey: herring abundance as a driver for the distributions of mackerel and harbour porpoise. Marine Ecology Progress Series 468, 245-253.
- Taylor B.L., Baird R., Barlow J., Dawson S.M., Ford J., Mead J.G., Notarbartolo Di Sciara G., Wade P.& Pitman R.L. 2008a. Physeter macrocephalus. The IUCN Red List of Threatened Species 2008: e.T41755A10554884. Acccessed on the internet at 10.2305/IUCN.UK.2008.RLTS. T41755A10554884.enon 11 May 2016.
- Taylor B.L., Baird R., Barlow J., Dawson S.M., Ford J., Mead J.G., Notarbartolo G., Wade P. & Pitman R.L.
2008b. Hyperoodon ampullatus. The IUCN Red List of Threatened Species 2008: e.T10707A3208523. Accessed on the internet at 10.2305/IUCN.UK.2008.RLTS. T10707A3208523.enon 11 May 2016. - Thiel M., Penna-Diaz M.A., Luna-Jorquera G., Salas S., Seilanes J.& Stotz W. 2014. Citizen scientists and marine research: volunteer participants, their contributions, and projection for the future. Oceanography and Marine Biology: annual Review 52, 257-314.
- Thomas P.O., Reeves R.R.& Brownell R.L. 2016. Status of the world’s baleen whales. Marine Mammal Science 32, 682-734.
- Tonachella N.. Nastasi A., Kaufman G., Maldini D. & Rankin R.W. 2012. Predicting trends in humpback whale (Megaptera novaeangliae) abundance using citizen science. Pacific Conservation Biology 18, 297-309.
- Tynan C.T. & DeMaster D.P. 1997. Observations and predictions of Arctic climatic change: potential effects on marine mammals. Arctic 50, 308-322.
- Vacquie-Garcia J., Lydersen C., Marques T.A., Aars J., Ahonen H., Skem-Mauritzen M., 0ien N. & Kovacs K. 2017 M. Late summer distribution and abundance of ice-associated whales in the Norwegian High Arctic. Endangered Species Research 32, 59-70.
- Vikingsson G.A., Elvarsson B.P., Olafsdottir D., Sigurjonsson J., Chosson V. & Galan A. 2014. Recent changes in the diet composition of common minke whales (Balaenoptera acutorostrata) in Icelandic waters. A consequence of climate change? Marine Biology Research 10, 138-152.
- Vikingsson G.A., Pike D.G., Valdimarsson H., Schleimer A., Gunnlaugsson T., Silva T., Elvarsson B.P., Mikkelsen B., 0ien N.. Desportes G., Bogason V.& Hammond P.S. 2015. Distribution, abundance, and feeding ecology of baleen whales in Icelandic waters: have recent environmental changes had an effect? Frontiers in Ecology and Evolution 181, 36-46.
- Villanger G.D., Lydersen C., Kovacs K.M., Lie E., Skaare J. 2011 & Jenssen B.M. 2011. Disruptive effects of persistence organohalogen contaminants on thyroid function in white whales (Delphinapterus leucas) from Svalbard. Science of the Total Environment 409, 2511-2524.
- Wall D., O’Kelly I., Whooley P. & Tyndall P. 2009. New records of blue whales (Balaenoptera musculus) with evidence of possible feeding behaviour from the continental shelf slopes to the west of Ireland. Marine Biodiversity Records 2, el28, doi: 10.1017/S1755267209990443.
- Warren D.L., Glor R.E.& Turelli M. 2010. ENMTools: a toolbox for comparative studies of environmental niche models. Ecography 33, 607-611.
- Weir C.R., Pollock C., Cronin C. & Taylor S. 2001. Cetaceans of the Atlantic Frontier, north and west of Scotland. Continental Shelf Research 21, 1047-1071.
- Whitehead H. & Hooker S.K. 2012. Uncertain status of the northern bottlenose whale Hyperoodon ampullatus: population fragmentation, legacy of whaling and current threats. Endangered Species Research 19, 47-61.
- Wiig 0., Bachmann L., Janik V.M., Kovacs K.M. & Lydersen C. 2007. Spitsbergen bowhead whales revisited. Marine Mammal Science 23, 688-693.
- Wiig 0., Bachmann L., 0ien N.. Kovacs K.M. & Lydersen C. 2010. Observations of bowhead whales (Balaena mys- ticetus) in the Svalbard area 1940-2009. Polar Biology 33, 979-984.
- Zeh J.E. & Punt A.E. 2005. Updated 1978-2001 abundance estimates and their correlations for the Bering-Chukchi- Beaufort seas stock of bowhead whales. Journal of Cetacean Research and Management 7, 169-175.
- Zerbini A.N., Andriolo A., Heide-Jorgensen M.P., Pizzorno J.L., Maia Y.G., VanBlaricom G.R., DeMaster D.P., Simoes-Lopes P.C., Moreira S. & Bethlem C. 2006. Satellite-monitored movements of humpback whales Megaptera novaeangliae in the southwest Atlantic Ocean. Marine Ecology Progress Series 313, 295-304.
Related Articles
Olof Bengtsson
Kit M. Kovacs
Christian Lydersen
Karen Lone
Jon Aars
Christian Lydersen
Kit M. Kovacs
et al.
Torben Koenigk
Peter Berg
Ralf Döscher
Christian Lydersen
Kit M. Kovacs
Jade Vaquie-Garcia
Espen Lydersen
et al.
Suzanne de la Barre
Edward Huijbens
Machiel Lamers
Daniela Liggett
et al.