This article is published under a Creative Commons license and not by the author of the article. So if you find any inaccuracies, you can correct them by updating the article.

Regional passive seismic monitoring reveals dynamic glacier activity on Spitsbergen, Svalbard


Andreas Köhler
Christian Weidle
Steven J. Gibbons
Christopher Nuth
Johannes Schweitzer
Published: Dec. 4, 2015
Latest article update: Aug. 14, 2023
This article is published under the license


Abstract
Dynamic glacier activity is increasingly observed through passive seismic monitoring. We analysed near-regional-scale seismicity on the Arctic archipelago of Svalbard to identify seismic icequake signals and to study their spatial–temporal distribution within the 14-year period from 2000 until 2013. This is the first study that uses seismic data recorded on permanent broadband stations to detect and locate icequakes in different regions of Spitsbergen, the main island of the archipelago. A temporary local seismic network and direct observations of glacier calving and surging were used to identify icequake sources. We observed a high number of icequakes with clear spectral peaks between 1 and 8 Hz in different parts of Spitsbergen. Spatial clusters of icequakes could be associated with individual grounded tidewater glaciers and exhibited clear seasonal variability each year with more signals observed during the melt season. Locations at the termini of glaciers, and correlation with visual calving observations in situ at Kronebreen, a glacier in the Kongsfjorden region, show that these icequakes were caused dominantly by calving. Indirect evidence for glacier surging through increased calving seismicity was found in 2003 at Tunabreen, a glacier in central Spitsbergen. Another type of icequake was observed in the area of the Nathorstbreen glacier system. Seismic events occurred upstream of the glacier within a short time period between January and May 2009 during the initial phase of a major glacier surge. This study is the first step towards the generation and implementation of an operational seismic monitoring strategy for glacier dynamics in Svalbard.
Keywords
Svalbard, glacier surge, Iceberg calving, icequake, cryo-seismology
Passive seismic monitoring of glaciers and ice sheets has become increasingly common in recent years. It is a powerful method to consolidate observations of glacier dynamic processes. On account of its unique high temporal resolution, seismic monitoring complements traditional glaciological observations from field or satellites and will help to better understand ice dynamics. In the majority of glacio-seismic studies, temporary seismic networks installed at individual glaciers are used to monitor local glacier-related seismicity (e.g., Neave & Savage 1970; Weaver & Malone 1979; O’Neel et al. 2007; Richardson et al. 2010; West et al. 2010; Carmichael et al. 2012; Mikesell et al. 2012). Furthermore, teleseismic observations of glacier earthquakes on a global scale have been shown to provide useful information on glacier activity (e.g., Ekström et al. 2003; Veitch & Nettles 2012). The possibility of glacier seismic monitoring at regional distances (about 100–2000 km) has also been shown, for example, with the Alaska Regional Seismic Network (O’Neel et al. 2010) and within the ongoing project of the Greenland Ice Sheet Monitoring Network (Dahl-Jensen et al. 2010; Walter et al. 2012). However, the number of studies using regional observations of glacier-generated seismicity is still limited. One reason is the logistical effort required for such initiatives in polar regions. The evident advantage of regional monitoring is that it allows the study and continuous monitoring of numerous glaciers or ice-streams within a larger area and has the potential to provide useful information on regional-scale ice dynamics, for example, in the Arctic and Antarctic. Furthermore, since regional networks are often permanent installations, continuous seismic monitoring and systematic analysis over a time span of several years is possible, once observations are validated with local measurements. This will be useful to assess the potential effects of climate change on glacier dynamics.
Icequakes are generated by glacier processes releasing stress accumulated in the ice. Seismicity generated by basal (e.g., sliding, fluid pressure variation) as well as surface processes (e.g., tensile crack opening) has been observed (Blankenship et al. 1987; Anandakrishnan & Bentley 1993; Deichmann et al. 2000; Stuart et al. 2005; Walter et al. 2009). Seismic signals generated by glacier calving have become of particular interest (e.g., Qamar 1988; O’Neel & Pfeffer 2007; Amundson et al. 2008; Richardson et al. 2010; Bartholomaus et al. 2012; Köhler et al. 2012). The monitoring and understanding of calving processes are crucial to assess impacts of climate change since calving is a major process for mass loss of glaciers. By supplementing temporally limited data of directly (visually) monitored calving, continuous seismic records open the potential to monitor those processes autonomously (O’Neel et al. 2007; Köhler et al. 2012).
In this study, we analyse near-regional (<300 km) observations of glacier seismicity on the Arctic archipelago of Svalbard (74–81°N, 10–35°E). Glaciers cover 33 750 km2,57% of the landmass of the archipelago, with about 68% of the glacier area draining through marine fronts (Nuth et al. 2013). The mass balance has generally been negative since the end of the Little Ice Age (e.g., Hagen et al. 2003; Kohler et al. 2007; Nuth et al. 2010). Most of the glaciers are slow flowing, although a number of fast-flowing ones exist with frontal velocities between 1 and 3 m day−1 (Kääb et al. 2005), and surging glaciers are common. Surging events are characterized by a short period (1–10 years) of fast intense glacier flow of up to 25 m day−1 followed by a quiescent period that lasts up to many decades. Within the last 10 years, several glaciers have surged in southern and north-western Spitsbergen (Dowdeswell & Benham 2003; Sund et al. 2009; Sund & Eiken 2010; Mansell et al. 2012). The majority of Svalbard glaciers lose mass through calving, although only a few studies have examined the dynamics of calving in Svalbard (e.g., Chapuis et al. 2010; Åström et al. 2014; Chapuis & Tetzlaff 2014). Dynamic processes that release seismic energy like calving and surging are crucial for the total ice mass budget of the archipelago since dynamic glacier mass losses are larger and more unpredictable than those from melting alone.
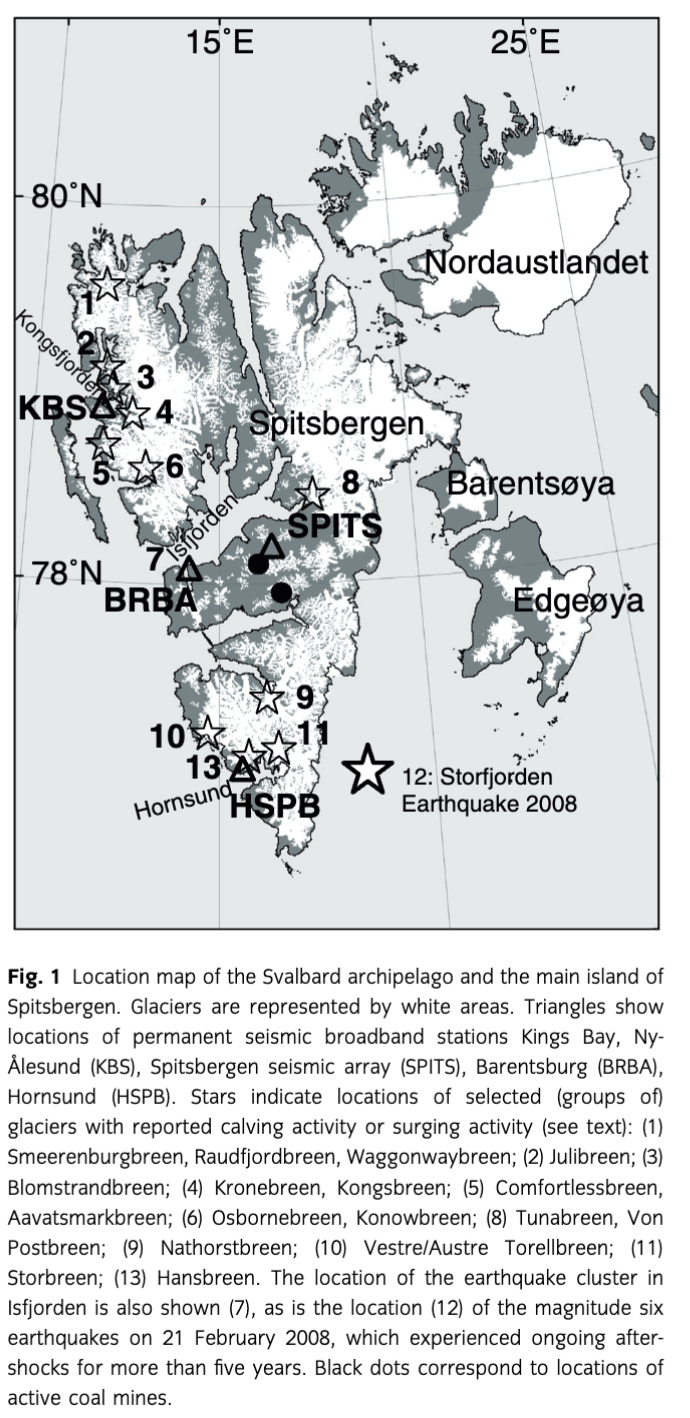
Only a few icequake studies employing data from local, temporary, seismic installations have been carried out on Svalbard glaciers. These studies were all located on Spitsbergen, the main island of the archipelago (Fig. 1), and focused on Bakaninbreen, which surged between 1985 and 1995 (Stuart et al. 2005), Hansbreen (Cichowicz 1983; Górski 2004), Kronebreen (Köhler et al. 2012) and Esmarkbreen (Vinogradov et al. 2015). The aim of this study is to assess for the first time the capability of the current regional seismic network on Spitsbergen for future autonomous glacier monitoring. For this purpose, we analyse selected time periods of seismic data between 2000 and 2013 to identify and locate icequakes as well as to study spatial and temporal patterns in their distribution. We validate the results using a temporary local seismic network, which operated in summer 2013, as well as using direct, in situ, calving (2009, 2010) and surging (2003, 2009) observations.
Seismic data and existing event catalogue
Several permanent broadband stations form a sparse seismic network on Spitsbergen with an average interstation distance of about 100 km (Fig. 1). The small-aperture Spitsbergen seismic array (SPITS) in the centre of Spitsbergen has an aperture of 1 km and presently consists of 9 CMG-3T seismometers. It has been operated by the research foundation NORSAR since 1992 (see, e.g., Gibbons et al. 2011). Furthermore, single three-component broadband stations are located on Spitsbergen (Fig. 1). The Kings Bay seismic station (KBS, STS-2 seismometer) in Ny-Ålesund has been in operation as a broadband station of the Global Seismic Network (GSN) and GeoForschungsNetz (GEOFON) seismic network since 1994. In September 2007, an STS-2 seismic broadband seismometer was installed at the Polish research station in Hornsund (HSPB) by the Polish Academy of Sciences and NORSAR. Since 2010, the Kola Science Centre of the Russian Academy of Sciences has operated a CMG-3ESP broadband seismometer in Barentsburg (BRBA) in cooperation with NORSAR. Seismometers are recording with sampling rates of 40 Hz (KBS, SPITS prior to August 2004), 100 Hz (HSPB) and 80 Hz (SPITS after August 2004, BRBA). Except for some data gaps during upgrading and maintenance of seismometers, all stations have been recording continuously since their dates of installation.
Seismicity in the Svalbard region is monitored routinely through automatic processing of SPITS data by NORSAR (without including the other broadband stations). The procedure detects different seismic phase arrivals (e.g., P and S wave), associates them with events if possible and locates the epicentres of these events in near real-time (Schweitzer et al. 2012). Localizations are obtained through S–P travel time differences, constraining the distance and wave propagation directions (backazimuth) obtained from array processing (frequency-wavenumber [FK] analysis). In the following, the preliminary catalogue obtained by single array automatic event location from the SPITS data is referred to as the SPITS catalogue (available online at www.norsardata.no/NDC/bulletins/dpep). Since the procedure was specifically designed to detect and locate tectonic earthquakes and artificial explosions, the preliminary assigned locations for weak seismic events of a different origin (e.g., icequakes) in the SPITS catalogue must be interpreted with caution. The catalogue includes false alarms and seismic phases that may be associated incorrectly with an event, leading to spurious or biased localizations.
Regional distances in seismology usually refer to distances of up to many hundreds of kilometres. Seismic events on Spitsbergen recorded by permanent stations are therefore observed at the lowest end of the “near-regional” distance range (about 100–300 km), or could even be considered as “local” by definition (<100 km). However, in the following we will use the term “regional” or “regionally observed” in the context of seismicity recorded on the permanent network stations, which may include epicentral distances <100 km.
Between the beginning of May and mid-September 2013, a local temporary seismic network was deployed on rock and soil sites around Kronebreen, a fast-flowing, grounded tidewater glacier in the Kongsfjorden area, at a distance of about 15 km from the permanent station KBS (Fig. 1). The network contained eight broadband seismometers (Trillium 120 PA and CMG-3T) and three three-component geophone arrays with four receivers each (SENSOR PE-6/B, sensitivity >4.5 Hz). The interstation distances of each array were 150–250 m and the apertures 300–500 m. Data were recorded with a sampling rate of 100 Hz. In this study, this temporary network is used to “relocate,” i.e., to reassess and to further improve the accuracy of locations of seismic calving events detected and located with the regional, permanent stations. Within the frequency range of interest in this study (>1 Hz), all regional and local broadband seismometers have a flat response.
Methods
The aim of this seismic data analysis was to identify signals generated by glacial processes, estimate the location of the signal sources and classify all glacier signals into individual source processes within local regions. Pre-processing involved selecting the strongest events with clear seismic phase arrivals from the SPITS catalogue. Each candidate event was then relocated using manually picked seismic phases at SPITS and additional stations. To obtain a more complete event catalogue (down to lower magnitudes), one of two autonomous methods was then used to detect similar signals from the continuous data that are likely from the same source location. The choice of the method depended on the variability of signals from event to event for a specific glacier source.
Location based on manual phase picking
We reviewed the SPITS catalogue by picking seismic phase arrivals manually and relocating selected events between 2000 and 2013 using the single stations KBS, BRBA and HSPB in addition to the SPITS array data. We selected all the SPITS catalogue events with preliminary (automatically determined) magnitudes larger than 0.5 in north-western Spitsbergen between 2009 and 2013. For the southern part of Spitsbergen, we chose automatic locations just for the year 2009 with events of magnitudes >1.0. Finally, all events located to the east of SPITS were selected between 2003 and 2005. The choice of time periods reflected the presence of potentially interesting spatio-temporal patterns in the SPITS catalogue. (Note that all available seismic data were processed with autonomous detection methods later on.) Subsequently, we inspected the waveforms of each event at all available stations. If the event was clearly visible with distinct phase arrivals on at least one of the single stations as well as on the SPITS array, we picked the times for first P and, if possible, S wave arrivals. The first arrivals were Pg/Sg on the single stations and Pg/Sg or Moho-refracted Pn/Sn phases at SPITS, depending on the epicentral distance. Furthermore, backazimuth measurements of phase arrivals were obtained using broadband FK analysis (Kvaerna & Ringdal 1986) of the SPITS array data and using three-component analysis (Roberts et al. 1989) on the single station data from KBS and HSPB. We localized events by inverting both travel times and backazimuths for epicentres and origin times using HYPOSAT software (Schweitzer 2001a). An average crustal velocity model taken from the BARENTS3D regional model was used for forward computation of seismic phases (NORSAR 2006; Levshin et al. 2007; Ritzmann et al. 2007). Ice thicknesses in Spitsbergen are typically less than 600–800 m (Martín-Español et al. 2015) and therefore do not affect wave propagation at regional distances. For the majority of events, no clear phase arrivals could be picked at BRBA because of the high noise level, so this station was only used to locate close events within the Isfjorden region (Fig. 1).
Hypocentre depths were not well-constrained because of the lack of station coverage and are not interpreted in detail. However, inverted glacier event localizations tended to be near to or at the surface, as expected. This is supported by clearly observable seismic Rg phases in the SPITS catalogue, which are characteristic phases for near-surface events (Kafka 1990). The final locations presented here were therefore obtained by fixing the event depth at the surface during localization.
Network sensitivity and location uncertainty
In general, the detection capability of the permanent network was best in the vicinity of the stations and became poorer as the distance from the stations increases. Our results reflect these limitations and should therefore not be interpreted as a complete picture of present glacier seismicity on Spitsbergen. Furthermore, careful assessment of the localization uncertainty was essential in this study because of sparse station coverage. To this end, we performed a sensitivity test by modelling travel times and backazimuths with HYPOSAT using synthetic source localizations. The misfit of modelled data was computed with respect to trial source locations on a 0.05×0.025° grid representing Spitsbergen (Fig. 2). Modelled travel times and backazimuths were perturbed to assess the effect on best source locations and to give an estimate for the localization uncertainty. The error surface in Fig. 2 provides an impression of the actual spatial resolution for different source regions.
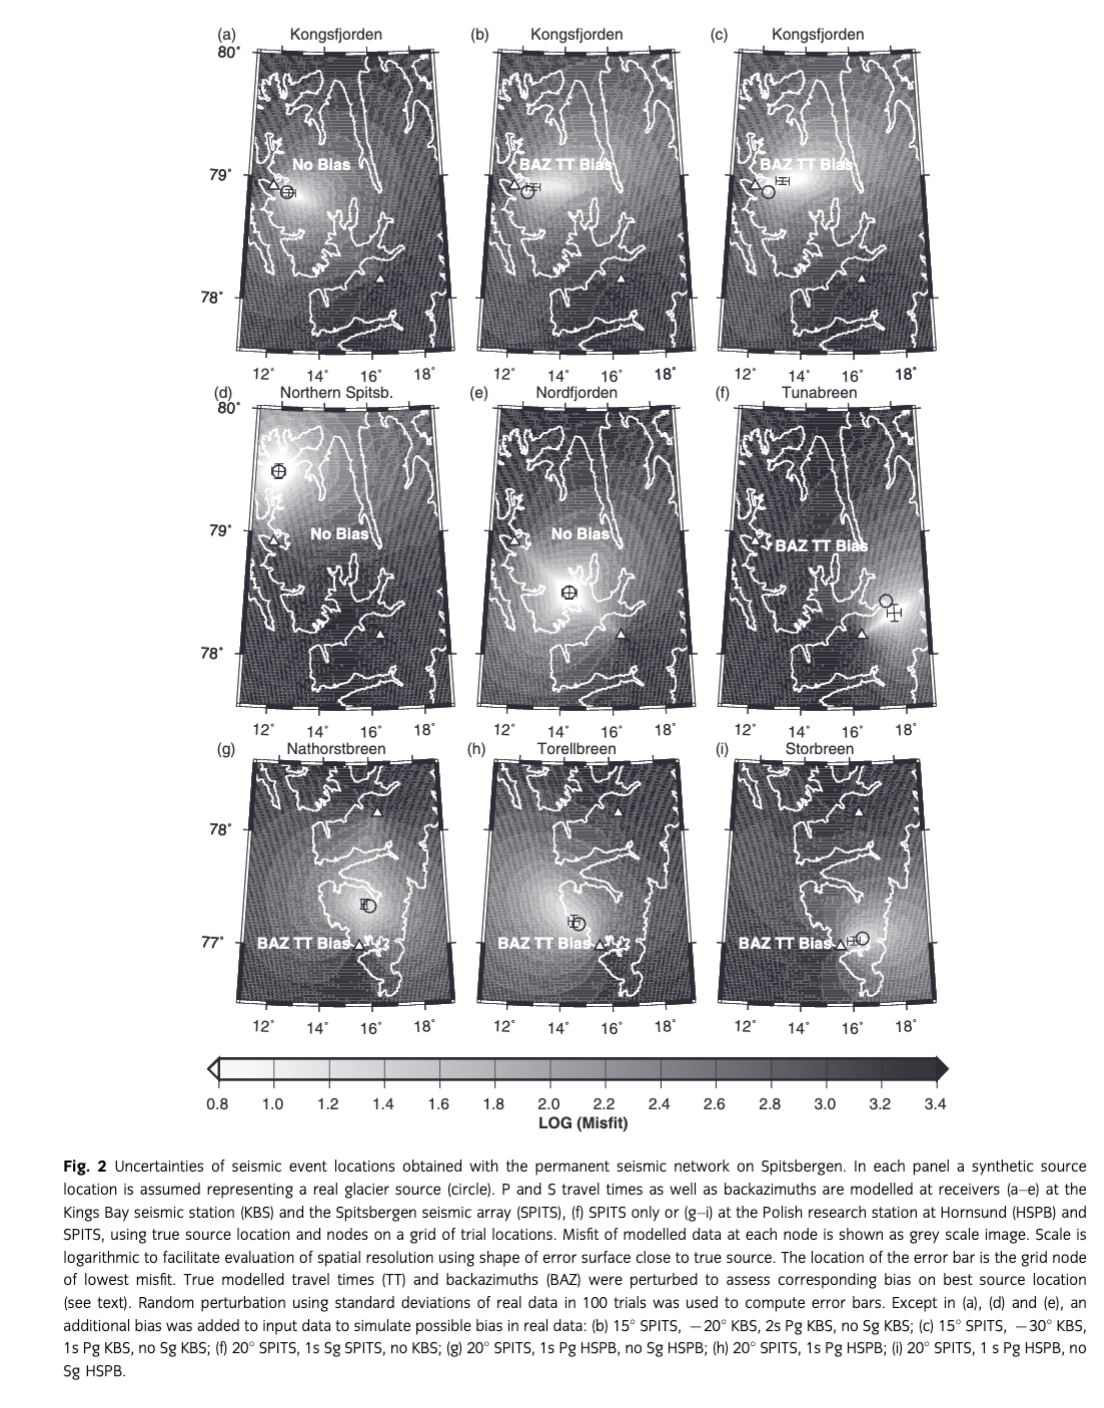
Formal uncertainty estimates are usually computed by the localization algorithm (here HYPOSAT) and are presented as error ellipses assuming normally distributed measurement errors for travel time and backazimuth (i.e., precision of location). Since typically only two stations observed the same event in our study, we found that these error ellipses may underestimate the actual location uncertainty. We therefore re-estimated the uncertainty for each region by random (normally distributed) perturbation of seismic phase arrival times and backazimuth measurements in 100 trials. The standard deviation of perturbations was taken from the real measurements. For backazimuth, it was computed by repeating FK and polarization analysis on different time windows around the P arrival and in two different frequency bands. The average typical deviation is ca. 5° at SPITS and ca. 7° at the single stations KBS and HSPB. In case of arrival times, we perturbed with a wide standard deviation to take into account noisy data and emergent onsets of icequakes. We used 2 s for P and 3 s for S waves. Standard deviations of all best locations are shown in Fig. 2 as error bars along latitude and longitude. This is a conservative estimate of location precision in each source region and gives average uncertainties of ±6 km (longitude) and ±5 km (latitude). Similar values were obtained from the scatter of the travel time curve, which was obtained by plotting travel times over epicentral distances to SPITS for all real located events.
Precision, however, is not the same as the real location accuracy (Havskov et al. 2012). Errors related to the modelling of travel times, for example, using a poor velocity model, had to be assessed on account of a possibly heterogeneous crust affecting local and regional seismic phases. Furthermore, phase misidentification or consistently too early/late picks can introduce a systematic bias with respect to the true location. Often, ambiguous or multiple phase arrivals were observed at stations KBS and HSPB for proximal source locations, which turned out to be a typical feature of calving events. Very weak, emergent P onsets were followed by more energetic arrivals (see Fig. 3a, b, e, f), which sometimes could not be identified clearly as multiple P, S or surface waves. We rejected events for which a reasonable location could not be assured by epicentre inversion. However, we could not neglect a potential bias introduced by these issues and therefore assessed their sensitivity on source locations. We picked two possible P arrivals at KBS for selected events with ambiguous phases and locate them independently (e.g., Fig. 3a, e). Additionally, we located selected events, keeping only the first clear P arrival at KBS and ignoring a possible S arrival. In both cases, the obtained epicentres moved about 10 km with respect to the location obtained with the dominant, first arrival or with the S wave pick included. We confirmed this result through synthetic modelling as shown in Fig. 2b–c for the Kongsfjorden region. A systematic bias between −1 and 2 s was added for the P wave arrival at KBS, and the S wave at KBS was ignored. Furthermore, there may have been a systematic bias on azimuths measured from the SPITS array (15–20°) due to dipping sedimentary layers in the uppermost crust that affect the wavefield under the array, as shown by Schweitzer (2001b). We added a backazimuth bias of 15° at SPITS and of −20° at KBS. Similar tests were done for the other source regions. Obtained source location biases after travel time and backazimuth perturbation were between 2 and 10 km with respect to the true location (Fig. 2b, c, f–i). Finally, we also tested the effect of using a different crustal velocity model. We varied the BARENTS3D model parameters (e.g., slower upper crust, shallower or deeper Moho), and an independent model inverted from surface waves and receivers function at KBS was used (Junek et al. 2014). The location bias obtained by these tests was less than that for biased travel times and backazimuths.
Autonomous short-/long-term-average event detection
Because of the large number of icequakes and the lack of clear seismic phase arrivals for many signals, we could not process and locate all events manually as was described in the previous section. We therefore implemented a short-term average/long-term-average (STA/LTA) trigger algorithm on single station data combined with FK analysis of the SPITS data (Kvaerna & Ringdal 1986; Schweitzer et al. 2012). First, the vertical waveform data of KBS and HSPB were transformed into time series of spectral amplitudes in frequency bands between 2 and 8 Hz. Spectra were computed for 10 s long time windows (typical event length) with a 50% overlap. The STA/LTA trigger was then applied on the continuous data to detect signals within the characteristic frequency band of icequakes. Algorithm parameters (STA length, LTA length, STA/LTA threshold) were chosen so that the number of false alarms is minimized and almost all events were detected in a 12-day calibration time period in 2009 and 2011 during which we inspected all data visually and identified events manually. Furthermore, the set of hand-picked events selected from the SPITS catalogue also had to be detected.
Since the event source location could not be constrained using a single station record, results of the STA/LTA trigger may have included non-glacial event detections. We therefore used FK analysis at SPITS to estimate source direction and distance (Schweitzer et al. 2012). For each detection at KBS or HSPB, FK analysis between 2 and 8 Hz was performed on a time window of the SPITS data defined by the expected P and S arrivals from the given source region of interest. A sliding-window FK analysis was done, i.e., the time window was divided into time segments of 2 s. The backazimuth of the time segment with maximum relative beam power was automatically selected for the vertical component. The horizontal components were rotated using this direction to find the secondary arrivals (S or surface waves) on the radial and tangential components. Backazimuth, apparent velocity, beam power and the detection times of P and secondary arrivals were determined for each detection. Backazimuth and the distance-proportional time delay between the first arrival (detection time) at KBS, SPITS or HSPB and the secondary arrival at SPITS were used to constrain the source region. A particular event source region on Spitsbergen, such as Kongsfjorden (Fig. 1), was later defined based on the spatial distribution of hand-picked event locations. Each region corresponded to a particular azimuthal range as seen from SPITS. Similar, based on the “rule of thumb” approximation relating S–P travel time difference TS–P and distance as D=8×TSg-Pg or D=10×TSn-Pn (Havskov et al. 2012), a distance range could be defined for a particular source region. The relative beam power (lower limit is set to 0.3) and velocities were used to reject false detections and to test if P or slower secondary arrivals had been identified correctly.
Autonomous event detection by master event cross-correlation
Master event cross-correlation is capable of identifying many low-magnitude events possibly missed using the current autonomous network procedure at SPITS (e.g., Gibbons & Ringdal 2006). If the seismic waveforms generated by events in the same source region are sufficiently similar, this method may be a more robust and efficient procedure for detecting related seismic signals than STA/LTA triggering. However, this is only valid in a situation when the source region is confined, the source mechanism is consistent and the source-time-function is similar from event to event. Here, we found this assumption to be reasonable for two source regions. Waveform cross-correlation using all three wavefield components was applied for single station data. All events with correlation coefficients larger than 0.54 were selected. Additionally, we used an array-based waveform correlation method on SPITS data (Gibbons & Ringdal 2006). Master events of different icequake clusters measured on different seismic receivers were selected from the set of hand-picked, located events. First, we chose events with largest amplitudes from different months or years representing the time period we analyse. Then, more master events were iteratively added from the set of located, but still undetected, events until almost all of the located events were detected. Master events were cross-correlated with continuous data with a step width of one sample after bandpass filtering between 2 and 8 Hz. Repeated detections from different master events were rejected. All detections obtained from the correlation procedure were validated using FK analysis of the SPITS data to constrain the source region.
Results
Spatio-temporal distribution of seismicity
We first present the locations of hand-picked events, analyse patterns in their spatial distribution and describe seismic signal characteristics. Next, we interpret temporal patterns in the distribution of icequakes using the more complete catalogue of autonomously detected events obtained either using the STA/LTA or the cross-correlation detection method. The choice of method depended on the source region and the character of seismic signals emitted.
Spatial distribution
In the following, we discuss the distribution of all located events with RMS errors on travel times smaller than 0.5 s, and for which at least three phase arrivals and two azimuth measurements (FK and single station) were used for localization (Fig. 4). An exception was a cluster of events at Tunabreen since those signals are observed at the SPITS array only. The mean location error of all events was estimated to be ±6 km (see error bars in Fig. 4 and discussion of location accuracy above). We manually grouped about 500 events into 12 individual clusters or source regions (Fig. 4). Considering the location uncertainty estimate, we found the identification of those clusters to be plausible and reliable, although spatial patterns within each group should be interpreted with caution.
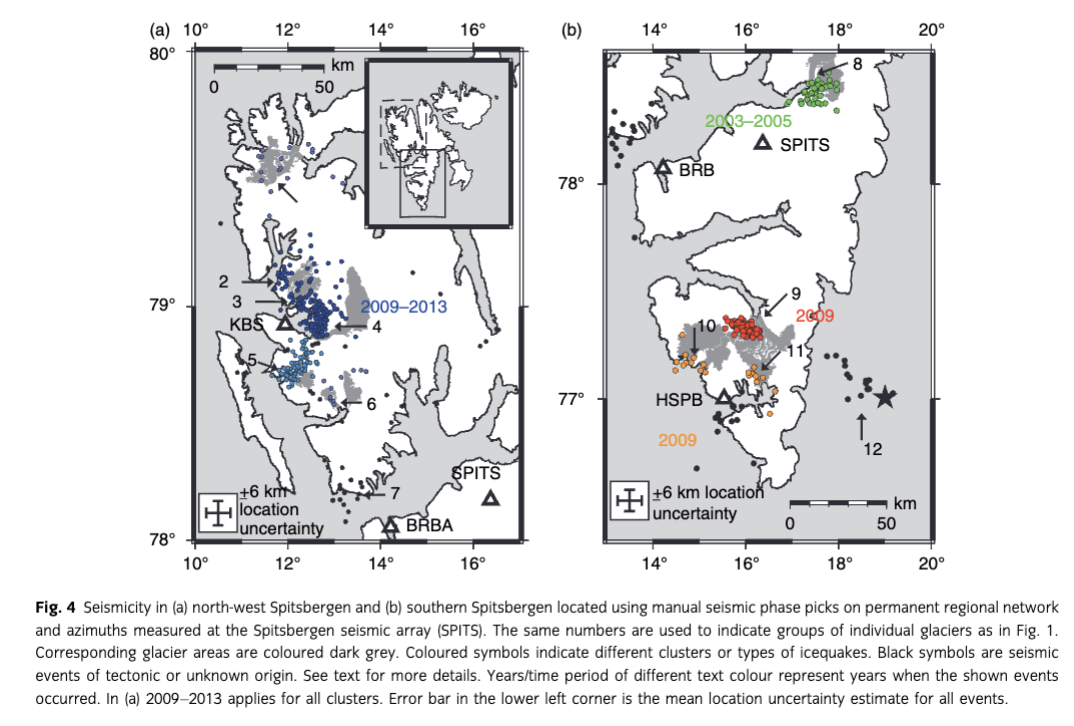
Tectonic earthquakes on and around the Svalbard Archipelago occur occasionally, mainly in confined zones (Chan & Mitchell 1985; Mitchell et al. 1990; Pirli et al. 2013). Several active coal mines on Spitsbergen generate regionally observable, human-induced seismicity (Gibbons & Ringdal 2006). None of the known seismically active fault zones or mines correspond to any of the coloured clusters in Fig. 4. We located a few events off-shore just north of station BRBA in Isfjorden (cluster 7 in Fig. 4a; see also Asming et al. 2013). The lack of tidewater glaciers in the vicinity of the fjord, and the presence of a major fault (Mitchell et al. 1990) suggested a tectonic origin. Furthermore, some events off-shore to the east of southern Spitsbergen belonged to the aftershock sequence of the 2008 Storfjorden earthquake (cluster 12 in Fig. 4b; Pirli et al. 2010; Pirli et al. 2013; Junek et al. 2015).
Almost all events of the coloured clusters in Fig. 4 (496 in total) were located on-shore in regions of known calving, fast-flowing and/or surging grounded tidewater glaciers. Less seismicity was observed further inland, as expected given that more dynamic glacial processes are often concentrated down-stream at or near the terminus. Seismic clusters could be clearly related to the location of single or groups of glaciers. However, strong seismicity was not observed at all tidewater glaciers located within the detection range of the seismic network, for example, those draining into Isfjorden between KBS and SPITS were less active.
A few events were observed in the northernmost area of Spitsbergen, covering parts of Smeerenburgbreen, Raudfjordbreen and Waggonwaybreen (cluster 1 in Fig. 4a, violet). A significant number of icequakes in that area probably remain undetected because of its distance from KBS and SPITS. The region of highest seismicity, with about 200 located events, was the Kongsfjorden area, where several tidewater glaciers drain into the fjord (blue clusters). Clusters of seismic events were observed to the north of the fjord at Julibreen (cluster 2) and Blomstrandbreen (cluster 3), and to the east at Kronebreen and Kongsbreen (cluster 4). Kronebreen is one of the fastest glaciers on Svalbard (2–3 m day−1), with intense calving activity (Chapuis et al. 2010). South of KBS, Comfortlessbreen and Aavatsmarkbreen were associated with another cluster of events (cluster 5, light blue). In the following, we will call the area of clusters 2–4 the Kongsfjorden region. The area of clusters 2–5 will be referred to as the greater Kongsfjorden region. Some seismicity was observed at larger distances from KBS to the south-east, most likely originating from Osbornebreen and/or Konowbreen (cluster 6, violet). In southern Spitsbergen Fig. 4b, we identified clusters of glacier seismicity at Tunabreen (cluster 8, green), a tidewater glacier north-east of Longyearbyen, at the Nathorstbreen glacier system (cluster 9, red, 96 located events), and in the Hornsund region at Vestre/Austre Torellbreen (cluster 10) and Storbreen (cluster 11).
Signal characteristics
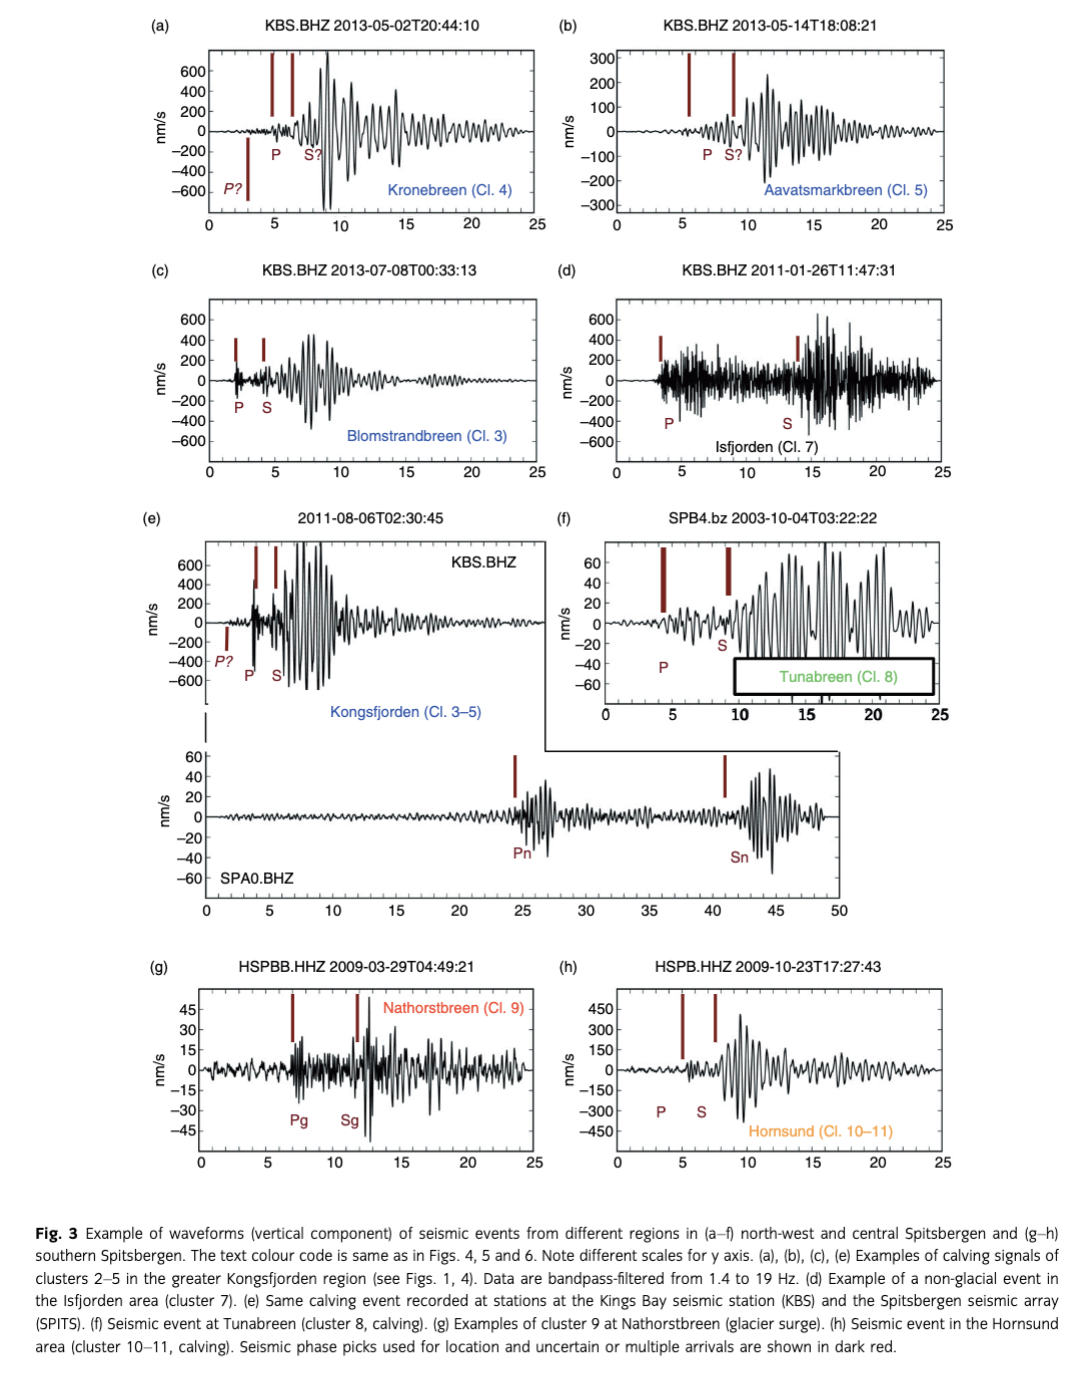
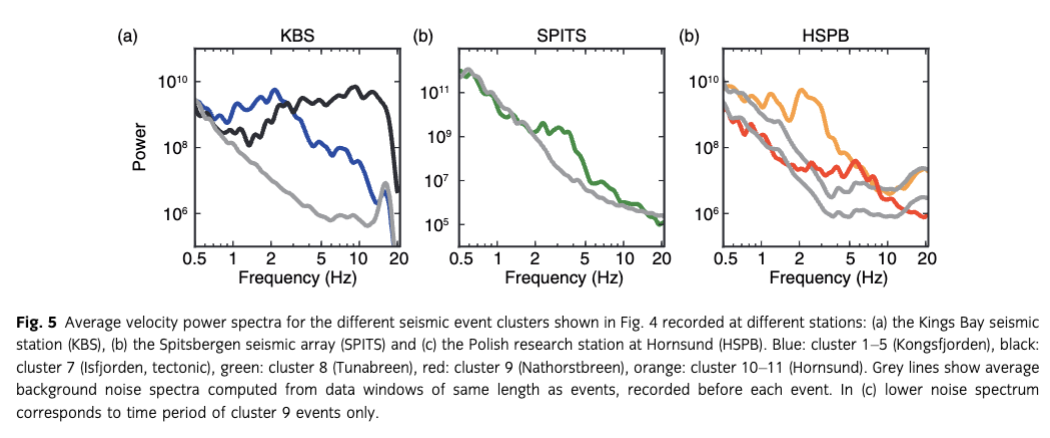
Figure 3 shows representative examples of icequakes in Spitsbergen as observed at KBS, HSPB and SPITS. Waveforms of events across the greater Kongsfjorden region were dissimilar (Fig. 3a–c, e; another example is shown in Fig. 9) and lacked similarity within individual spatial clusters. There are, however, two properties that these events shared: (1) rather weak first onset and (2) the dominant harmonic surface waves or coda of the signal. This was also the case for events at Tunabreen (Fig. 3f) and Hornsund (Fig. 3h). These signal properties suggest a near-surface source, as expected for icequakes. Signals typically contained spectral peaks between 1 and 8 Hz and lack high-frequency content (blue, green and orange lines in Fig. 5). These characteristics are also clearly visible at regional distances on the SPITS array (Fig. 3e). In contrast, records of the regional tectonic events of the Isfjorden clusters (Fig. 3d) as well as icequakes at Nathorstbreen (Fig. 3g) were characterized by more similar waveforms, well-defined P and S wave arrivals and higher signal frequencies (black and red lines in Fig. 5a, c). There was also a number of icequakes with an impulsive, high-frequent first onset followed by the harmonic signal with a cigar-shaped envelope, as seen in Fig. 3c and e. These events could be found in all clusters at Kongsfjorden, with a higher frequency of occurrence at Blomstrandbreen.
Temporal distribution
Since seismic waveforms of clusters 2–5 in the greater Kongsfjorden region (KBS) and clusters 10 and 11 in the Hornsund region (HSPB) were not similar enough for master event cross-correlation (less than 50% of the located events are detected using cross-correlation with a high number of masters), the STA/LTA detection method was applied on KBS or HSPB data in a frequency band between 2 and 8 Hz. Although spectral peaks began at 1 Hz, we chose 2 Hz to avoid triggering of microseismic noise bursts. All available data since 2007 (KBS) and 2008 (HSPB) were processed. For the cases of cluster 8 at Tunabreen (SPITS data since 2000) and cluster 9 at Nathorstbreen (HSPB and SPITS data since 2008) we applied the cross-correlation detection method because of the greater seismic waveform similarity in each cluster. A total of 25 master events was used for Nathorstbreen and six for Tunabreen. As described earlier, FK analysis at SPITS was performed to confirm that a STA/LTA or cross-correlation detection belongs to a particular source region based on the travel time differences (distance proportional) and backazimuth measurements. Figure 6 shows the azimuthal (coloured lines) and distance range (coloured ellipses) of each source region. Also shown are the corresponding time series of seismicity, which display mostly seasonal variability.

Most events occurred between July and December, with peak activity in August and September. Seasonal seismicity varies in accordance with expected glacier dynamic activity, which is highest during the melt season (Ekström et al. 2006). Distinct seasonality is observed in the greater Kongsfjorden and Hornsund regions. At Kongsfjorden 55 000 events were detected for the period between 2007 and 2013, of which about 45 000 were from glaciers draining into Kongsfjorden and 10 000 from the area south of Kongsfjorden. There were some 16 000 events detected at Hornsund for the period between 2008 and 2013. Besides seasonality, the Tunabreen time series shows exceptionally high seismic activity during the summer 2003, with 1286 detected events (compared with a total number of 4590 events between 2000 and 2013). Furthermore, cluster 9 at Nathorstbreen is an exception since almost all of the ca. 18 000 events detected there occurred within the rather short time period between January and May 2009. There were no detections for the years before and after 2009.
Glacier seismicity in the Kongsfjorden region
In what follows, we validate the detectability and locational accuracy of calving generated seismicity in the Kongsfjorden region by analysing seismic signal properties and utilizing an in situ direct record of glacier calving events in 2009 and 2010 and the temporary seismic network from summer 2013.
Calving signal characteristics
Regionally and teleseismically observed icequakes are mostly attributed to calving (O’Neel et al. 2007; Veitch & Nettles 2012). Regional calving events are typically observed with local magnitudes of 1–2.5 (Qamar 1988; O’Neel et al. 2007; O’Neel et al. 2010), consistent with preliminary local magnitudes between 0.5 and 2.0 estimated with the SEISAN earthquake analysis software package (Havskov & Ottemoller 1999). Crevasse opening, in contrast, has been observed consistently to generate weak seismic signals with negative magnitudes (Cichowicz 1983; Walter et al. 2009; Mikesell et al. 2012).
The peaks in the frequency spectrum of seismic events in the greater Kongsfjorden region between 1 and 8 Hz (Fig. 5a) are consistent with other studies of iceberg calving (O’Neel et al. 2007; Amundson et al. 2008; Walter et al. 2010). Comparison of waveforms of the same calving event at KBS and SPITS (Fig. 3e) and comparison of calving events with the tectonic event (Fig. 3d) suggests that this spectral characteristic is not merely a path effect. The source processes responsible for spectral characteristics of calving events are not well-understood and the discussion is ongoing (Amundson et al. 2012; Bartholomaus et al. 2012; Richardson et al. 2012). Seismic signals generated by the actual rupture process shortly before or during break-up, or detachment of icebergs, are expected to be observed locally only, because of the small amounts of energy released (O’Neel et al. 2010). However, we do observe seismic events at near-regional distances at SPITS. Other mechanisms such as iceberg interactions with the seafloor (Amundson et al. 2008) or iceberg–sea-surface interactions after detachment, such as surface impact, cavitation and iceberg deceleration, as suggested by Bartholomaus et al. (2012), are expected to be observed at larger distances in agreement with our results. The source-time-function of such processes is probably longer and more complex (e.g., several subsequent events) than that of a simple rupture process and could explain the lack of clear P and S arrivals or the presence of multiple P and S phases close to the source for many of the observed seismic events on Spitsbergen. On the other hand, the impulsive, high-frequency phases of some events observed locally (Fig. 3c, e) could be interpreted as the signal of a rupture process (e.g., the break-off) followed by the sea-surface impact of the ice. Presence or lack of this seismic phase could be related to propagation effects. For example, events from Blomstrandbreen show these phases more often than signals from Kronebreen.
Validation with local seismic data
From the group of hand-picked events in the greater Kongsfjorden region located using SPITS and KBS (blue cluster in Fig. 4a), we selected all icequakes between May and September 2013 (Fig. 7b). For comparison, the original automatically obtained locations of these events in the SPITS catalogue are shown in Fig. 7a. The local seismic data set acquired between May and September 2013 at Kongsfjorden was then used to relocate these icequakes with greater accuracy (Fig. 7c). The arrival time data obtained by manual seismic phase picking, as well as measurements of signal backazimuth using FK analysis on the three geophone arrays, allowed us to invert epicentres for 46 events. Error bars in Fig. 7c were estimated in the same way as for regional data through random perturbation of modelled travel times and azimuths. Solutions presented in Fig. 7c show that almost all events originate at the termini of Blomstrandbreen, Kongsbreen, Aavatsmarkbreen or Kronebreen. One event of unknown origin, with signals unlike those generated by calving events, was located upstream Kongsvegen (black dot). Kronebreen is the most active glacier, with 22 events. We then grouped these icequakes according to their location at Kongsfjorden. The fully automatic locations from the SPITS catalogue for the same events in Fig. 7a were scattered throughout the entire north-western Spitsbergen. However, comparison of Fig. 7b and c confirms that the regional locations obtained from KBS and SPITS data were sufficiently accurate to associate seismic event clusters with individual tidewater glaciers in the region, despite occasional outliers and more scattered epicentres. This is an important result, verifying the spatial resolution and usefulness of the permanent seismic network for past and future glacier monitoring.

In order to demonstrate that the 46 manually located events are representative of the majority of detected signals in the greater Kongsfjorden region (blue area and histogram in Fig. 6), FK analysis was performed at each of the three local geophone arrays for each automatic event detection at KBS. We confirmed that 50% of about 3000 detections in the Kongsfjorden region between May and July 2013 were associated with signals on all three arrays with backazimuth measurements that point clearly towards the terminus of Kronebreen. The remaining events could either be related to the locations of the other tidewater glaciers in the greater Kongsfjorden region (25%) or corresponded to signals on the temporary receivers that were too weak to obtain stable backazimuths on at least two arrays. These signals were most likely emitted by tidewater glaciers further away from Kronebreen and were detected at KBS due to a better signal-to-noise ratio at the permanent station than that on the temporary deployments.
Validation with in situ calving observations at Kronebreen
To verify that calving is the dominant source for glacier seismicity in the Kongsfjorden region, we used in situ observation data of calving events. For 23 days in August 2009 and 2010, calving activity at Kronebreen, which terminates in an ice cliff 30–40 m in height, was monitored continuously by direct visual observation at a distance of about 1.5 km (Chapuis et al. 2010). The type of calving was recorded, together with a relative size parameter. Calving was classified into avalanching (small pieces of ice fall off terminus), column drop (vertical collapse of ice column), column rotation (rotation during collapse), submarine (ice release under water) and block slump events (single ice block falls off terminus). The size parameter reflects the volume of ice detached from the front during a calving event in a semi-quantitative manner (O’Neel et al. 2003; O’Neel et al. 2007). The range is 1–20, with 20 being the entire width of the glacier front collapsing. The size parameter has been mapped to actual iceberg volumes at Kronebreen by means of photogrammetry (Chapuis & Tetzlaff 2014). A size 1 event corresponds to an ice volume of ca. 10 m3 and size 11 to more than 100 000 m3. It has been shown that the size distribution of calving events at Kronebreen follows a power law relation (Chapuis & Tetzlaff 2014).
The in situ calving event record from Kronebreen was compared with our autonomous STA/LTA detections at KBS. At first, no FK analysis was applied to the SPITS data in order to verify the origin of events in the Kongsfjorden region. We found that ice avalanches, block slumps and submarine events had rather low matching rates between 28 and 60% (Fig. 8). These events are expected to release less seismic energy on account of their size, and possibly lack of sea-surface impact in the case of submarine calving, which results in poor detectability at KBS. However, the matching rates for column drops and column rotations events were significantly higher (50–80%), gradually increasing to 100% in the case of column drops. This greater detectability of these high-volume calving styles is explained by the marked interaction with the water and therefore stronger seismic signals generated. Furthermore, the increasing matching rates if only calving events above or equal a certain size are compared (“lower calving size limit” in Fig. 8) indicates that larger ice volume loss increases the probability that the event is observed seismically. If we used only detections confirmed by FK analysis to have originated in the Kongsfjorden region (complete STA/LTA detection method as described earlier in this article), the matching rates for column drop are only a few percent lower (green triangles in Fig. 8). The matching rates are significantly higher than those obtained from seismic detections on a single geophone installation at Kronebreen (Köhler et al. 2012). This is most likely due to the lack of sensitivity below 10 Hz for the geophone used in that study.
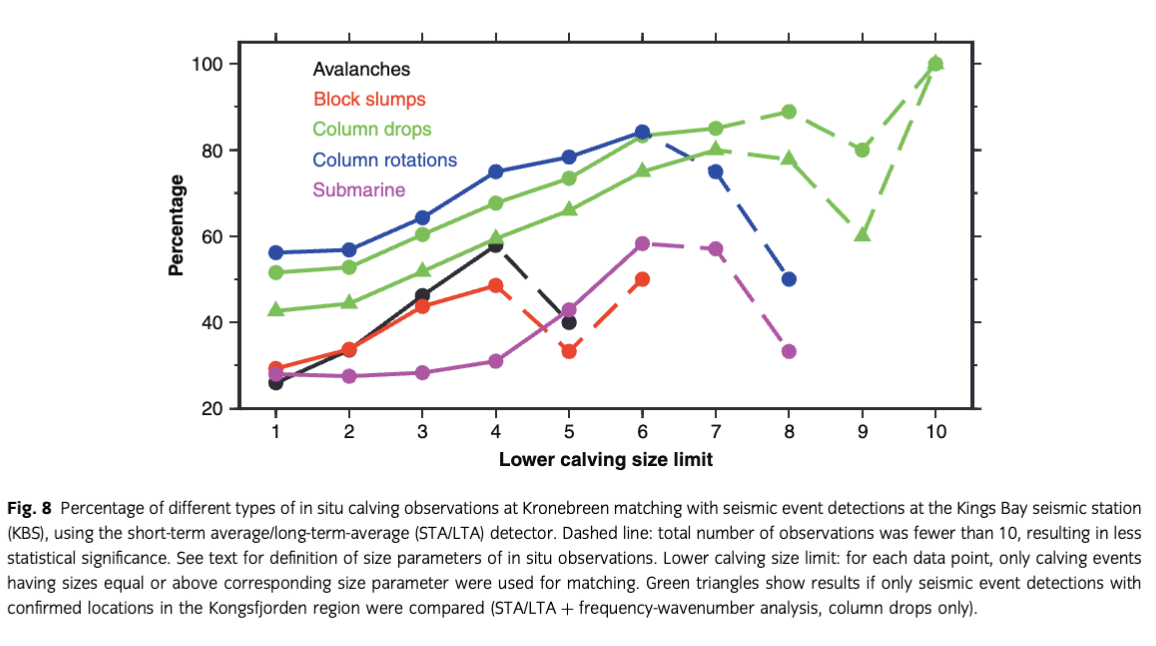
The number of in situ calving observations at Kronebreen (Chapuis et al. 2010) was about 1600 (all types). The number of FK-confirmed detections in the Kongsfjorden region during the same time period was of the same order (1400). Given matching rates between 30% (average for all types) and 45% (column drops only), it is a reasonable assumption that non-matching seismic detections were calving events from Kongsbreen, Blomstrandbreen or Julibreen. This is also supported by the local seismic network analysis, which showed that Kronebreen caused about 50% of the seismicity in 2013. Furthermore, more than twice the number of calving events were observed visually in 2009 than during the same time period in 2010, correlating well with the changing number of icequake detections in both years (Fig. 6).
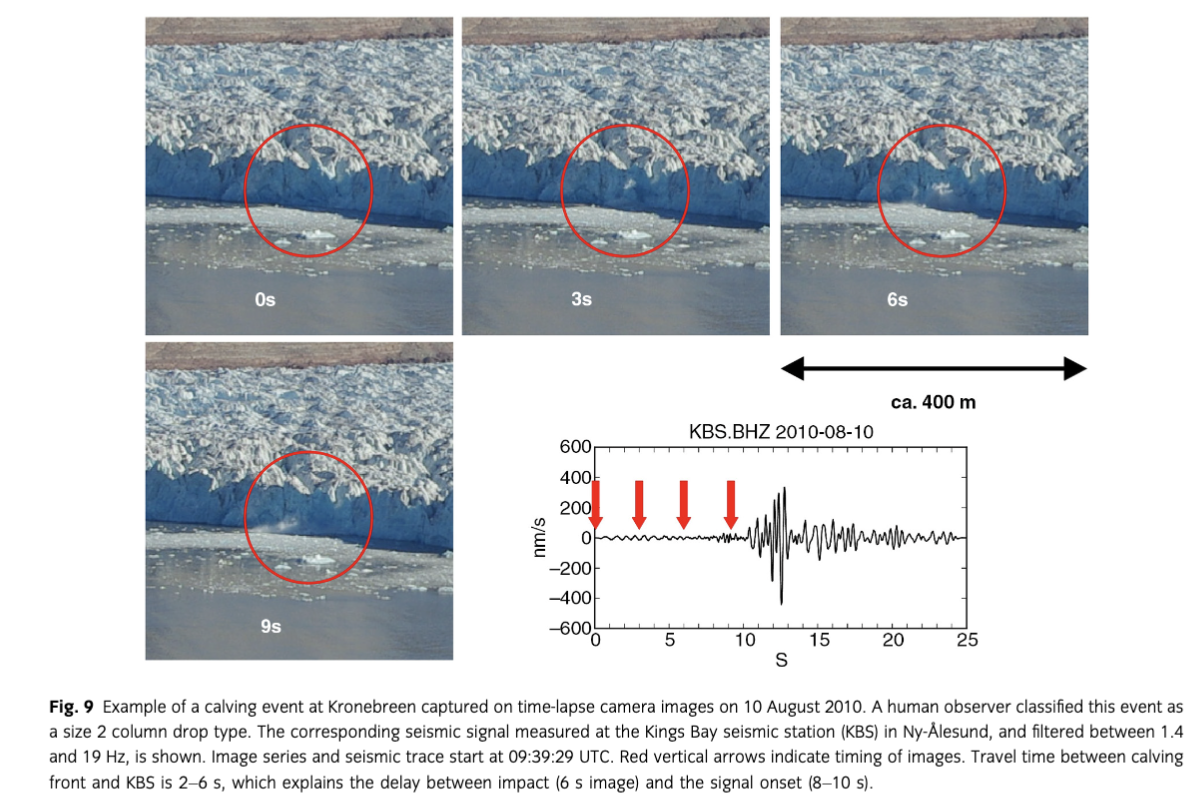
In addition to direct human observations, time-lapse camera images are available at Kronebreen for the visual observation time period. Figure 9 shows an example of a column drop calving event of size 2 and the matching seismic signal measured at KBS in August 2010. Finally, comparison between a calving event captured on film in May 2014 and the corresponding seismic record at KBS shows that the largest amplitude signals in the 1–8 Hz frequency band were related to ice–water interaction during calving (video provided in Christensen 2014).
Discussion
Seismic events from Nathorstbreen and Tunabreen observed by the SPITS array showed higher mutual waveform similarity than calving events at Kongsfjorden (KBS) and Hornsund (HSPB). Hence, correlation detection produced more robust results for Nathorstbreen and Tunabreen than STA/LTA triggering. This was because of the lower risk of detecting events of a different (non-glacial) origin and a greater ability to detect weak signals. Waveform cross-correlation, on the other hand, cannot be used for detecting calving seismicity at Kongsfjorden and Hornsund because of the lack of waveform similarity. The event catalogues for Kongsfjorden and Hornsund might be not as complete for low-magnitude events as that for Nathorstbreen, and we cannot rule out the inclusion of other seismic wave sources having similar spectral characteristics to those associated with calving. In summary, we found that each event class on Spitsbergen had to be evaluated individually to choose the most suitable method for detection and constraining the source region.
Our results enable the counting of icequakes above a certain seismic detection threshold, which depends on both the seismic noise level at a particular station and on the detection method used. More in situ observations (e.g., of calving) are required to quantify the number of undetected events at individual glaciers. Hence in what follows, we focus mainly on analysing the temporal variability of calving time series rather than interpreting absolute levels of glacier seismicity,
Evolution of calving seismicity in the Kongsfjorden region
The validation with in situ calving observations and local seismic data clearly shows that the regionally observed glacier seismicity in the greater Kongsfjorden region originated from calving processes at the glacier front. At least half of the events originated at Kronebreen. The seismic detection time series in the greater Kongsfjorden region can therefore be interpreted as a proxy for calving activity between 2007 and 2013 (Fig. 6). The maximum number of detections was about 70 per day. The highest levels of seismicity were observed to have occurred in 2007 and 2012. The year 2010 was rather quiet, with reduced calving activity. The seasonal calving maximum coincides with the glacier ablation period and increases in glacier velocity due to meltwater induced basal sliding (Iken & Bindschadler 1986; Nettles et al. 2008). Interestingly, the increase in calving seismicity during summer typically occurred with a one to two month delay (i.e., August/September) from the July peak of positive degree-days on Spitsbergen (see star symbols in Fig. 6). The delay was observed for all years except 2012, when maximum icequake activity occurred simultaneously with the July temperature peak. The sea-surface temperature maximum, on the other hand, is expected later between August and October. Our observations may therefore reflect the effect of ice being undercut at the glacier terminus through frontal melting, leading to calving (O’Leary & Christoffersen 2013).
The distribution of detections in Fig. 6 reveals that there was a slightly higher level of seismicity between 2007 and 2009 in the area to the south of Kongsfjorden than in the following years. On the other hand, seismic activity at Kongsfjorden was high in 2011 and 2012 and the difference compared with the number of calving events to the south was much more pronounced. Starting in 2008, and lasting through 2009, Comfortlessbreen advanced by 500–700 m, indicating a surging phase (Sund & Eiken 2010; Mansell et al. 2012). Higher seismicity in 2008 and 2009 in that area may therefore be the result of increased calving activity during the surge.
Calving seismicity as an indicator for surging of Tunabreen
Tunabreen is a surge-type tidewater glacier in central Spitsbergen that surged in 1930, 1970 and most recently in 2003 (Yoshioka et al. 2006; Forwick et al. 2010). Waveforms and spectral characteristics of Tunabreen seismic events suggest a similar source mechanism to that in the greater Kongsfjorden region (Figs. 3f, 5b). Similar harmonic waveforms and a lack of clear P and S phases were observed. The station distribution did not allow the source locations to be constrained with an accuracy high enough to relate all events clearly to the terminus of Tunabreen (In fact, the cluster is shifted slightly towards Von Postbreen, a land-terminating glacier south-east of Tunabreen). However, given the seasonality (Fig. 6) and signal character, it is reasonable to assume that calving was the source of seismicity. It is striking that the summer peak in calving seismicity was significantly higher in 2003. Almost 28% of the total number of events between 2000 and 2013 occurred in that year. Note that the event distribution between 2008 and 2013 is not shown but had the same seasonality and comparable activity level as prior and after 2003.
During the most recent surge of Tunabreen, beginning in 2003, the glacier advanced about 1.4 km until August 2004 (Sund 2014). Increased calving activity has been reported during autumn 2003 (Sund 2014), which agrees with our seismic observations. Hence, our results show that it is possible to detect surges at Tunabreen indirectly through observation of an exceptional high level of calving seismicity during the melt season. We have made similar observations at Wahlenbergbreen, a glacier in north-west Spitsbergen that surged in 2011. These findings enhance the potential to recognize surge phases of Spitsbergen tidewater glaciers in the past and to monitor active surging glaciers in real time.
Calving seismicity in the Hornsund region
Local observations of icequakes at Hornsund have been reported in previous studies at Hansbreen (Cichowicz 1983; Górski 2004). Recently, underwater acoustic measurements revealed signals related to glacier calving in that region (Glowacki et al. 2015). Although they were lower in number than in the Kongsfjorden region, we found that seismic events in the Hornsund region showed a similar seasonality (Fig. 6) and were also located at grounded tidewater glaciers, Vestre/Austre Torellbreen (cluster 10) and Storbreen (cluster 11). Waveforms and spectra shared similarities with calving events in the Kongsfjorden region (Fig. 5c). Despite the lack of in situ calving observations in southern Spitsbergen, we are therefore confident that those events represented calving activity. We were not able to locate calving events at Hansbreen since no signal was clearly observed at SPITS. However, this does not mean that these events were absent. A possible explanation is that those events were in general weaker than, for example, calving at Storbreen, which is at a comparable distance from SPITS. Observation of lower calving seismicity at Hornsund than at Kongsfjorden could also partly be due to a higher seismic noise level at HSPB than at KBS. Calving rate estimates for individual glaciers are required to better understand this discrepancy, which could be the subject of future studies.
As at Kongsfjorden, the seasonal increase in seismicity in the Hornsund region was delayed by one to two months with respect to the maximum of positive degree-days in July. The interannual variability does not, however, correlate well with observations at Kongsfjorden. For example, there was no missing delay in peak seismic activity in 2012 in the Hornsund region. This may indicate that the driving mechanism of calving does not just depend on the cumulative air or sea-surface temperatures in summer, but also on local glacier geometry, and/or on meteorological and fjord water conditions.
Icequakes during the surge of Nathorstbreen
The temporal distribution of events in the cluster in south-central Spitsbergen showed no seasonality (Figs. 4b, 6). Almost all events occurred between January and May 2009. The event locations covered parts of Zawadzkibreen, a branch of the marine-terminating Nathorstbreen glacier system. The system underwent a major surging phase between 2008 and 2011, the largest surge observed on Spitsbergen since 1938 (Sund et al. 2009; Sund & Eiken 2010; Sund et al. 2014). The lack of seasonality, source locations upstream from Zawadzkibreen, the more self-similar waveforms with clear P and S onsets (Fig. 3g) and the lack of lower frequencies (Fig. 5c) suggest a source other than calving for these seismic events. A more detailed discussion of possible seismic source processes active during the initial phase of the Zawadzkibreen surge based on joined interpretation of remote sensing data is provided by Sevestre et al. (unpubl. ms.). Despite the fact that it is a tidewater glacier, we did not observe other types of seismic events at Nathorstbreen, i.e., no signals were observed that could be identified as calving events based on the spectral and waveform characteristics.
Conclusions
In this study, permanent seismic stations were used to detect and locate seismic signals associated with dynamic glacier activity on Spitsbergen between 2000 and 2013. We developed a detection system based on STA/LTA triggering, waveform cross-correlation and array analysis to produce time series of glacier seismicity in different regions of Spitsbergen. The STA/LTA method is powerful and robust for detecting seismic calving events recorded close to their source, whereas cross-correlation has been used to detect more self-similar seismic observations of calving and surging at larger distances. The majority of icequake observations in all years originated at the calving front of tidewater glaciers. Most seismic events had harmonic waveforms with frequencies between 1 and 8 Hz. Using local seismic records and in situ calving observations, we have shown that calving was the source for seismic events in the Kongsfjorden region. Our results present the first glacier calving record with high temporal resolution over several years available for Svalbard. This is just the first step towards quantification of dynamic ice losses from glacier calving. Future research should explore relationships between the distribution of seismic events, their waveform properties and the actual magnitude of dynamic ice losses through calving.
The temporal distribution of calving events in Spitsbergen is characterized by seasonal variations. An increase of seismicity during the melt season was observed, often delayed by a few weeks to months from the summer melt peak, which suggests a control on calving by sea-surface temperatures. Significant interannual variations were observed both for winter and summer seasons. We have shown that seismic observations can be used to recognize initiating or ongoing glacier surges. Increased calving activity was observed at Tunabreen during the surge in 2003. Furthermore, another type of icequake could be identified during the initial phase of the surge of the Zawadskibreen in 2009.
Our results demonstrate that regional monitoring of glacier-related seismicity is a powerful method to further understand glacier dynamics on a variety of temporal scales. The key advantage that seismology offers is in providing continuous, long-term, high-resolution records of seismic signals produced by processes such as glacier calving, for which it is usually difficult to obtain continuous observations for more than a few days or weeks. More calibration studies with local measurements on glaciers are required to decipher source mechanisms and provide greater insight into the physical glacier processes that generate seismic signals. We believe that long-term monitoring of glacier-related seismicity has the potential to provide information on both the long-term and short-term evolution of glacier motion, calving and surging. The understanding of these processes is fundamental to better characterize glacier response to climatic changes.
Acknowledgements
This study was carried out in the framework of the research projects Seismic Monitoring of Glacier Activity on Svalbard, followed by Glacier Dynamic Ice Loss Quantified through Seismic Eyes, both funded by the Research Council of Norway (contract no. 213359/F20, 244196/E10). CN was supported by the European Research Council (ERC) under the European Union’s Seventh Framework Programme (FP/2007–2013)/ERC grant agreement no. 320816. Station HSPB is operated by the Institute of Geophysics, Polish Academy of Sciences, and NORSAR and was installed within the framework of an International Polar Year project mainly financed by the Research Council of Norway (contract no. 176069/S30). Stations BRBA and BRBB were installed in cooperation between the KRSC and NORSAR, funded by the Research Council of Norway (POLRES, contract no. 196157/S30). We use the SEISAN (Havskov & Ottemoller 1999), ObsPy (Beyreuther et al. 2010) and EP (Fyen 1989) software packages for seismic data analysis. Figures were produced using GMT (Wessel & Smith 1998) and ObsPy software. Instrumentation of the local seismic field measurement at Kronebreen was provided by the Geophysical Instrument Pool of the German Research Centre for Geosciences Potsdam and the Kiel University. Special thanks go to Thomas Schellenberger (University of Oslo) and Jack Kohler (Norwegian Polar Institute) for support during station deployment in 2013. We appreciate financial support from the Industrial Liaison fund, University of Oslo. Last but not least, we want to thank two anonymous reviewers for their valuable comments and suggestions that helped to improve this manuscript.
References
- Amundson J.M., Clinton J.F., Fahnestock M., Truffer M., Lüthi M.P. & Motyka R.J. 2012. Observing calving-generated ocean waves with coastal broadband seismometers, Jakobshavn Isbræ, Greenland. Annals of Glaciology 53, 79–84. Publisher Full Text
- Amundson J.M., Truffer M., Lüthi M.P., Fahnestock M., West M. & Motyka R.J. 2008. Glacier, fjord, and seismic response to recent large calving events, Jakobshavn Isbræ, Greenland. Geophysical Research Letters 35, L22501, doi: http://dx.doi.org/10.1029/2008GL035281 Publisher Full Text
- Anandakrishnan S. & Bentley C.R. 1993. Micro-earthquakes beneath Ice Streams B and C, West Antarctica: observations and implications. Journal of Glaciology 39, 455–462.
- Asming V., Baranov S., Vinogradov Y.A. & Voronin A. 2013. Seismic and infrasonic monitoring on the Spitsbergen Archipelago. Seismic Instruments 49, 209–218. Publisher Full Text
- Åström J.A., Vallot D., Schäfer M., Welty E.Z., O’Neel S., Bartholomaus T.C., Liu Y., Riikilä T.I., Zwinger T., Timonen J. & Moore J.C. 2014. Termini of calving glaciers as self-organized critical systems. Nature Geoscience 7, 874–878. Publisher Full Text
- Bartholomaus T., Larsen C., O’Neel S. & West M. 2012. Calving seismicity from iceberg–sea surface interactions. Journal of Geophysical Research—Earth Surface 117, F04029, doi: http://dx.doi.org/10.1029/2012JF002513
- Beyreuther M., Barsch R., Krischer L., Megies T., Behr Y. & Wassermann J. 2010. ObsPy: a Python toolbox for seismology. Seismological Research Letters 81, 530–533. Publisher Full Text
- Blankenship D.D., Anandakrishnan S., Kempf J.L. & Bentley C.R. 1987. Microearthquakes under and alongside Ice Stream B, Antarctica, detected by a new passive seismic array. Annals of Glaciology 9, 30–34.
- Carmichael J.D., Pettit E.C., Hoffman M., Fountain A. & Hallet B. 2012. Seismic multiplet response triggered by melt at Blood Falls, Taylor Glacier, Antarctica. Journal of Geophysical Research—Earth Surface 117, F03004, doi: http://dx.doi.org/10.1029/2011jf002221 Publisher Full Text
- Chan W.W. & Mitchell B. 1985. Intraplate earthquakes in northern Svalbard. Tectonophysics 114, 181–191. Publisher Full Text
- Chapuis A., Rolstad C. & Norland R. 2010. Interpretation of amplitude data from a ground-based radar in combination with terrestrial photogrammetry and visual observations for calving monitoring of Kronebreen, Svalbard. Annals of Glaciology 51, 34–40. Publisher Full Text
- Chapuis A. & Tetzlaff T. 2014. The variability of tidewater-glacier calving: origin of event-size and interval distributions. Journal of Glaciology 60, 622–634. Publisher Full Text
- Christensen A. 2014. Breforskere med sjelden kalveflaks. (Calving event caught on film by lucky researchers.) Accessed on the internet at http://forskning.no/miljoovervakning-geofag-polarforskning-vaer-og-vind/2014/07/breforskere-med-sjelden-kalveflaks on 22 May 2015
- Cichowicz A. 1983. Icequakes and glacier motion: the Hans glacier, Spitsbergen. Pure and Applied Geophysics 121, 27–38. Publisher Full Text
- Dahl-Jensen T., Larsen T.B. & Voss P.H. 2010. Greenland ice sheet monitoring network (GLISN): a seismological approach. Geological Survey of Denmark and Greenland Bulletin 20, 55–58.
- Deichmann N., Ansorge J., Scherbaum F., Aschwanden A., Bernardi F. & Gudmundsson G.H. 2000. Evidence for deep icequakes in an Alpine glacier. Annals of Glaciology 31, 85–90. Publisher Full Text
- Dowdeswell J.A. & Benham T.J. 2003. A surge of Perseibreen, Svalbard, examined using aerial photography and ASTER high resolution satellite imagery. Polar Research 22, 373–383. Publisher Full Text
- Ekström G., Nettles M. & Abers G.A. 2003. Glacial earthquakes. Science 302, 622–624. Publisher Full Text
- Ekström G., Nettles M. & Tsai V.C. 2006. Seasonality and increasing frequency of Greenland glacial earthquakes. Science 311, 1756–1758. Publisher Full Text
- Forwick M., Vorren T.O., Hald M., Korsun S., Roh Y., Vogt C. & Yoo K.C. 2010. Spatial and temporal influence of glaciers and rivers on the sedimentary environment in Sassenfjorden and Tempelfjorden, Spitsbergen. Geological Society of London Special Publications 344, 163–193. Publisher Full Text
- Fyen J. 1989. Event processor program package. NORSAR Semiannual Technical Summary, NORSAR Scientific Report 2–88/89 117–123.
- Gibbons S.J. & Ringdal F. 2006. The detection of low magnitude seismic events using array-based waveform correlation. Geophysical Journal International 165, 149–166. Publisher Full Text
- Gibbons S.J., Schweitzer J., Ringdal F., Kværna T., Mykkeltveit S. & Paulsen B. 2011. Improvements to seismic monitoring of the European Arctic using three-component array processing at SPITS. Bulletin of the Seismological Society of America 101, 2737–2754. Publisher Full Text
- Glowacki O., Deane G.B., Moskalik M., Blondel P.H., Tegowski J. & Blaszczyk M. 2015. Underwater acoustic signatures of glacier calving. Geophysical Research Letters 42, 804–812. Publisher Full Text
- Górski M. 2004. Predominant frequencies in the spectrum of ice-vibration events. Acta Geophysica Polonica 52, 457–464.
- Hagen J.O., Kohler J., Melvold K. & Winther J.G. 2003. Glaciers in Svalbard: mass balance, runoff and freshwater flux. Polar Research 22, 145–159. Publisher Full Text
- Havskov J., Bormann P. & Schweitzer J. 2012. Seismic source location. In P. Bormann (ed.): New manual of seismological observatory practice 2 (NMSOP–2). 2nd edn. Potsdam: German Research Centre for Geosciences.
- Havskov J. & Ottemoller L. 1999. SEISAN earthquake analysis software. Seismological Research Letters 70, 532–534. Publisher Full Text
- Iken A. & Bindschadler R.A. 1986. Combined measurements of subglacial water pressure and surface velocity of Findelengletscher, Switzerland: conclusions about drainage system and sliding mechanism. Journal of Glaciology 32, 101–119.
- Junek W.N., Kværna T., Pirli M., Schweitzer J., Harris D.B., Dodge D.A. & Woods M.T. 2015. Inferring aftershock sequence properties and tectonic structure using empirical signal detectors. Pure and Applied Geophysics 172, 359–373. Publisher Full Text
- Junek W.N., Roman-Nieves J.I. & Woods M.T. 2014. Tectonic implications of earthquake mechanisms in Svalbard. Geophysical Journal International 196, 1152–1161. Publisher Full Text
- Kääb A., Lefauconnier B. & Melvold K. 2005. Flow field of Kronebreen, Svalbard, using repeated Landsat 7 and ASTER data. Annals of Glaciology 42, 7–13. Publisher Full Text
- Kafka A.L. 1990. Rg as a depth discriminant for earthquakes and explosions: a case study in new England. Bulletin of the Seismological Society of America 80, 373–394.
- Köhler A., Chapuis A., Nuth C., Kohler J. & Weidle C. 2012. Autonomous detection of calving-related seismicity at Kronebreen, Svalbard. The Cryosphere 6, 393–406. Publisher Full Text
- Kohler J., James T., Murray T., Nuth C., Brandt O., Barrand N., Aas H. & Luckman A. 2007. Acceleration in thinning rate on western Svalbard glaciers. Geophysical Research Letters 34, L18502, doi: http://dx.doi.org/10.1029/2007GL030681 Publisher Full Text
- Kvaerna T. & Ringdal F. 1986. Stability of various FK estimation techniques. NORSAR Semiannual Technical Summary, NORSAR Scientific Report 1–86/87 29–40.
- Levshin A.L., Schweitzer J., Weidle C., Shapiro N.M. & Ritzwoller M.H. 2007. Surface wave tomography of the Barents Sea and surrounding regions. Geophysical Journal International 170, 441–459. Publisher Full Text
- Mansell D., Luckman A. & Murray T. 2012. Dynamics of tidewater surge-type glaciers in northwest Svalbard. Journal of Glaciology 58, 110–118. Publisher Full Text
- Martín-Español A., Navarro F.J., Otero J., Lapazaran J.J. & Błaszczyk M. 2015. Estimate of the total volume of Svalbard glaciers, and their potential contribution to sea-level rise, using new regionally based scaling relationships. Journal of Glaciology 61, 29–41. Publisher Full Text
- Mikesell T., van Wijk K., Haney M.M., Bradford J.H., Marshall H.P. & Harper J.T. 2012. Monitoring glacier surface seismicity in time and space using Rayleigh waves. Journal of Geophysical Research—Earth Surface 117, F02020, doi: http://dx.doi.org/10.1029/2011JF002259 Publisher Full Text
- Mitchell B., Bungum H., Chan W. & Mitchell P. 1990. Seismicity and present-day tectonics of the Svalbard region. Geophysical Journal International 102, 139–149. Publisher Full Text
- Neave K.G. & Savage J.C. 1970. Icequakes on the Athabasca glacier. Journal of Geophysical Research 75, 1351–1362. Publisher Full Text
- Nettles M., Larsen T.B., Elósegui P., Hamilton G.S., Stearns L.A., Ahlstrøm A.P., Davis J.L., Andersen M.L., de Juan J., Khan S., Stenseng L., Ekström G. & Forsberg R. 2008. Step-wise changes in glacier flow speed coincide with calving and glacial earthquakes at Helheim Glacier, Greenland. Geophysical Research Letters 35, L24503, doi: http://dx.doi.org/10.1029/2008GL036127 Publisher Full Text
- NORSAR 2006. BARENTS3D—a (hybrid) 3D crust and upper mantle model for the greater Barents Sea region. Accessed on the internet at http://www.norsar.no/seismology/Projects/BarentsSea3D/ on 2 October 2014
- Nuth C., Kohler J., König M., von Deschwanden A., Hagen J., Kääb A., Moholdt G. & Pettersson R. 2013. Decadal changes from a multi-temporal glacier inventory of Svalbard. The Cryosphere 7, 1603–1621. Publisher Full Text
- Nuth C., Moholdt G., Kohler J., Hagen J.O. & Kääb A. 2010. Svalbard glacier elevation changes and contribution to sea level rise. Journal of Geophysical Research—Earth Surface 115, F01008, doi: http://dx.doi.org/10.1029/2008JF001223 Publisher Full Text
- O’Leary M. & Christoffersen P. 2013. Calving on tidewater glaciers amplified by submarine frontal melting. The Cryosphere 7, 119–128. Publisher Full Text
- O’Neel S., Echelmeyer K.A. & Motyka R.J. 2003. Short-term variations in calving of a tidewater glacier: LeConte Glacier, Alaska, USA. Journal of Glaciology 49, 587–598. Publisher Full Text
- O’Neel S., Larsen C., Rupert N. & Hansen R. 2010. Iceberg calving as a primary source of regional-scale glacier-generated seismicity in the St. Elias Mountains. Journal of Geophysical Research—Earth Surface 115, F04034, doi: http://dx.doi.org/10.1029/2009JF001598 Publisher Full Text
- O’Neel S., Marshall H.P., McNamara D.E. & Pfeffer W.T. 2007. Seismic detection and analysis of icequakes at Columbia Glacier, Alaska. Journal of Geophysical Research—Earth Surface 112, F03S23, doi: http://dx.doi.org/10.1029/2006JF000595
- O’Neel S. & Pfeffer W.T. 2007. Source mechanics for monochromatic icequakes produced during iceberg calving at Columbia Glacier, AK. Geophysical Research Letters 34, L22502, doi: http://dx.doi.org/10.1029/2007GL031370 Publisher Full Text
- Pirli M., Schweitzer J., Ottemöller L., Raeesi M., Mjelde R., Atakan K., Guterch A., Gibbons S.J., Paulsen B., Debski W. & Kværna T. 2010. Preliminary analysis of the 21 February 2008 Svalbard (Norway) seismic sequence. Seismological Research Letters 81, 63–75. Publisher Full Text
- Pirli M., Schweitzer J. & Paulsen B. 2013. The Storfjorden, Svalbard, 2008–2012 aftershock sequence: seismotectonics in a polar environment. Tectonophysics 601, 192–205. Publisher Full Text
- Qamar A. 1988. Calving icebergs: a source of low-frequency seismic signals from Columbia Glacier, Alaska. Journal of Geophysical Research—Solid Earth and Planets 93, 6615–6623. Publisher Full Text
- Richardson J.P., Waite G.P., FitzGerald K.A. & Pennington W.D. 2010. Characteristics of seismic and acoustic signals produced by calving, Bering Glacier, Alaska. Geophysical Research Letters 37, L03503, doi: http://dx.doi.org/10.1029/2009GL041113
- Richardson J.P., Waite G.P., Pennington W.D., Turpening R.M. & Robinson J.M. 2012. Icequake locations and discrimination of source and path effects with small aperture arrays, Bering Glacier terminus, AK. Journal of Geophysical Research—Earth Surface 117, F04013, doi: http://dx.doi.org/10.1029/2012JF002405 Publisher Full Text
- Ritzmann O., Maercklin N., Inge Faleide J., Bungum H., Mooney W.D. & Detweiler S.T. 2007. A three-dimensional geophysical model of the crust in the Barents Sea region: model construction and basement characterization. Geophysical Journal International 170, 417–435. Publisher Full Text
- Roberts R., Christoffersson A. & Cassidy F. 1989. Real-time event detection, phase identification and source location estimation using single station three-component seismic data. Geophysical Journal International 97, 471–480. Publisher Full Text
- Schweitzer J. 2001a. HYPOSAT—an enhanced routine to locate seismic events. Pure and Applied Geophysics 158, 277–289. Publisher Full Text
- Schweitzer J. 2001b. Slowness corrections—one way to improve IDC products. Pure and Applied Geophysics 158, 375–396. Publisher Full Text
- Schweitzer J., Fyen J., Mykkeltveit S., Gibbons S., Pirli M., Kühn D. & Kværna T. 2012. Seismic arrays. In P. Bormann (ed.): New manual of seismological observatory practice 2 (NMSOP-2). 2nd edn. Potsdam: German Research Centre for Geosciences.
- Stuart G., Murray T., Brisbourne A., Styles P. & Toon S. 2005. Seismic emissions from a surging glacier: Bakaninbreen, Svalbard. Annals of Glaciology 42, 151–157. Publisher Full Text
- Sund M. 2014. Some recent Svalbard surges. Svalbard glaciers. Accessed on the internet at http://www.svalbardglaciers.org/surging_glaciers_other_glaciers.php on 22 May 2015
- Sund M. & Eiken T. 2010. Recent surges on Blomstrandbreen, Comfortlessbreen and Nathorstbreen, Svalbard. Journal of Glaciology 56, 182–184. Publisher Full Text
- Sund M., Eiken T., Hagen J.O. & Kääb A. 2009. Svalbard surge dynamics derived from geometric changes. Annals of Glaciology 50, 50–60. Publisher Full Text
- Sund M., Lauknes T. & Eiken T. 2014. Surge dynamics in the Nathorstbreen glacier system, Svalbard. The Cryosphere 8, 623–638. Publisher Full Text
- Veitch S.A. & Nettles M. 2012. Spatial and temporal variations in Greenland glacial-earthquake activity, 1993–2010. Journal of Geophysical Research—Earth Surface 117, F04007, doi: http://dx.doi.org/10.1029/2012JF002412 Publisher Full Text
- Vinogradov Y.A., Asming V.E., Baranov S.V., Fedorov A.V. & Vinogradov A.N. 2015. Seismic and infrasonic monitoring of glacier destruction: a pilot experiment on Svalbard. Seismic Instruments 51, 1–7. Publisher Full Text
- Walter F., Amundson J.M., O’Neel S., Truffer M., Fahnestock M. & Fricker H.A. 2012. Analysis of low-frequency seismic signals generated during a multiple-iceberg calving event at Jakobshavn Isbræ, Greenland. Journal of Geophysical Research—Earth Surface 117, F01036, doi: http://dx.doi.org/10.1029/2011JF002132
- Walter F., Clinton J.F., Deichmann N., Dreger D.S., Minson S.E. & Funk M. 2009. Moment tensor inversions of icequakes on Gornergletscher, Switzerland. Bulletin of the Seismological Society of America 99, 852–870. Publisher Full Text
- Walter F., O’Neel S., McNamara D., Pfeffer W., Bassis J. & Fricker H. 2010. Iceberg calving during transition from grounded to floating ice: Columbia Glacier, Alaska. Geophysical Research Letters 37, L15501, doi: http://dx.doi.org/10.1029/2010GL043201 Publisher Full Text
- Weaver C.S. & Malone S.D. 1979. Seismic evidence for discrete glacier motion at the rock–ice interface. Journal of Glaciology 23, 171–184.
- Wessel P. & Smith W.H.F. 1998. New, improved version of GMT released. Eos Transactions of the American Geophysical Union 79, 579–579. Publisher Full Text
- West M., Larsen C., Truffer M., O’Neel S. & LeBlanc L. 2010. Glacier microseismicity. Geology 38, 319–322. Publisher Full Text
- Yoshioka M., Ito H. & Yamaguchi F. 2006. Change of glaciers in Spitsbergen Island since 1933 observed with surface photographs. Memoirs of National Institute of Polar Research Special Issue 59, 134–143.
Related Articles
C. Leah Devlin
Karen Lone
Jon Aars
Christian Lydersen
Kit M. Kovacs
et al.
Jon Aars
Tiago A. Marques
Karen Lone
Magnus Andersen
et al.
Herdis M. Gjelten
Øyvind Nordli
Ketil Isaksen
Eirik J. Førland
et al.
Katarzyna Kozak
Krystyna Kozioł
Bartłomiej Luks
Stanisław Chmiel
et al.