This article is published under a Creative Commons license and not by the author of the article. So if you find any inaccuracies, you can correct them by updating the article.

Social and economic drivers of national economic development: the case of OPEC countries


Mlaabdal Saady Mahmood Abaas
Oleksandr Kubatko
Oleksandr Kubatko
Olena Chygryn
Published: Oct. 8, 2018
Latest article update: Dec. 12, 2022
This article is published under the license


Abstract
This paper examines the economic relationships between oil price volatility and socially-economic development of 14 Organization of the Petroleum Exporting Countries (OPEC) using the annual panel data for the period 1990–2014 obtained from the World Bank (WB) statistical data sets. Hausman specification test has been performed to choose the method of panel data analysis, and the results were in favor of fixed effects estimation. The main findings indicate the direct relationship between economic growth and oil price volatility. The research supports the hypothesis that an increase in crude oil prices is positively related to GDP, and a 10% increase in oil prices correlates with 0.6-4% GDP improvements. Structural changes in employment in favor of service sector are negatively correlated with GDP per capita. Changes in GDP structure in favor of oil rents on 10% lead to the shrinking of GDP on 1%. Life expectancy at birth, as an indirect indicator of health, positively influences the economic growth indicators and an improvement in life expectancy on one percentage leads on average to 1% growth in GDP and 0.5-1.33% growth in GDP per capita. Energy efficiency improvements are positive drivers of GDP values at OPEC, and our findings suggest that a 10% increase at GDP per unit of energy use leads to 3% increase of GDP itself. The study recommends investing in energy efficiency, human capital, and capital formation to guarantee long-run economic development and prosperity of OPEC counties
Keywords
Life expectancy, OPEC, economic development, oil price
INTRODUCTION
Starting from the end of World War II, the crude oil becomes an essential driver of economic growth worldwide. Regardless of the fast development of alternative energy technologies (such as wind, water, thermal, and solar powers), the demand for crude oil is still rising. According to the International Energy Agency, the main reason for the rise in annual oil consumption is the growth of the transport sector. For example, the Sports Utility Vehicles sector in the US, as well as the industry of other larger vehicles, is continuously growing. The total sales of Sports Utility Vehicles and light trucks in the US raised from 47% in 2011 to about 60% in 2017. The similar situation is evident to the EU, and oil consumption is growing by 2% annually (the highest rate starting in 2001).
The oil price fluctuations become a predominant factor of oil-producing countries national economies development. Thus, during the period 1960-2018, the average oil prices were in a range between five and more than one hundred USD per barrel. The average Organization of the Petroleum Exporting Countries (OPEC) oil prices picked during summer 2014, reaching the 108 USD per barrel. The OPEC countries are mainly oil export-depended economies, whose socio-economic development depends on the world oil prices.
The Organization of the Petroleum Exporting Countries was founded in Baghdad in 1960 by Iran, Iraq, Kuwait, Saudi Arabia, and Venezuela. Later on, the OPEC membership was extended to another ten countries including Qatar, Indonesia, Libya, the UAE, Algeria, Nigeria, Ecuador, Gabon, Angola, Equatorial Guinea, and Congo. The development of OPEC organization was non-smooth, and some countries were suspending and later on rejoined OPEC. Thus, Ecuador has terminated its membership for fifteen years in 1992 and rejoined in 2007. Indonesia has suspended its membership for seven years in 2009 and rejoined in early 2016, and again suspended its membership at the end of 2016. Gabon has suspended its membership for twenty-one years in 1995 and rejoined in 2016. It is critical to underline than OPEC Statute considers the differences between Founder Members and Full Members, the OPEC Conference decides the last countries application/terminations. For any country with a substantial positive net export balance of crude oil to become an OPEC Full Member, it is needed that at least three-fourths of Full Members are voted for during the Conference.
At the beginning of the twenty-first century, OPEC covers more than 40% of the world’s crude oil extractions and about 20% of world natural gas production. The total deposits of oil within OPEC are estimated at 80% of all available in the world.
The main goal of this study is to determine the common factors and their influence on economic growth indicators of selected OPEC member states and forming policy recommendations for economic security and long-term economic development of analyzed national economies.
The main research hypotheses within this study are as follows:
- GDP and GDP per capita in OPEC member states depend mainly on employment in the industrial sector and less depend on employment in services;
- foreign direct investments (FDIs), measured as net balance in current US$ are positively correlated with GDP and GDP per capita indicators;
- an increase in crude oil prices is positively related with GDP and GDP per capita indicators;
- fuel exports as a percentage of all merchandise exports are positively correlated with GDP and GDP per capita indicators;
- life expectancy at birth, as an indirect indicator of health, should positively influence the economic growth indicators;
- fertility rates as total birth per woman should positively add to GDP of OPEC member states and don’t have any significant influence on GDP per capita;
- oil rents as a percentage of GDP do not have a significant impact on GDP and GDP per capita indicators due to oil price fluctuations;
- an increase in energy efficiency of OPEC, measured as GDP per unit of energy use should improve economic growth indicators;
- an increase in the gross capital formation and gross fixed capital formation is positively correlated with GDP and GDP per capita indicators.
The rest of the research is organized as follows. Section 1 reviews the relevant literature on drivers of in OPEC national economies development and provides intuition of oil price influence on the oil-dependent economy. Section 2 presents the methodology and data description. Section 3 discusses empirical estimations. Last section concludes and provides policy implications.
1. LITERATURE REVIEW
The oil shock caused by OPEC oil embargo in 1973 has produced a recession in many countries and promoted studies on the influence of oil shocks on economic growth. The first papers in the field by Pierce and Enzler (1974), Rasche et al. (1977), Mork and Hall (1980), Hamilton (1983) were devoted to the US economy. The paper by Hamilton (1983) states that all US recession (except the recession of 1960) since 1945 was preceded by dramatic oil price increase. Additionally, Hamilton (1983) provides statistics that the crude oil price increase in 1970th led to falling of US GDP from 4% during the period 1960-1972 to 2.4% during the period 1973-1981, within the similar periods the inflation rate was 3.1% and 7.6%, respectively. Later on, Hamilton (2003, 2009) has analyzed not only the influence of oil price increase, but also the transmission mechanisms of oil price reduction.
The similar papers by Darby (1982), Burbidge and Harrison (1984) have extended the research with new methodology using the vector autoregressive models, and the samples were also changed with an emphasis on developed economies. The research paper by Darby (1982) analyzed the influence of oil price fluctuations on employment level, real output, money supply, government expenditures and the ratio of exports to GNP for several developed economies (United States, United Kingdom, Canada, France, Germany, Italy, Japan, the Netherlands). One of the results supported the hypothesis that real oil prices are an inflation driver both in the US and abroad.
Let’s analyze the transmission mechanisms channels of oil price influence on oil-importing and oil-exporting countries. The demand for oil is increasing in the period of national economies expansions, and it is hardly reducing in the periods of economic recession, since oil consumption affects the social sphere and population well-being. The reason that oil consumption is not shrinking during the periods of economic recession is explained by the fact that the population tries to support the average lifestyle of energy consumption, which determines the vital and habitat needs. On the contrary, economic agents may reduce the use of other goods/services (rather than oil consumption) slowing the rates of economic growth.
The oil price fluctuations have a complicated transmission mechanism on real GDP influence for a resource-dependent economy, which include the supply and demand channels. The supply channel is directly related to the production costs, and, in case of oil price increase, the higher price of the final commodity would create the lower demand, and, consequently, supply would also decrease. The demand channel is directly related to consumer disposable income, which is getting smaller in case of oil price increase (Oyeyemi, 2013). There is also an indirect influence of oil price shocks on real GDP performance through the consumption/ investment interactions, and the higher portion of money/budget is spent on consumption (due to the oil price increase), the lower is left for investment. Kilian and Lutz (2008) have found that demand channel of oil prices transmission is more important than it is expected by the contribution of energy costs to total expenditures.
Rotemberg and Woodford (1996) proposed a theory that proves relationships between oil price increase and real wage fall. The empirical (calibrated) estimates suggested that a 10% increase in oil price (innovation) lead to a 1% decline in the real wage. If the domestic economy has a broad openness to international trade with strict oil resource dependence, the oil price shocks would have a significant influence on the current account, inflation, and foreign exchange markets.
The results of the analysis showed the correlation between the price of the natural resources, innovations, and countries economic welfare, including energy security (Vasylyeva et al., 2014). Melnyk and Kubatko (2013) having analyzed the EU experience on economic systems adaptation to resource fluctuations have found that energy price increases are a relevant factor of green industries innovations both through the demand and supply side channels. In this case, Prokopenko et al. (2017), Cebula et al. (2015), Chygryn (2016) proved that the problem of the country’s energy security could be solved through the development of the alternative energy resources. In addition, Lyeonov et al. (2018), Vasylieva et al. (2018) analyzed the macroeconomic stability from the different point of views including ecological indicators (export/ import of natural resources, environmental performance etc.) and also providing the empirical study of the social and economic country’s level (Banioniene, 2017, Sotnyk et al., 2015). Besides, Macerinskiene (2017) showed that the most important factors among others are the price of oil. A financial process, as well as banking system (Kozmenko et al., 2014,2015), level of welfare and employment policies (Lohe, 2017) and institutional quality (Kaasa, 2016), have an essential influence on national economies development.
There are many different scenarios for oil resource dependence on the economy in case of oil price shocks. When the national economy has trade account deficit, then any increase in oil prices would influence real economic sector both in short- and long-run perspective. The short-run perspective is related to the fact that external oil price increase would raise the domestic price level and lead to a depreciation of the local currency. If the oil is a significant contributor to domestic production, then the domestic price level would rise almost equal to the oil price changes, which consequently would lead to higher interest rates, more costly credits and shrinking real economic activities. That is, the real production sector would respond with reduced outputs in the short run. The long-run perspective depends on the ability of the national economy to grow in the condition of instability. In the case of irreversible oil price shock, the prices within the domestic economy would stabilize at some higher level, which would lead to well-being loses. Increase in the price level and the current account deficit would inevitably lead to the depreciation of the local currency. The weak domestic currency could be a positive signal for exporters due to the increased competitiveness of their commodities on the foreign markets. The abovementioned mechanisms would lead to the market equilibrium in the long run.
There would be another situation when the national economy has a trade account surplus. Within a positive trade balance, an increase in oil prices would also influence the real economic sector both in the short and long run perspective, but the consequences would be different. The short-run perspective is related to the fact that external oil price increase would raise the domestic price level, but it wouldn’t necessarily lead to a depreciation of the domestic currency, and significant population well-being losses. The sufficient reserves of foreign currency enable the central bank to make interventions in order to control the exchange market. The long-run perspective is related to the fact that population well-being would increase in case of the fixed exchange rate. Stable domestic currency would increase the purchasing power of domestic consumers relating to import commodities. On the other hand, the competitiveness of local exporters would worsen due to the strong national currency and, as a result, the trade account balance would not have such surplus as it used to be before the oil price shock.
Rotemberg and Woodford (1996) stated that oil price shock itself is not a large contributor to GDP fluctuations and 10% increase in oil price (innovation) leads only to 0.5% decline in private sector output. Moreover, it was found that such innovation is related to GDP 2.5% decline in one year at the minimum. The monetarists, as it seen at Bernanke, Gertler, and Watson (1997), state that it is improper monetary policy to blame for aggregate economic activity slowdown during the period of oil price increase. The authors used vector autoregressions and proved that the tightening of monetary policy is to blame for subsequent recession as a response to oil price increase. The seminal paper by Mork (1989) stated about different GDP response on the same decrease and increased oil price shock. He found an insignificant effect of oil price decrease on the US economy. In any case, the oil price increases, according to the research of Sineviciene et al. (2017) on Eastern Europe post-communist economies, would be a key determinant of energy efficiency improvements.
When one speaks about the oil-exporting country, the situation would be opposed to the re- source-dependent economy and oil price increases would mainly have a positive influence on the domestic economy. In a situation when the national economy had a trade account deficit, any rise in oil prices would improve the current account, and create conditions for possible appreciation of local currency. The long-run perspective for the oil-rich economy, in case of irreversible oil price shock, is population well-being improvements and availability of resources to develop the national economy. Strong domestic currency is a positive signal for importers and investors due to the long-run stability of exchange rates. The similar situation would be when the national economy has trade account surplus, and the domestic economy becomes attractive for foreign investors, as well as national business, to accumulate sufficient amounts of money to develop the national economy.
The empirical paper by Oyeyemi (2013) proves a definite link between oil price shocks, government expenditure and GDP growth of Nigeria. However, the oil price decrease is a factor of instability for the oil-exporting country, and for the Nigerian economy, about 85% of government revenues are due to oil, and 95% of export also belong to oil. The subsequent world oil price decrease in 2014 led to destabilization effects in Nigeria, especially in the balance of payment and government finances.
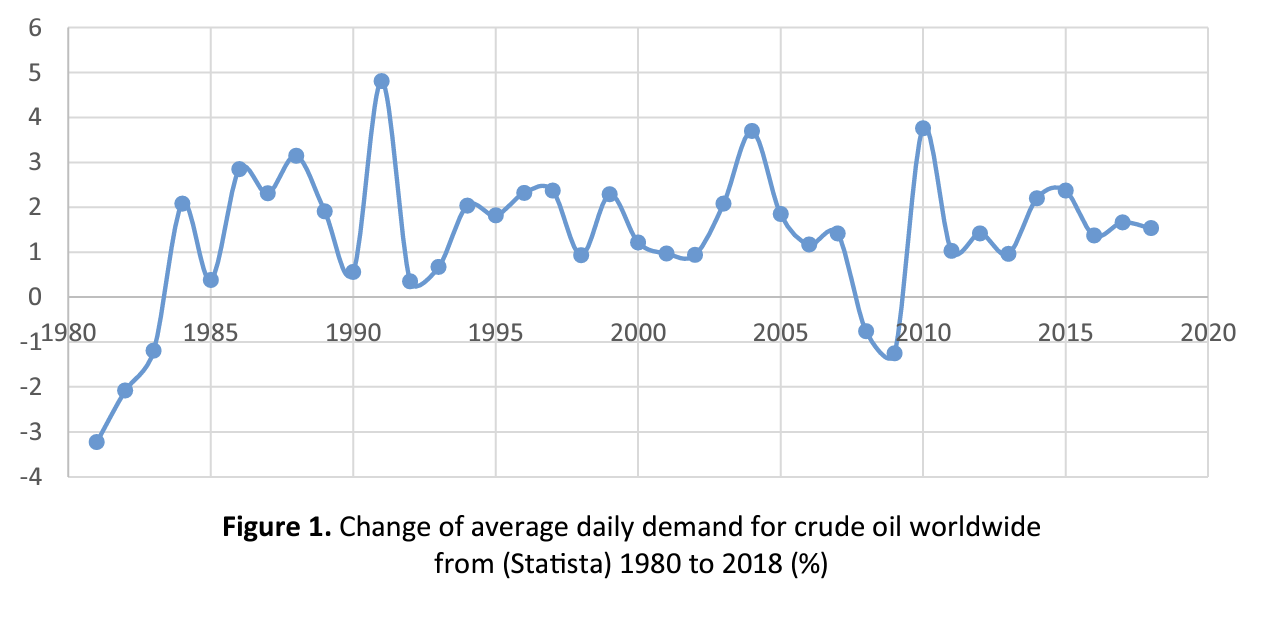
According to Ftiti et al. (2016), the transmission mechanism between oil prices and OPEC countries business cycles appeared to be statistically significant and show causality relationship in the short- and medium-run perspective. The last is explained by the shrinking of consumption in case of oil price cuts and OPEC countries experience a negative impact on the aggregate demand. On the contrary, the overall demand for oil is growing steadily, and the average daily demand for crude oil worldwide is raising about two percent annually from 1980 to 2018 (Figure 1).
The oil-rich economies could be vulnerable to due to business cycle fluctuations. Hamilton (1983) has proved that oil price fluctuation has a significant influence on short-run economic performance in the US. Also in a seminal paper, it was confirmed that correlation between crude oil prices and US GDP is not a statistical coincidence, and within econometric modeling, it was shown that seven out of eight recessions during the period 1945- 1983 were caused by rapid increase in the oil price. The above mentioned correlation between oil prices and economic performance was statistically significant under the 90% level of significance.
That is, for a resource-dependent economy, oil shocks are the sources of economic fluctuations, while for the resource-rich economies, the situation is another way round and world business cycles influence the oil price and, as a result, the well-being of oil-rich economies.
The long-term perspective (starting at the end of 19th century until 2016) between oil prices and GDP for the US economy has been analyzed by Gadea et al. (2016). The main finding of the study was the presence of structural breaks due to the changes in the demand and supply of oil and those breaks were located in 1912, 1941, and 1970. Due to the availability of the data, the last oil break in 1970 has been studied mostly where a strong negative influence of oil price increases on GDP performance has been found. Consequently, since then, vivid arguments are proving the strong sensitivity of GDP to oil price shocks.
According to Torvik (2009), there exist negative relationships between natural resource abundance and economic growth indicators, but it doesn’t imply that the abundance of a resource leads to slower rates of growth. For example, Norway poses both natural resource abundance and leading economic performance. It might be the poor institutional factors (such as corruption, poor property right protecting, bureaucracy, etc.) to blame for little achievements in economic development.
The research of Torvik (2009) determines the critical specifics for resource-abundant countries to succeed. Among the main differences between the succeeding and losing countries are their attitude and placement at saving of resource income; form of country government; institutional factors; type of natural resources; offshore or onshore oil; early versus late industrialization.
The saving behavior of countries, which have escaped the resource curse, is different from the losers, since resource-adjusted savings rates within winning countries are always higher. The form of country government is also essential and Andersen and Aslaksen (2008) found that within a group of democratic countries, the presidential form of government is more inclined to resource curse rather than parliamentarian countries. To explain the difference between presidential and parliamentary, forms Torvik (2009) claims that the presidential form of government is a “one-man show”. In contrast to parliamentary, form, where it is needed to support the confidence and broader representation in society, the resources spending is usually performed on a more productive base. Mehlum and Torvik (2006) claimed that abundance of resources and institutional progress on property rights, corruption and bureaucracy contribute to economic growth, since more investment opportunities are available within the productive environment. Considering the factor of off- shore/onshore oil, the easiness of resource availability doesn’t stimulate the development of supporting industries, while it creates opportunities for violent conflicts to grab part of the oil resources. On the contrary, the offshore oil with challenging conditions stimulates the development of proper technologies. As stated by Torvik (2009), deep sea drilling in Norway promoted the development of related technologies, and currently, this country is one of the world leaders extracting oil with sea depths of about 2,000 meters. That is, challenging conditions to achieve resource abundance become an important factor in economic growth. Considering the element of early/late industrialization, it is the consequences of the event what plays the role. That is, any country to become prosperous needs to develop proper institutes first.
To summarize this section, the arguments were shown that oil price shocks influence the aggregate demand in oil-exporting and oil-importing countries.
2. METHODOLOGY AND DATA
To achieve comparability of results, the period 1990-2014 was chosen, which guarantees the maximum availability and richness of data with regard to the World Bank data set used in the research. This research focuses on identifying the main drivers of economic growth within a panel of 14 OPEC members, considering all member countries within a Founder Members/Full Members status at the beginning of 2018, except Equatorial Guinea (since there are no available data for that country). Moreover, Equatorial Guinea became a Full Member of OPEC only in the mid of 2017. Thus, the corresponding list of countries includes Algeria, Angola, Congo, Ecuador, Gabon, Iraq, Iran, Kuwait, Libya, Nigeria, Qatar, Saudi Arabia, United Arab Emirates, and Venezuela.
The estimation of growth models includes a variety of methods starting from production functions and vector autoregressions to nonparametric modeling and simulations. Ftiti et al. (2016) have proposed an econometric methodology of evolutionary co-spectral analysis in order to differentiate between short-run coincidence and the long- run dynamics. The evolutionary co-spectral analysis proved that oil price fluctuations have both medium- and short-run effects on the economic performance of OPEC countries, while the medium-run effects were significantly larger in comparison to greater than the short-run effects.
The research paper by Umar et al. (2017) using the vector autoregressive model reveals the causality between oil price volatility and economic performance in Nigeria. Thus, it was found that there is a strong relationship between oil price fluctuations and GDP growth in Nigeria. The real gross domestic product was taken as a dependent variable and the main explanatory factors were oil prices, foreign direct investments, total export, trade openness, and human capital. However, there was found no correlation between the variables in the long-run perspective. The long-run performance is explained by improvements in human capital, and it was recommended to allocate budgetary money to the educational sector in order to stimulate economic growth through the human capital improvements. One of the important recommendations done by Umar et al. (2017) is the necessity to maintain the less volatile crude oil world prices to guarantee stable economic growth.
To construct a proper econometric model, it is needed to complete data for each national economy. Therefore, a selection of a presented set of countries is explained by the availability of balanced data. There were several missing values in World Bank data on fuel exports (% of merchandise exports), health expenditure per capita (current US$), energy use (kg of oil equivalent per capita), GDP per unit of energy use (constant 2011 PPP $ per kg of oil equivalent) for Iran, Kuwait, Iraq, which have been filled by average values of the closest previous and next years.
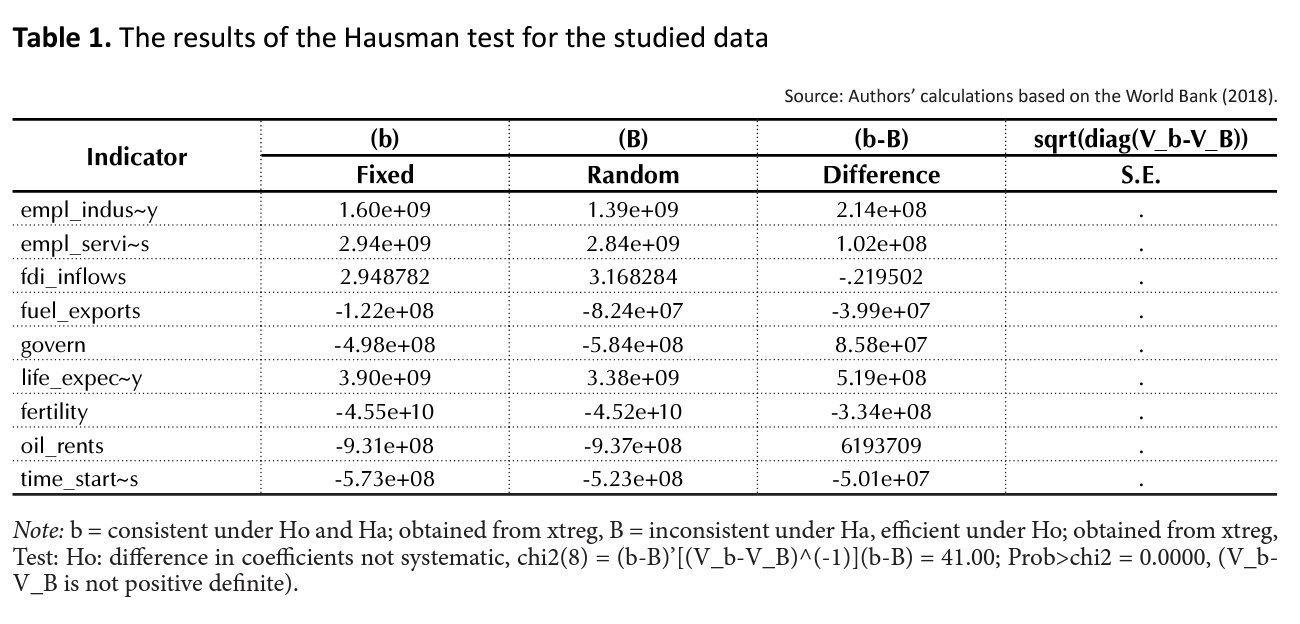
The panel data of national economies could be analyzed with fixed or random effect estimators. Having performed a Hausman test (Hausman, 1978) for model specification, the results were in favor of a fixed effect model. The null hypothesis of random effects was rejected and the alternative hypothesis was accepted. In general, the Hausman specification test estimated the correlation between error terms and repressors in the model and the random effects model foresaw no relationship between the two. The fixed effects enable us to take country-specific characteristics and control for all differences within the specific country.
The results of the Hausman specification test (Table 1) are supporting the fixed effects model. Interpreting the result is direct, since the p-value is less than 0.05, and it is needed to reject the null hypothesis of random effects and use the fixed effects model.
To select key factors for the econometric model, the main drivers of economic performance for oilrich countries in the first section were analysed. Therefore, the indicators of employment in industry, employment in services, exports of goods and services, exports of goods and services, fertility rate, foreign direct investment, fuel exports, GDP per unit of energy use, general government consumption, gross (fixed) capital formation, life expectancy, oil rents, price of crude oil; renewable electricity output, time required to start a business (days) were included in the set of GDP and GDP per capita drivers.
The population variable was not included into the model, since the dependent variable is GDP per capita, and in simple GDP growth model, structural variables of employment were taken (Employment in industry and Employment in services). The incorporation of the employment variable is necessitated by revealing the sectors promoting more to the GDP growth. It is expected that the export of goods and services variable is negatively correlated with economic growth due to the prevalence of fuel exports. Several new variables were added, which are seldom included in the growth models such as fertility rates and GDP per unit of energy use. According to the theory, it is expected that fertility rates positively influence the GDP growth and are negatively correlated with GDP per capita indicators. As for the GDP per unit of energy use, it is expected that progress in energy efficiency would positively influence both GDP and GDP per capita indicators. The authors use several model specifications and differentiate them through the capital variables (Gross capital formation, Gross fixed capital formation). In general, both of them should positively add to economic growth variables.
There are no available data on the institutional progress of OPEC members and, still, from the first section, it is clear that institutional quality is a key driver of resource-abundant economy growth. To address the issue, the instrumental variables of Life expectancy at birth and Time required to start a business were added to estimate the influence of institutional quality. The reason for life expectancy usage is as follows: the better the health care system and social infrastructure, the longer years of life are expected. The “Time required to start a business” variable is positively correlated with institutional quality and directly reflects the level of bureaucracy in the national economy.
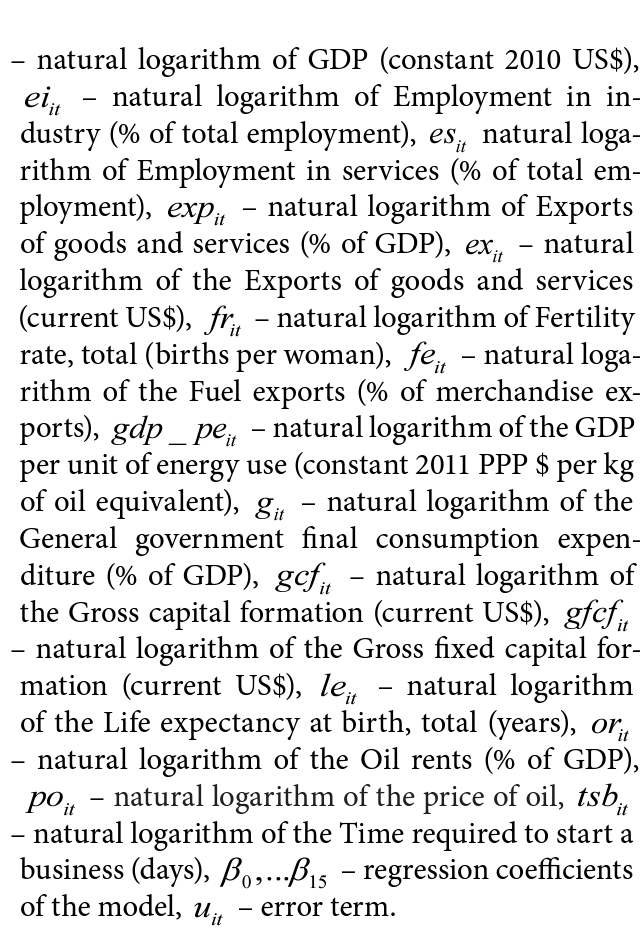
Given the discussion in the first and second sections, an empirical model is built to estimate the influence of different factors on economic performance for a panel of 14 OPEC members, based on the World Bank data (World Bank, 2018), as follows:
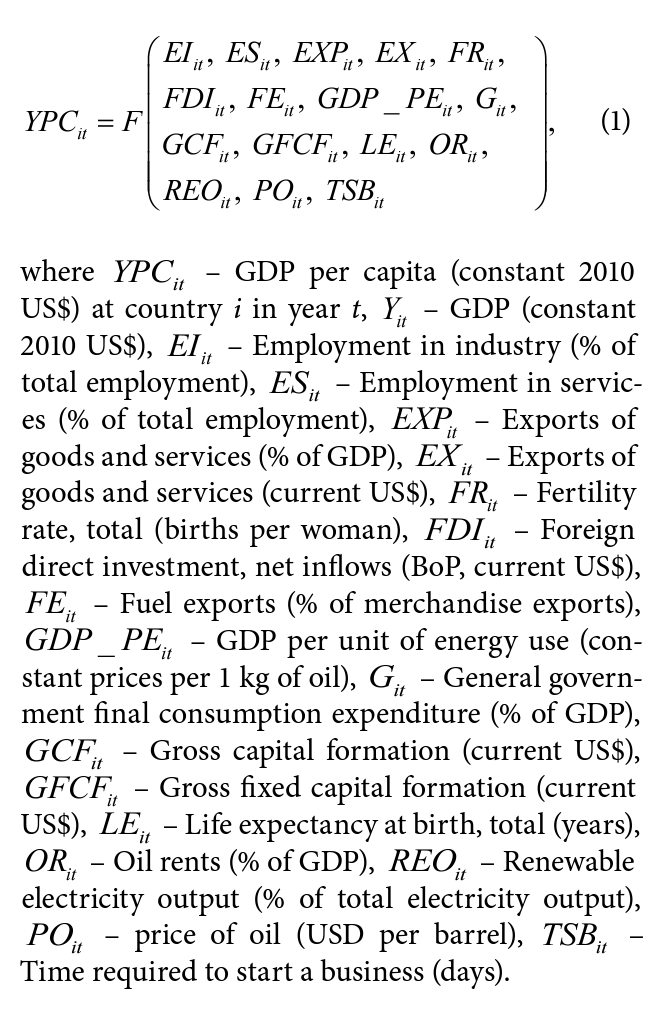
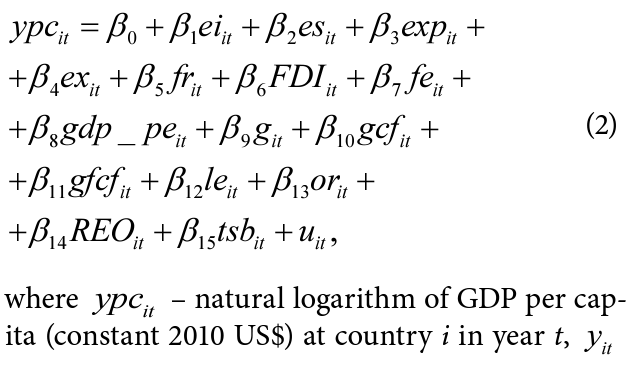
To estimate these links empirically, all variables were transformed into logarithmic values and work with elasticities. All but two variables were transformed into logarithmic values. The data on is the Foreign direct investment have negative values, and for that reason it is left without logarithmic transformation. The same is for Renewable electricity output, since some OECD member has zero percentage of green energy. The log-log function of Equation 1 can be estimated as follows:
To conclude the Methodology part, the World Bank data were described and explanations about OECD members, were provided having justified the period of study. Also, the key parameters to be included in the empirical model have been identified and the use of fixed effects to study panel data for OECD member states was justified. The next part provides empirical results and their discussion.
3. RESEARCH RESULTS
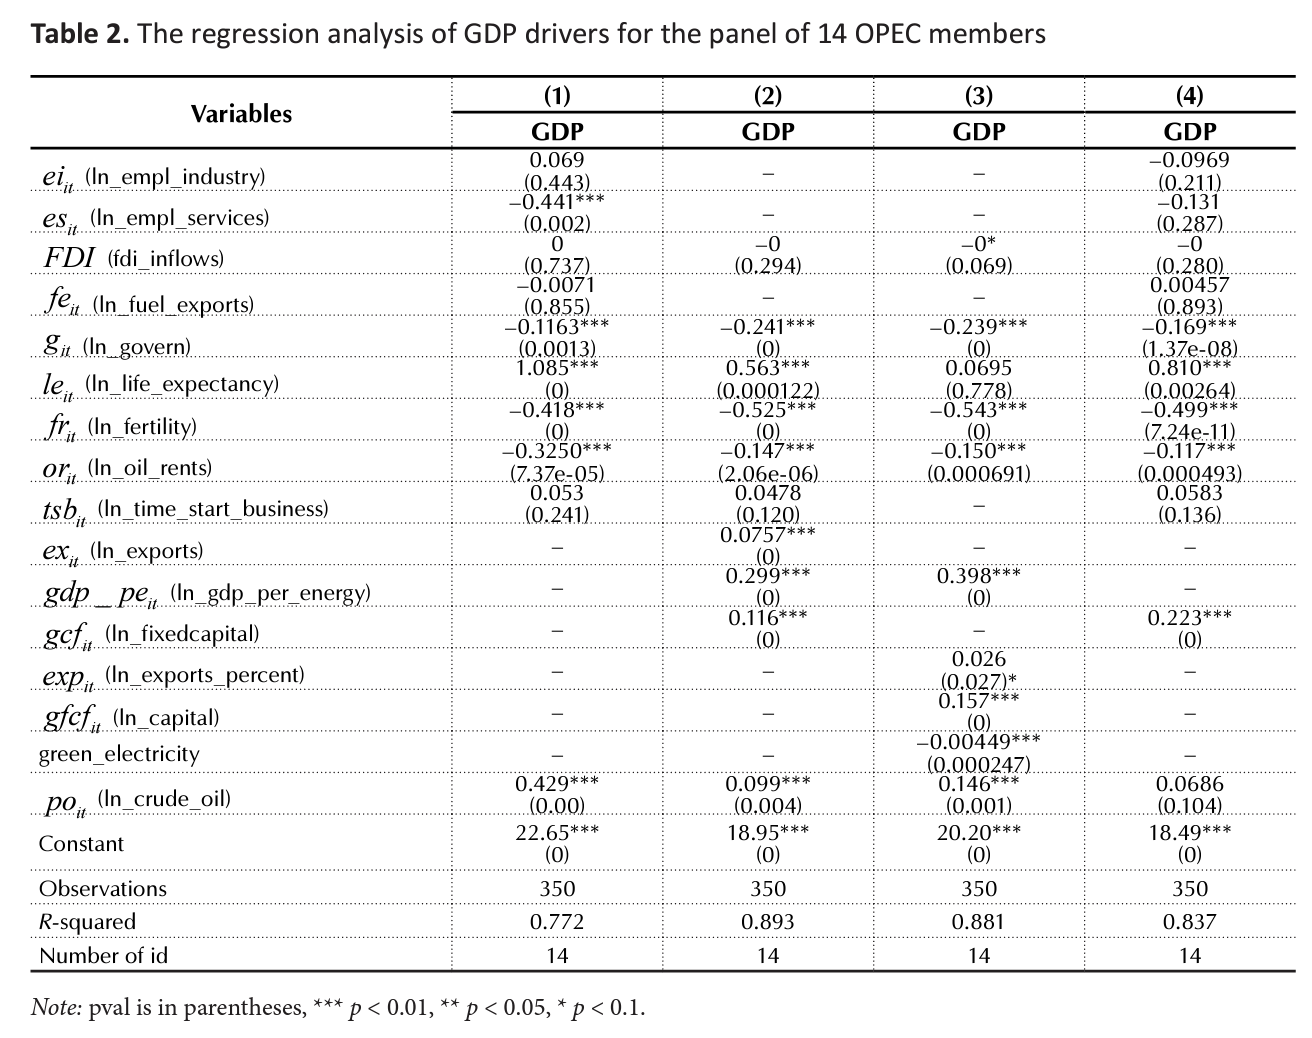
Using the fixed effect model for the analysis of OPEC panel data, the empirical model was built and tested, which indicates GDP and GDP per capita indicators as drivers for the selected countries.
Based on the results presented in Table 2, it is seen that employment in industry and employment in services are insignificant factors of GDP in OPEC members (one of two models suggested a negative influence of employment in services on GDP increase). The foreign direct investment also appeared to be an insignificant factor of OPEC GDP growth from 1990 to 2014.
Fuel exports as % of merchandise exports appeared to be an insignificant indicator and it is not the percentage of fuel at merchandise export, but the absolute volume of oil exported is important. The last is indirectly proved by the positive correlation between Exports of goods and services (current US$) and GDP, and the second model specification suggests that 10% increase in export leads to 0.8% increase at GDP.
General government final consumption expenditure appeared to be restricting factor to GDP growth. One of the policy implications is to consider the directions of government spending in order to receive positive feedback at GDP.
An improvement in life expectancy of 1% leads to 1% growth in GDP. That is, investing in directions related to the improvement of social standards requires the proper institutional environment.
Fertility rates as total (births per woman) are negatively correlated with GDP growth. However, the last does not mean a causality relationship. It could be a situation that wealthier OPEC members are less inclined to have more children. Also, one may consider the de la Croix and Doepke (2003), the paper which states that it is not a fertility rate, but the distribution of fertility, which is important. That is, it is not so important how many children they have overall, it is important who is having children.
Our finding suggests that oil rents increase by 10% leads to the shrinking of GDP by 1%. The policy implication for OPEC members is to develop economic sectors other than extracting industry.
Energy efficiency improvements are positive drivers of GDP values in OPEC and our findings suggest that 10% change at GDP per unit of energy use leads to 3% of GDP itself. Energy saving technologies could be used at larger scales promoting GDP growth.
Investment to Gross capital formation or Gross fixed capital formation (current US$) leads to positive GDP growth. The increase in Gross capital formation by 10% leads on average to 2% increase at GDP in OPEC.
The increase in the price of crude oil, as expected, positively adds to GDP and 10% increase in oil prices is correlated with 0.6-4% GDP improvements. That is, economic gains by OPEC members due to oil price increase are not as significant as it was expected. The last is in line with literature and, with Ghalayini (2011) who underlined that economic growth in oil-exporting countries caused by an increase in oil prices has been always smaller than the corresponding loss of GDP growth rates in oil-importing countries. The last is more likely true for developed countries, where the share of energy costs to total production costs is not big. When one speaks about the global economy, then oil price shocks were always related to sharp world economic slowdown. Ghalayini (2011) assumes that the situation of the global economy is related to the propensity to consume of oil-importing countries, which lose a lot due to high oil prices. But, in fact, there could be a number of hypotheses including the structure of the separate economy, trade policy, and macroeconomic stability.
The analysis of the OPEC GDP per capita drivers in selected counties is presented in Table 3, and, according to the results, the employment in the industry is a positive contributor to GDP per capita in OPEC members. This result could be expected, since OPEC industry is mainly related to servicing the oil sector, and if structurally the OPEC member industrial employment will increase by one percent, the GDP per capita will increase by 0.2 percent.
Employment in services variable is statistically significant and negatively correlated with GDP per capita, since if structurally the OPEC member employment in services will increase by one percent, the GDP per capita will decrease by 0.3-0.4 percent. Foreign direct investment, time to start a business, as well as fuel exports (as % of merchandise) do not have any influence of on GDP per capita.
General government final consumption expenditure appeared to be a restricting factor to GDP per capita, and 10 percent increase in government expenditures lead to 1 percent decrease in GDP per capita.
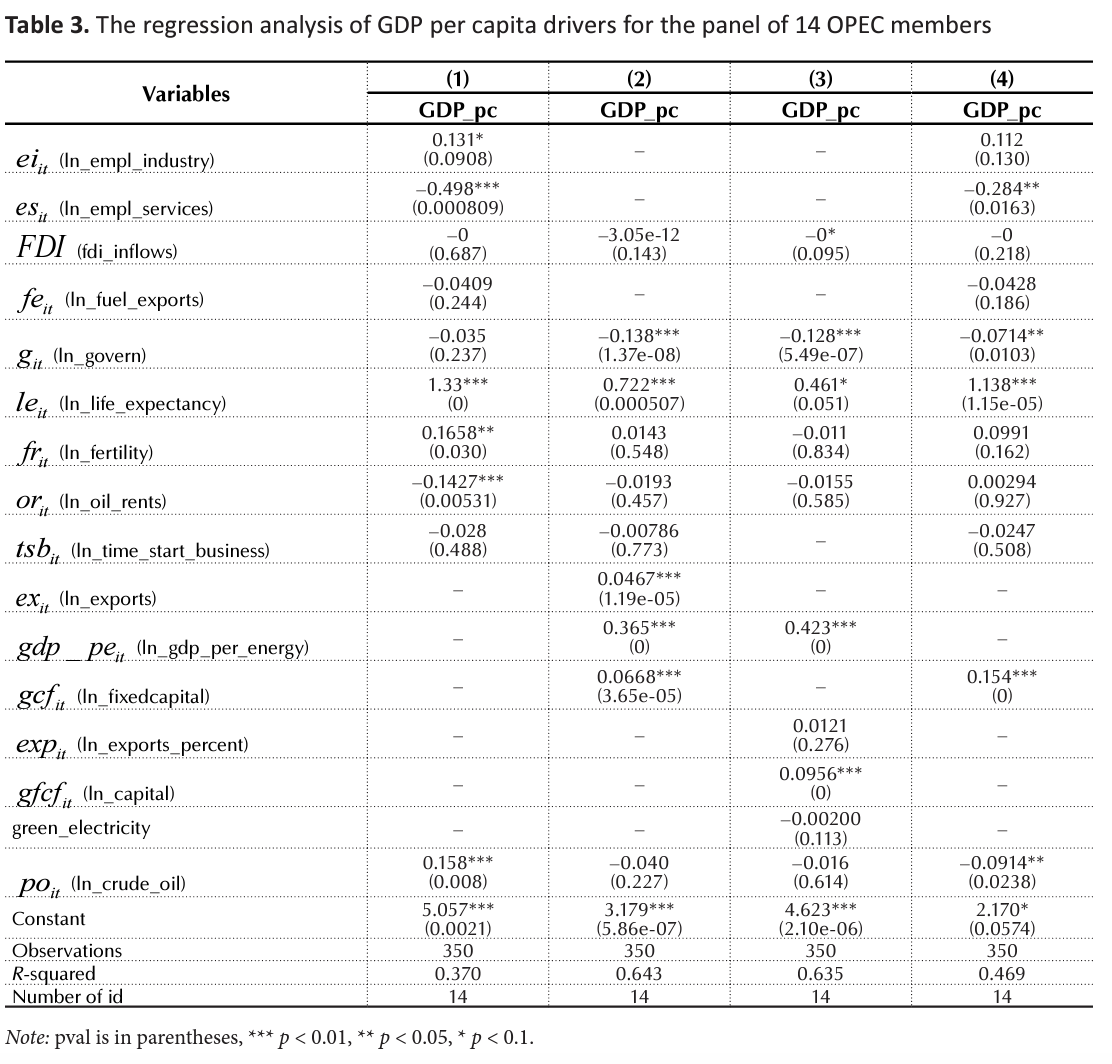
An improvement in life expectancy by one percent leads on average to 0.5-1.33% growth in GDP per capita. That is, investing in human capital in OPEC countries could be a key policy direction for economic development.
There is no significant influence of fertility rate as total (births per woman) on GDP per capita. One out of four specifications suggests that changes in GDP structure in favor of oil rents by 10% lead to the shrinking of GDP by 1%, the remaining models were statistically insignificant.
Exports of goods and services (current US$) is positively correlated with GDP per capita, and the second model specification suggests that 10% increase in export lead to 0.4% increase at GDP per capita. Energy efficiency improvements are again positive contributors to GDP capita values at OPEC, and our findings suggest that 10% change at GDP per unit of energy use leads to 4% at GDP per capita. An up increase in gross capital formation or gross fixed capital formation (current US$) on 10% leads to 1.5 increase in GDP per capita in OPEC. The logarithm of oil prices suggests a mixed correlation with GDP per capita in OPEC; the last could be due to model specification issues. Only one out of four models supported the positive influence of oil prices increase on GDP per capita, and 10% increase in crude oil prices leads up to 1.6% increase of GDP per capita. The separate correlation between the two variables appeared statistically significant and 10% increase in crude oil prices lead up to 1.5% increase in GDP per capita in OPEC.
CONCLUSION
This research complements the existing papers showing the oil-economic growth correlation within a panel 14 OPEC member countries during the period 1990-2014. The corresponding list of countries includes Algeria, Angola, Congo, Ecuador, Gabon, Iraq, Iran, Kuwait, Libya, Nigeria, Qatar, Saudi Arabia, United Arab Emirates, and Venezuela.
Our expectations about foreign direct investment (FDI) and their positive correlation with GDP and GDP per capita indicators for OPEC countries were not supported. Structural changes in employment in favor of service sector are negatively correlated with GDP per capita, since if structurally the OPEC member employment in services will increase by one percent, the GDP per capita will decrease by 0.3-0.4 percent. The last could suggest wasting oil money on “not-needed” services.
The research supports the hypothesis that an increase in crude oil prices is positively related with GDP and 10% increase in oil prices is correlated with 0.6-4% GDP improvements. That is, economic gains by OPEC members due to oil price increase are not as significant as it was expected. As for the oil prices and GDP per capita, only one model supported positive influence of oil prices increase on GDP per capita, and 10% increase in crude oil prices leads up to 1.6% increase of GDP per capita.
It was found that an increase in exports of goods and services by 10% leads to 0.8% increase at GDP.
Life expectancy at birth, as an indirect indicator of health, has a positive influence on economic growth indicators, and an improvement in life expectancy by 1 percent leads on average to 1% growth in GDP and to 0.5-1.33% growth in GDP per capita. That is, investing in human capital in OPEC countries could be a key policy direction for economic development.
There was found a negative influence of fertility rate GDP and its insignificant influence on GDP per capita. In addition, changes in GDP structure in favor of oil rents by 10% lead to the shrinking of GDP by 1%.
Energy efficiency improvements are positive drivers of GDP values in OPEC and our findings suggest that 10% change at GDP per unit of energy use leads to 3% change of GDP itself.
Investment in the gross capital formation or gross fixed capital formation (current US$) leads to positive GDP growth. The increase in gross capital formation by 10% leads on average to 2% increase of GDP in OPEC. Also, the research proves that OPEC GDP is a more sensitive indicator in OPEC members in comparison to GDP per capita.
The empirical results prove the necessity for the oil-exporting country to invest accumulated during the period of high crude oil prices funds to agriculture, manufacturing, finances and other directions to diversify national economy structures and overcome the dependence of the economy on oil-exporting sector.
ACKNOWLEDGMENT
This research was funded by the grant from the Ministry of Education and Science of Ukraine No g/r 0117U003935.
REFERENCES
- Andersen, J. J., & Aslaksen, S. (2008). Constitutions and the resource curse. Journal of Development Economics, 87(2), 227-246.
- Banioniene, J., & Dagiliene, L. (2017). Opportunities to Catch Up Advanced Countries by Investing in Technologies. Montenegrin Journal of Economics, 13(1), 111-123.
- Bernanke, Ben S., Mark Gertler, & Mark Watson (1997). Systematic Monetary Policy and the Effects of Oil Price Shocks. Brookings Papers on Economics Activity, 28(1), 91-157.
- Burbidge, J., & Harrison, A. (1984). Testing for the Effects of Oil-Price Rises Using Vector Autoregression. International Economic Review, 25(2), 459-484.
- Cebula, J., & Pimonenko, T. (2015). Comparison financing conditions of the development biogas sector in Poland and Ukraine. International Journal of Ecology and Development, 30(2), 20-30.
- Chygryn, O. (2016). The mechanism of the resource-saving activity at joint stock companies: the theory and implementation features. International Journal of Ecology & Development, 31(3), 42-59.
- Cohe, E. (2017). Effect of Welfare and Employment Policies on the Correlation between Migration and Unemployment. Economics and sociology, 10(1), 246-264.
- Darby, M. R. (1982). The price of Oil and World Inflation and Recessions. American Economic Review, 72(4), 738-751.
- de la Croix, D., & Doepke, M. (2003). Inequality and growth: Why differential fertility matters. American Economic Review, 93(4), 1091-1113.
- Ftiti, Z., Guesmi, K., Teulon, F., & Chouachi, S. (2016). Relationship between crude oil prices and economic growth in selected OPEC countries. The Journal of Applied Business Research, 32(1), 11-22.
- Gadea, M. D., Gómez-Loscos, A., & Montañés, A. (2016). Oil price and economic growth: A long story? Econometrics, 4(4), 41.
- Ghalayini, L. (2011). The Interaction between Oil Price and Economic Growth. Middle Eastern Finance and Economics, 13, 127-141.
- Hamilton, J. (1983). Oil and the Macroeconomy since World War II. Journal of Political Economy, 91(2), 228-248.
- Hamilton, J. (2003). What is an Oil Shock? Journal of Econometrics, 113(2), 363-398.
- Hamilton, J. (2009). Understanding crude oil prices. The Energy Journal, 30(2), 179-206.
- Hausman, J. A. (1978). Specification tests in econometrics. Econometrica, 46, 1251-1271.
- Kaasa, A. (2016). Social capital, institutional quality and productivity: evidence from European regions. Economics and sociology, 9(4), 11-26.
- Kilian, Lutz. (2008). The Economic Effects of Energy Price Shocks. Journal of Economic Literature, 46(4), 871-909.
- Kozmenko, S., & Belova, I. (2015). Peculiarities of identification of systemically important banks and assessment of their impact of the occurrence of economic crisis. Banks and Bank Systems, 10(3), 39-48.
- Kozmenko, S., & Korneev, M. (2014). Periodization of financialization process of economics: Domestic and foreign contexts. Economic Annals- XXI, 9, 73-76.
- Lyeonov, S. V., Vasylieva, T. A., & Lyulyov, O. V. (2018). Macroeconomic stability evaluation in countries of lower-middle income economies. Scientific Bulletin of National Mining University, 138- 146.
- Macerinskiene, I., & Kremer, I. (2017). Assessment of Lithuanian Energy Sector Influence on GDP. Montenegrin Journal of Economics, 13(4), 43-59.
- Mehlum, H., & Torvik, R. (2006). Institutions and the Resource Curse. The Economic Journal, 116, 1-20.
- Melnyk, L. G., & Kubatko, O. (2013). The EU experience for economic systems adaptation to resource fluctuations through green industries innovations. Actual Problems of Economics, 150(12), 36-42.
- Mork, K. A. (1989). Oil and the Macroeconomy when Prices Go Up and Down: An Extension of Hamilton’s Results. Journal of Political Economy, 97(3), 740-744.
- Mork, Knut Anton, & Robert E. Hall (1980). Energy Prices, Inflation, and Recession, 1974–1975. The Energy Journal, 1(3), 31-64.
- Oyeyemi, A. M. (2013). The Growth Implications of Oil Price Shock in Nigeria. Journal of Emerging Trends in Economics and Management Sciences, 4(3), 343- 349.
- Pierce, James L., & Jared, J. Enzler (1974). The Effects of External Inflationary Shocks. Brookings Papers on Economic Activity, 1, 13-62.
- Prokopenko, O., et. al. (2017). Wind energy in Israel, Poland and Ukraine: Features and opportunities. International Journal of Ecology and Development, 32(1), 98-107.
- Rasche, R. H., & Tatom, J. A. (1977). The Effects of the New Energy Regime on Economic Capacity, Production and Prices. Economic Review, Federal Reserve Bank of St. Louis, 59(4), 2-12.
- Rotemberg, J., & Woodford, M. (1996). Imperfect Competition and the Effects of Energy Price Increases on Economic Activity. Journal of Money, Credit and Banking, 28(4), 549-577.
- Sineviciene, L., et. al. (2017). Determinants of energy efficiency and energy consumption of Eastern Europe post-communist economies. Energy & Environment, 28(8), 870-884.
- Sotnyk, I. M., Dehtyarova, I. B., Kovalenko, Y. V. (2015). Current threats to energy and resource efficient development of Ukrainian economy. Actual Problems of Economics, 173(11), 137-145.
- The World Bank (2018). World Development Indicators database.
- Torvik, R. (2009). Why do some resource-abundant countries succeed while others do not? Oxford Review of Economic Policy, 25(2), 241-256.
- Umar, M. G., Aliyu, B., & Ahmad, M. (2017). Oil price fluctuations and economic growth in Nigeria (Evidence from Granger causality test). Australasian Journal of Social Science, 3(1), 1-16.
- Vasylieva, T., Lyeonov, S., Lyulyov, O., & Kyrychenko, K. (2018). Macroeconomic stability and its impact on the economic growth of the country. Montenegrin Journal of Economics, 14(1), 159-170.
- Vasylyeva, T. A., & Pryymenko, S. A. (2014). Environmental economic assessment of energy resources in the context of Ukraine’s energy security. Actual Problems of Economics, 160(1), 252-260.
Related Articles
Sergiev P.V.
Dontsova O.A.
Berezkin G.V.
Chuan Chen