This article is published under a Creative Commons license and not by the author of the article. So if you find any inaccuracies, you can correct them by updating the article.

The association between preservice elementary teacher animal attitude and likelihood of animal incorporation in future science curriculum


Ron Wagler
Published: July 10, 2010
Latest article update: Jan. 3, 2023
This article is published under the license


Abstract
The purpose of this study was to assess the association between United States K-4 preservice teacher‟s attitudes toward specific animals and the likelihood that the preservice elementary teachers would incorporate these specific animals in their future science curriculum. A strong statistically significant association was found between the preservice elementary teacher‟s attitudes towards a specific animal and their likelihood to include or exclude that animal from their future science curriculum. Specifically, if a preservice elementary teacher had a positive attitude toward an animal they were much more likely to believe they would use that animal in their future science curriculum. Conversely, if a preservice elementary teacher had a negative attitude toward an animal they were much more likely to believe they would not use that animal in their future science curriculum. These findings have direct implications on the preservice teachers‟ future student‟s success in biological science courses and the preparation of preservice elementary teachers.
Keywords
Attitude, curriculum, animal, student learning, preservice elementary teacher preparation
Introduction
The human developmental stage from kindergarten to fourth grade (i.e., approximately (~) 5 to 10 years of age) is a period of extraordinary cognitive development. It is also a crucial window for instilling the foundational scientific knowledge students need to fully comprehend the ever increasingly complex scientific concepts they will encounter in their future science courses (American Association for the Advancement of Science [AAAS], 1993; National Research Council [NRC], 1996, 2000; North American Association for Environmental Education [NAAEE], 2004). One part of this foundational scientific knowledge is student exposure to biodiverse groups of animals in their kindergarten through fourth grade (K-4) science classes (NAAEE, 2004, p. 18; NRC, 1996, p. 128; AAAS, 1993, p. 102-103).
Because of the interdependent relationship between this foundational scientific knowledge and the future comprehension of complex scientific concepts associated with these animals it is essential that teachers provide their K-4 students with a science curriculum that includes a representative sample of animals from across the animal kingdom. The purpose of this study was to assess the association between United States (U.S.) K-4 preservice teacher's attitudes toward specific animals and the likelihood that the preservice elementary teachers would incorporate these specific animals into their future science curriculum.
Theoretical Underpinnings
Eagly and Chaiken (1993) define human attitude as a "psychological tendency that is expressed by evaluating a particular entity with some degree of favor or disfavor’ (p. 1) and human belief as an estimate of the likelihood that the knowledge one has about a entity is correct or, alternatively, that an event or a state of affairs has or will occur (Eagly & Chaiken, 1998). The past beliefs (A) humans possess concerning whether a particular entity, such as an object, has undesirable or desirable attributes directs humans to form a general attitude (B) toward the specific object (Figure 1).
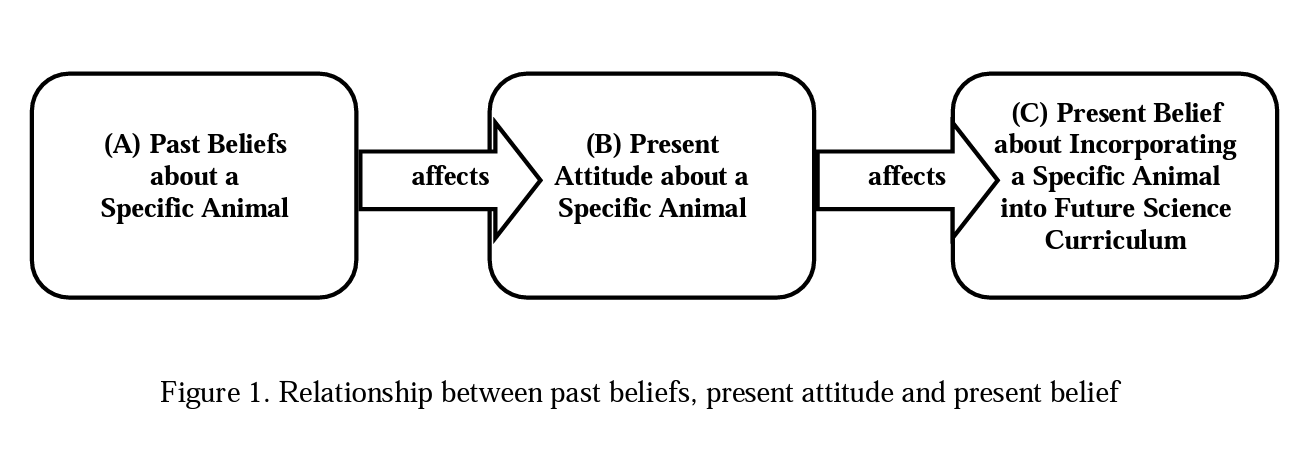
Human attitudes can, in turn, affect beliefs (C) associated with that object (Kruglanski & Stroebe, 2005; Marsh & Wallace, 2005). The mechanisms by which beliefs influence attitudes and attitudes influence beliefs is based on the way attitudes and beliefs are cognitively organized (Osgood & Tannenbaum, 1955; Rosenberg, 1960; Albarracin, Johnson, & Zanna, 2005), perceptually organized (Heider, 1958; Albarracin et al., 2005) and the outcomes of judgmental processes (Sherif, Sherif, & Nebergall, 1965; Albarracin et al., 2005).
Literature Review
Attitudes of Preservice Elementary Teachers
Science education research associated with attitudes of preservice elementary teachers is limited and diverse. Piper and Hough (1979) found preservice elementary teacher's attitudes toward science were different depending on if they were enrolled in an inquiry-based physics course or an expository physics course. They concluded that the design of the course effected preservice elementary teacher's attitudes toward science. Preservice elementary teacher's attitude toward science teaching was found to change in a positive direction and continued in subsequent teacher training courses after a two course sequence of earth science/biology and physical science (Westerback, 1982). Pedersen and McCurdy (1992) assessed the impact of a science methods course on preservice elementary teacher's attitudes toward teaching science. The results of their study indicated a statically significant positive change in attitude that was not found to be statically different for high and low science achievers.
Wenner (1993) examined preservice elementary teacher's science background knowledge and attitudes toward teaching science. A negative statistical relationship between preservice elementary teacher attitude toward teaching science and science knowledge was found. Syh-Jong (2007) assessed secondary preservice science teachers "construction of science knowledge through talk and writing activities performed in a collaborative learning group" (Syh-Jong, 2007, p. 65). Results indicated that the secondary preservice science teacher's attitudes "towards learning became active and open-minded in the teaching-learning process." (p. 76). Weinburgh (2007) found that preservice elementary teachers, after a nine week investigation on life cycles using mealworms, had improved attitudes about mealworms. It should be noted that no published peer reviewed research exists on the attitudes of preservice or inservice teachers towards specific animals and/or the likelihood of incorporating specific animals into their future science curriculum or their science curriculum.
Beliefs of Preservice Elementary Teachers
The vast majority of recent science education research associated with beliefs of preservice elementary teacher is specific to teacher efficacy beliefs. Teacher efficacy has been defined as a teacher's "belief in their ability to have a positive effect on student learning" (Ashton, 1985, p. 142). In the content of preservice elementary science teaching efficacy, the Science Teaching Efficacy Belief Instrument-В (STEBI-B) (Enochs & Riggs, 1990) is the main instruments used to measure teacher efficacy beliefs. The STEBI-B measures two underlying uncorrelated factors of preservice teacher efficacy, personal science teaching efficacy (PSTE) and science teaching outcome expectancy (STOE). PSTE measures a preservice teachers' belief in their ability to perform a given behavior and STOE measures a preservice teachers' belief that effective teaching can result in student learning.
Schoon's and Boone's (1998) work with preservice elementary teachers using the STEBI-B (Enochs & Riggs, 1990) has shown there is an association between elementary teachers' low science teaching efficacy beliefs and alternative science concepts. The study found that holding certain alternative concepts about science such as planets can only be seen with a telescope, dinosaurs lived the same time as cave-men, and that north is toward the top of a map of Antarctica were correlated to preservice elementary teachers with low science teaching efficacy beliefs. The study also found that preservice elementary teachers that held fewer numbers of alternative concepts had significantly higher science teaching efficacy belief levels (Schoon & Boone, 1998).
King and Wiseman (2001) conducted a study with the purpose of examining differences in science teaching efficacy beliefs among students enrolled in two versions of a methods course in an elementary science teaching program. One group of preservice elementary teachers was enrolled in a semester long interdisciplinary methods class and another group of preservice elementary teachers was enrolled in a semester long more "traditional" non-interdisciplinary methods class. Both groups were given the STEBI-B after the methods class. When the results of the STEBI-B were compared between both groups, neither PSTE nor STOE beliefs were found to be significantly different. They concluded their study by stating that if the role of integrated instruction in the elementary curriculum is considered, "the findings of their study suggest that teaching in an integrated fashion and planning interdisciplinary units would seem to be no more effective than traditional teaching in terms of developing the science teaching efficacy of the students" (King & Wiseman, 2001, p. 149).
There are also data to suggest that the number of high school science subjects studied can have a long term effect on the science efficacy beliefs of preservice elementary teachers. Mulholland, Dorman and Odgers (2004) used the STEBI-B to assess the science teaching efficacy beliefs of 314 elementary preservice teachers. They found that the preservice elementary
teachers' PSTE belief scores were positively related to the number of science subjects studied at the high school level but not to their STOE belief scores. Completing two science teaching classes with the preservice elementary teacher training program also had a significant positive effect on the PSTE beliefs but not on the STOE beliefs of the preservice elementary teachers.
Cakiroglu, Cakiroglu, and Boone (2005) compared science teaching efficacy belief levels of preservice elementary teachers at a large U. S. university and a large Turkey university. The STEBI-B was used to assess the university student's level of science teaching efficacy. The preservice elementary teachers from both the U.S. and Turkey had generally positive levels of PSTE and STOE beliefs. The U.S. preservice elementary teachers reported higher levels of PSTE beliefs than the Turkey preservice elementary teachers.
Utley, Moseley and Bryant (2005) explored the impact an elementary methods course and elementary student teaching had on both science and mathematics preservice teacher efficacy beliefs. Their study, which used both the STEBI-B and the Mathematics Teacher Efficacy Beliefs Instrument (MTEBI) (Huinker & Enochs, 1995), found both a positive and negative relationship between science and mathematics teaching efficacy beliefs in their sample population of elementary preservice teachers. Specifically, as the preservice elementary teachers progressed in their methods courses their mathematics and science teacher efficacy beliefs also increased significantly. Both science and mathematics efficacy beliefs showed a slight decrease after student teaching. In a related study, Moseley and Utley (2006) found that preservice elementary teachers' mathematics and science teaching efficacy beliefs were impacted by an earth systems science course that incorporated both mathematics and science content. Science teaching efficacy beliefs, science teaching outcome expectancy beliefs and personal mathematics teaching efficacy beliefs increased over the semester for students enrolled in this course. Students not enrolled in the course did not experience this increase.
Palmer (2006) conducted a study with preservice primary teachers to see if their science teaching efficacy beliefs changed over time. The STEBI-B was used. It was found that the preservice primary teacher's science teaching efficacy beliefs increased from the beginning of a science methods course to the end of a science methods course. The STEBI-B was administered nine months after the end of the science methods course and the efficacy increase experienced during the science methods course was still present.
The relationship between preservice elementary science teacher's epistemological beliefs, epistemological world views and science teaching efficacy beliefs (using the STEBI-B) was investigated in preservice elementary teachers in Turkey (Yilmaz-Tuzun & Topen, 2008). The results of the study indicated that in Turkish culture, preservice elementary science teacher's epistemological beliefs support the multidimensional theory and not the unidimensional theory of epistemological beliefs. It was also found that when preservice elementary science teachers want to teach science using a student centered approach they tend to believe they would only be successful if the students they were instructing memorized the science facts and science concepts being taught (Yilmaz-Tuzun, & Topen, 2008).
In conclusion, science education research associated with the attitudes of preservice elementary teachers is limited and diverse. The vast majority of recent science education research associated with the beliefs of preservice elementary teacher is specific to teacher efficacy beliefs. No published peer-reviewed research exists on the attitudes of preservice or inservice teachers towards specific animals and/or the likelihood of incorporating specific animals into their future science curriculum or their science curriculum. This study provides the first empirical evidence in this area.
Methodology
Research Questions
The research questions that were investigated for the study were:
- Research Question 1: What are U.S. K-4 preservice elementary teacher's attitudes toward specific animals?
- Research Question 2: What is the likelihood of U.S. K-4 preservice elementary teachers incorporating specific animals into their future science curriculum?
- Research Question 3: Does a statistically significant association exist between the U.S. K-4 preservice elementary teacher's attitudes toward specific animals and likelihood of incorporating these specific animals into their future science curriculum?
Study Participants
The participants for the study consisted of 184 K-4 preservice elementary teachers enrolled in the last semester (i.e., 16 weeks) of their degree program at a U.S. midsized urban southwestern U.S. border region university with a predominantly Hispanic/Uatino population. Of the 184 participants 173 were female and 11 were male; mean age: 27.44, median age: 24, mode age: 23; 150 Hispanic/Uatino, 21 White, 8 Black, 3 Asian/Pacific Islander and 2 Arab. All were participating in the last semester of their senior level (i.e., fourth year) university public school teaching internship and were simultaneously enrolled in two university education courses. The participants of the study did not choose what sections of their senior level university education courses they were enrolled in. They were placed in sections based on the proximity of their home location to the public school they interned in. For the purposes of data collection all senior level university education course sections were randomized through the use of a true random number generator (TRNG) that generated true random numbers based on the earth's random atmospheric noise. Based on the outcome of these random numbers, a random selection of sections was chosen to gather data from. Clustered sampling was utilized where the primary sampling units were sections and the secondary sampling units were participants (Uohr, 1999).
Data Collection Procedure
The participants of the study were shown thirty pictures of animals (Table 2) during one of their senior level education courses using a Microsoft PowerPoint presentation. Each animal was presented on a single PowerPoint slide. All data was collected at the end of the semester before graduation. For each picture the participants were first asked to rate their attitude (Eikert scale: Extremely Negative [1], Negative [2], Neutral [3], Positive [4], Extremely Positive [5]) toward the animal shown by circling their response on the data collection sheet. The participants were then asked to write one word on the data collection sheet that completely summed up their attitude toward the animal shown (Table 5 and 6). Finally, the participants were asked to rate the likelihood, based on their attitude (Likert scale: Extremely Unlikely [1], Unlikely [2], Likely [3], Extremely Likely [4]), of incorporating the animal shown into their future science classroom curriculum. It was explained to the students that the "incorporation of the animal shown" could take any form that referenced the animal. Examples were given that included bringing or allow
ing the actual animal into the classroom, developing or using a science activity that utilized the animal, reading a classroom story that discussed the animal, showing a video with the animal present in the video, having a picture of the animal in the classroom, having the students write a paragraph or draw pictures that incorporated the animal or any other type of media that addressed the animal in any way. It was further clarified to the participants that these were some examples and that they may be thinking of other examples of incorporating the animal into their future science classroom curriculum and that any of these "ways of incorporating'’ would apply to rating the likelihood of incorporating the animal shown into their future science classroom curriculum. This clarification was based on participants confusion during pilot studies that demonstrated some of the participants believed the only "way to incorporating the animal” was to actually bring the animal into their classroom. This obviously creates issues with classroom safety and the classroom's door dimensions when shown a picture of an adult bear, an adult lion or an adult elephant.
Selection of Animal Pictures
The selection of the animal pictures used in the study occurred in multiple phases. Initially, during the first pilot study, a representative sample from all of the classes comprising the kingdom Animalia was to be shown to the preservice elementary teachers. This effort produced such a large number of animal pictures it was apparent that the data collection procedure would be too time intensive and the preservice elementary teachers would suffer from fatigue. Based on these findings it was decided that the number of animal pictures should not exceed thirty and the criteria for inclusion should be more focused.
The category criteria for including an animal picture consisted of:
- Category 1: Examples of animals children find and want to bring into their classroom (e.g., caterpillar, spider, crayfish, frog, grasshopper, snake, fish, turtle, etc.). Based on the researchers observations these animals are usually found in higher abundance in the environment and are easier for student to catch and transport to the classroom.
- Category 2: Examples of terrarium and aquarium animals that are commonly purchased by U.S. science teachers and/or are found in elementary (i.e., ~ 5 to 10 years of age), middle (i.e., ~ 10 to 15 years of age) and secondary classrooms (i.e., ~ 15 to 18 years of age) (e.g., Madagascar hissing cockroach (MH), iguana, goldfish, caterpillar, butterfly, spider, snake, frog, rabbit, etc.). Based on the researchers observations these animals tend to be available in U. S. science teacher supply catalogs/websites and the U.S. pet trade.
- Category 3: Examples of both invertebrate and vertebrate animals. All thirty animal pictures presented were part of this category.
- Category 4: Representative examples of animals that would occur at most trophic levels in a food chain and food web (e.g., earthworm->mouse->snake->hawk; cock- roach->spider->frog->bird->fox;coral->fish->fish->seal;sponge->mollusk->starfish->b ird; etc.). All thirty animal pictures presented were part of this category.
- Category 5: Examples of animal groups that have a tendency to appear in a "traditional” U. S. secondary biology textbook. These groups present a way for students to ex
plore animal biodiversity, animal evolution, common ancestry and other related topics. The groups are traditionally presented based upon specific evolutionary innovations. Two examples of these evolutionary innovations are the Porifera's (sponge) multicellu- larity («550 Mya) and the more recent evolutionary innovation of hair associated with the first mammals («220 Mya) (Johnson, 2003). The groups are sponges, corals, worms, mollusks, arthropods (insects, crustaceans, and arachnids), echinoderms, fish, amphibians, reptiles (snake, lizard and turtle), birds and specific groups of terrestrial and aquatic mammals. It should be noted that some biology textbooks include or exclude other animal groups. By focusing on these groups «550 million years of animal evolution can be discovered. All thirty animal pictures presented were part of this category. - Category 6: Examples of animals that have been "traditionally'’ studied and/or dissected in U. S. secondary biology courses (e.g., sponge, clam, starfish, earth worm, crayfish, grasshopper, freshwater perch and frog).
After the six categories were established a second pilot study was conducted where participants viewed different species of animals, within an animal group, to assess if different specific species invoked different attitudes and different levels of likelihood of incorporation. For example, pictures of different species of primates (one of the groups of mammals) were shown, as were different species of insects, different species of worms, different species of snakes, different species of birds, different species of fish, etc. The only animal groups that were found to be statistically different were birds, fish and insects. These groups tended to show greater variability depending on what animal from this group was shown. Because of this within-group variability differences, multiple animals were included in these three groups. Two examples of birds were shown (sparrow and red-tailed hawk), two examples of fish were shown (goldfish and freshwater perch) and three examples of insects were shown (MHC, grasshopper and monarch caterpillar/butterfly). The monarch caterpillar/butterfly was chosen to assess if different attitudes and curriculum incorporation rates existed for the same animal at different metamorphic stages.
Based on the six categories and the results of the pilot studies thirty animal pictures were chosen with most animals fitting into multiple categories (Table 8). For example, the monarch butterfly fits into category 1, 2, 3, 4, and 5 while the lion fits into categories 3, 4 and 5. The final thirty animals chosen represent an extremely biodiverse group of animals across many trophic levels. They also include the animals that have the highest probability of students being exposed to, in some capacity, while in elementary, middle and secondary school in the U. S. Because the pictures were the same size, smaller animals (e.g., MHC) (Figure 2) appeared bigger and bigger animals appeared smaller (e.g., Elephant) than they actually were. This is a limitation of the study when using pictures instead of using the actual animals. All of the animal pictures presented were in color, were the same size, were in non-aggressive positions and were of single adults in natural environments. The thirty animal pictures were randomized through the use of a TRNG. Based on the true random numbers generated, the thirty animal pictures (29 animals) were placed on the PowerPoint slides (Table 1) and shown to the participants.
Results
Cronbach's alpha reliability analysis was conducted on the attitude toward the animal and the likelihood of incorporation Likert-scales (Table 1). All Cronbach's alpha reliability results were above the 0.8 cut off that defines satisfactory internal reliability. Because the participants of the study were not asked to identify any underlying latent constructs, further analysis is not needed.
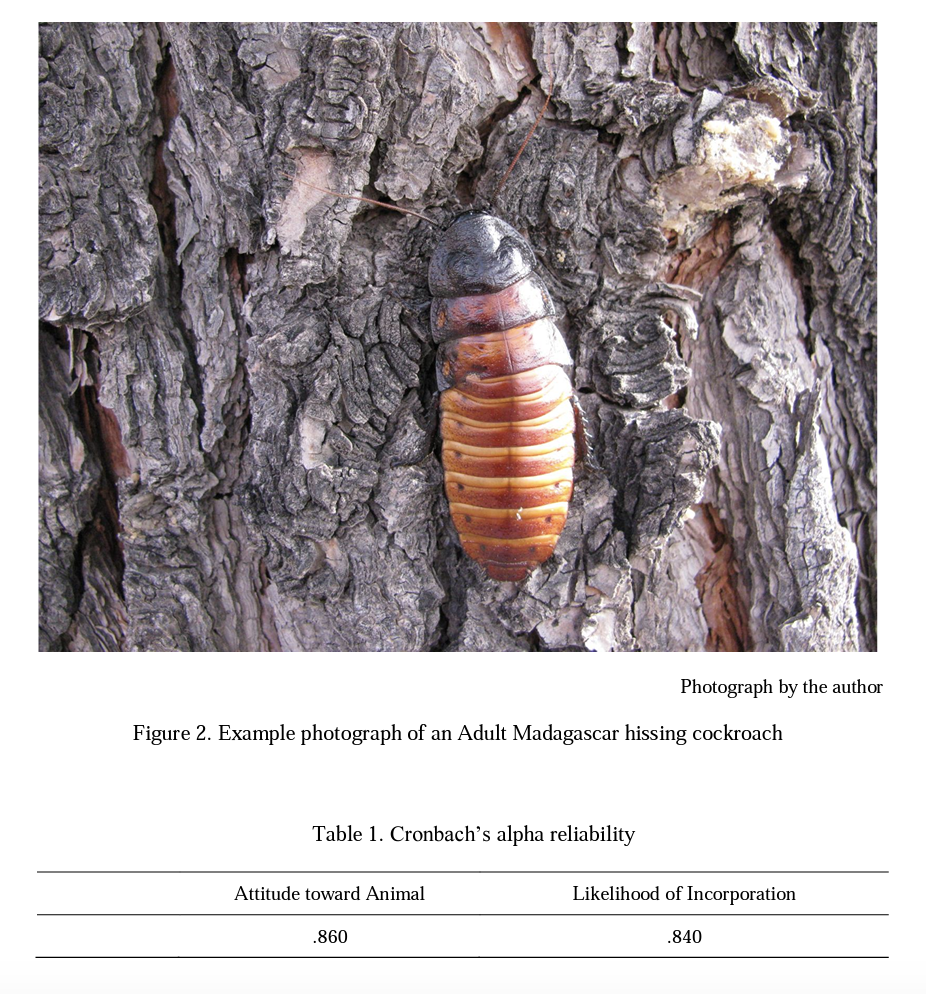
Table 2 presents the PowerPoint slide number, the animal shown on each slide, the mean and standard deviation for all participants' responses to rating their attitude toward the specific animal shown and rating their likelihood of incorporating the specific animal shown into their future science classroom curriculum.
Table 3 presents the the polychoric correlation for all participants' responses to the specific animal shown and the p-value associated with each correlation. Polychoric correlation measures an association between two ordinal scale random variables (Uebersax, 2009). A polychoric correlation is an appropriate method to utilize since the latent traits being measured, attitude and likelihood of use, may be viewed as continuous variables that are measured on an ordinal scale. For example, the attitude and likelihood of use an individual has towards an animal lies somewhere on a continuous scale and the scale is divided into ordered categories for convenience (e.g., Likert scale). The p-values reported in Table 3 test whether this polychoric correlation is significantly different than 0.
Table 2. Mean attitude and mean likelihood of incorporation
Slide Number | Animal | Mean Attitude toward Animal" | Std. Attitude toward Animal | Mean Likelihood of Incorporation13 | SD Likelihood of Incorporation |
1 | Fox | 3.321 | 0.843 | 3.045 | 0.757 |
2 | Clam | 3.255 | 0.793 | 2.798 | 0.769 |
3 | Seal | 4.328 | 0.613 | 3.372 | 0.641 |
4 | Starfish | 3.945 | 0.766 | 3.293 | 0.620 |
5 | Lion | 3.946 | 1.090 | 3.377 | 0.722 |
6 | Crayfish | 2.478 | 1.035 | 2.295 | 0.819 |
7 | Bear | 3.897 | 1.006 | 3.402 | 0.670 |
8 | Cockroach (MHC) | 1.723 | 0.955 | 1.836 | 0.903 |
9 | Butterfly (Monarch) | 4.642 | 0.663 | 3.771 | 0.514 |
10 | Grasshopper | 2.934 | 0.970 | 2.664 | 0.823 |
11 | Elephant | 4.440 | 0.707 | 3.647 | 0.573 |
12 | Snake | 2.527 | 1.228 | 2.750 | 0.960 |
13 | Fish (Goldfish) | 4.272 | 0.811 | 3.614 | 0.590 |
14 | Frog | 3.180 | 1.033 | 3.043 | 0.745 |
15 | Fish (Freshwater Perch) | 3.467 | 0.809 | 2.967 | 0.728 |
16 | Bird (Sparrow) | 4.197 | 0.842 | 3.421 | 0.657 |
17 | Spider | 2.071 | 1.136 | 2.473 | 1.050 |
18 | Bird (Red-tailed Hawk) | 3.930 | 0.893 | 3.225 | 0.757 |
19 | Caterpillar (Monarch) | 3.560 | 1.075 | 3.201 | 0.745 |
20 | Salamander | 2.739 | 1.044 | 2.593 | 0.860 |
21 | Mouse | 3.212 | 1.299 | 2.836 | 0.929 |
22 | Rabbit | 4.402 | 0.710 | 3.531 | 0.618 |
23 | Sponge | 3.386 | 0.854 | 2.792 | 0.852 |
24 | Turtle | 4.038 | 0.845 | 3.180 | 0.781 |
25 | Lizard (Iguana) | 3.082 | 0.999 | 2.830 | 0.750 |
26 | Dolphin | 4.667 | 0.587 | 3.685 | 0.635 |
27 | Deer | 3.967 | 0.847 | 3.410 | 0.603 |
28 | Coral | 3.301 | 0.807 | 2.712 | 0.795 |
29 | Monkey | 4.141 | 0.857 | 3.390 | 0.687 |
30 | Worm (Earth) | 2.522 | 1.126 | 2.615 | 0.926 |
"Likert scale: Extremely Negative [1]. Negative [2]. Neutral [3]. Positive [4]. Extremely Positive [5]. bLikert scale: Extremely Unlikely [1]. Unlikely [2]. Likely [3]. Extremely Likely [4].
Table 4 presents the mean for all participants' responses to rating their attitude toward the specific animal shown and the positive/negative rating (1-15) based on the mean attitude toward the animal.
Table 3. Polychoric correlation
Slide Number | Animal | Polychoric Correlation | P-Valuea |
1 | Fox | 0.673 | <0.001 |
2 | Clam | 0.697 | <0.001 |
3 | Seal | 0.758 | <0.001 |
4 | Starfish | 0.732 | <0.001 |
5 | Lion | 0.756 | <0.001 |
6 | Crayfish | 0.749 | <0.001 |
7 | Bear | 0.669 | <0.001 |
8 | Cockroach (MHC) | 0.779 | <0.001 |
9 | Butterfly (Monarch) | 0.785 | <0.001 |
10 | Grasshopper | 0.663 | <0.001 |
11 | Elephant | 0.690 | <0.001 |
12 | Snake | 0.636 | <0.001 |
13 | Fish (Goldfish) | 0.813 | <0.001 |
14 | Frog | 0.633 | <0.001 |
15 | Fish (Freshwater Perch) | 0.792 | <0.001 |
16 | Bird (Sparrow) | 0.838 | <0.001 |
17 | Spider | 0.590 | <0.001 |
18 | Bird (Red-tailed Hawk) | 0.793 | <0.001 |
19 | Caterpillar (Monarch) | 0.754 | <0.001 |
20 | Salamander | 0.679 | <0.001 |
21 | Mouse | 0.761 | <0.001 |
22 | Rabbit | 0.798 | <0.001 |
23 | Sponge | 0.706 | <0.001 |
24 | Turtle | 0.694 | <0.001 |
25 | Lizard (Iguana) | 0.709 | <0.001 |
26 | Dolphin | 0.732 | <0.001 |
27 | Deer | 0.771 | <0.001 |
28 | Coral | 0.764 | <0.001 |
29 | Monkey | 0.673 | <0.001 |
30 | Worm (Earth) | 0.743 | <0.001 |
aa = 0.05
Table 5 presents the positive rating (1-15) based on the mean attitude toward the animal, the single words (listed from most used to least used) that were used by the participants at least twice and the percentage of words that were positive (Likert scale 4 or 5), neutral (Likert scale 3) or negative (Likert scale 1 or 2).
Table 6 presents the negative rating (1-15) based on the mean attitude toward the animal, the single words (listed from most used to least used) that were used by the participants at least twice and the percentage of words that were negative (1 or 2), neutral (3) or positive (4 or 5).
Table 7 presents the mean for all participants' responses to rating their likelihood of incorporating the specific animal shown into their future science classroom curriculum and the positive/negative rating (1-15) based on the mean likelihood of incorporating the specific animal shown into their future science classroom curriculum.
Table 4. Positive and negative ranking based on mean attitude toward animal presented
Slide Number | Animal | Mean Positive Attitude toward Animal (Most to Least) | Positive Ranking Based on Mean Attitude toward Animal |
26 | Dolphin | 4.667 | 1 |
9 | Butterfly (Monarch) | 4.642 | 2 |
11 | Elephant | 4.440 | 3 |
22 | Rabbit | 4.402 | 4 |
3 | Seal | 4.328 | 5 |
13 | Fish (Goldfish) | 4.272 | 6 |
16 | Bird (Sparrow) | 4.197 | 7 |
29 | Monkey | 4.141 | 8 |
24 | Turtle | 4.038 | 9 |
27 | Deer | 3.967 | 10 |
5 | Lion | 3.946 | 11 |
4 | Starfish | 3.945 | 12 |
18 | Bird (Red-tailed Hawk) | 3.930 | 13 |
7 | Bear | 3.897 | 14 |
19 | Caterpillar (Monarch) | 3.560 | 15 |
|
| Mean Negative | Negative Ranking |
Slide Number | Animal | Attitude toward | Based on Mean |
Animal | Attitude toward | ||
|
| (Most to Least) | Animal |
8 | Cockroach (MHC) | 1.723 | 1 |
17 | Spider | 2.071 | 2 |
6 | Crayfish | 2.478 | 3 |
30 | Worm (Earth) | 2.522 | 4 |
12 | Snake | 2.527 | 5 |
20 | Salamander | 2.739 | 6 |
10 | Grasshopper | 2.934 | 7 |
25 | Lizard (Iguana) | 3.082 | 8 |
14 | Frog | 3.180 | 9 |
21 | Mouse | 3.212 | 10 |
2 | Clam | 3.255 | 11 |
28 | Coral | 3.301 | 12 |
1 | Fox | 3.321 | 13 |
23 | Sponge | 3.386 | 14 |
15 | Fish (Freshwater Perch) | 3.467 | 15 |
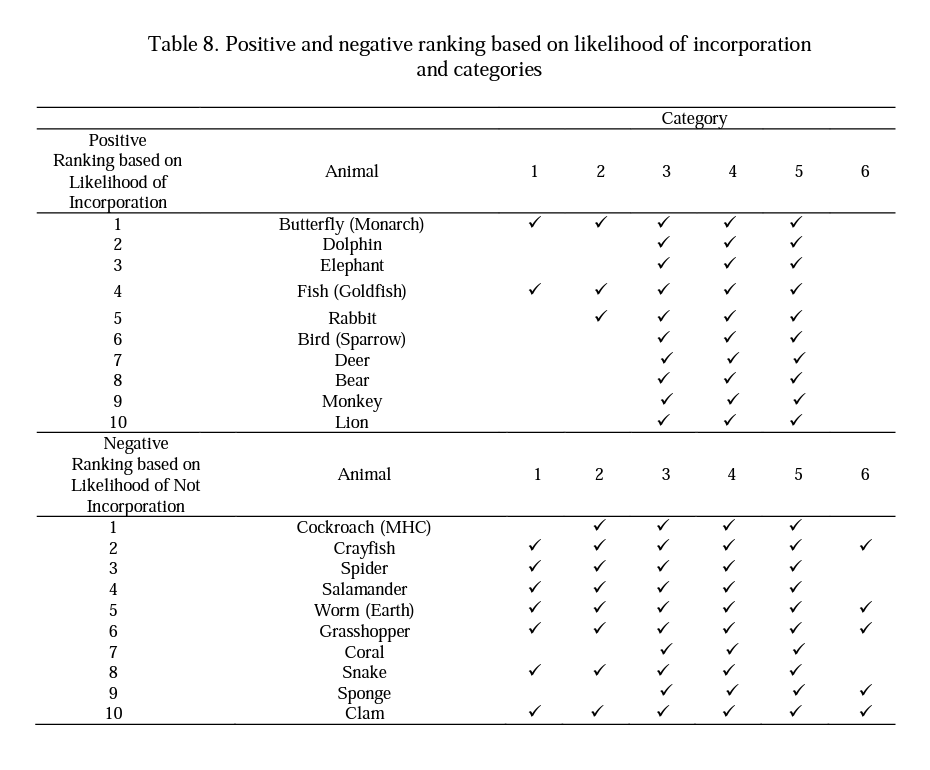
Table 8 presents the ten most positive and negative ranked animals based on the preservice elementary teacher's mean response to the likelihood of incorporating the specific animal shown into their future science classroom curriculum, the animal associated with that ranking and what categories (Selection of Animal Pictures section) that animal fits into. The ten highest positively ranked animals and ten highest negatively ranked animals are presented to show the animals the preservice elementary teachers are most likely and least likely to incorporate into their future science curriculum. Positive and negative animals 11-15 from the "Likelihood of Incorporation"
category (Table 7) have been removed as they represent animals the preservice elementary teachers are moderately likely to incorporate into their future science curriculum.
Table 5. Extremely positive or positive words used to describe the animal presented
Animal | Positive Ranking Based on Mean Attitude toward Animal (Most to Least) | Extremely Positive or Positive Words Used to Describe the Animal Presented (Listed from Most Used to Least Used) | % of Words that were Extremely Positive (5) or Positive (4) | 0 0 of Words that were Neutral (3) | % of Words that were Extremely Negative (1) or Negative (2) |
Dolphin | 1 | Cute, Friendly, Smart, Intelligent, Happy, Playful, Beautiful, Sweet, Adorable, Fun, Lovable, Sea World, Rubbery, Flipper, Love, Awesome. Free. Wonderful. Smooth | 96 | 3.4 | .6 |
Butterfly (Monarch) | 2 | Beautiful, Pretty, Colorful, Happy, Free, Peaceful, Graceful, Life, Lovely, Soft | 92.5 | 3.2 | 4.3 |
Elephant | 3 | Huge, Big, Awesome, Strong, Large, Interesting, Naive, Fun, Dumb | 88.6 | 9.2 | 2.2 |
Rabbit | 4 | Cute, Soft, Adorable, Cuddle, Fast, Fuzzy, Happy, Faster, Fluffy, Carrots, Awww, Funny, Precious, Pretty, Sweet | 88 | 10.9 | 1.1 |
Seal | 5 | Cute, Friendly, Adorable, Sweet, Cleaver, Smart. Ocean | 92.8 | 6.1 | 1.1 |
Fish (Goldfish) | 6 | Cute, Pretty, Colorful, Water, Nice, Yellow, Nemo, Peaceful, Calm, Pet, Cool, Fresh, Curious, Bright, Gentle, Gold, Bubbly, Ocean, Swim | 82 | 14.7 | 3.3 |
Bird (Sparrow) | 7 | Cute, Pretty, Free, Freedom, Nice, Beautiful, Feather, Sings, Smart, Flies, Soft, Chirp, Peaceful, Sing | 79.2 | 19.7 | 1.1 |
Monkey | 8 | Funny, Cute, Hilarious, Beautiful, Adorable, Silly. Intelligent. Silly. Crazy. Weird | 80.8 | 14.8 | 4.4 |
Turtle | 9 | Slow, Cute, Colorful, Adorable, Pretty, Interesting. Shell. Pet. Hard. Weird | 74.7 | 23.6 | 1.7 |
Deer | 10 | Bambi, Cute, Fast, Beautiful, Pretty, Graceful, Elegant, Gentle, Lovely, Nice, Fragile, Quiet, Calm, Forest | 72.6 | 23.1 | 4.3 |
Lion | 11 | King, Powerful, Strong, Fierce, Beautiful, Majestic, Brave, Fear, Leader, Pride, Interesting | 88.6 | 9.2 | 2.2 |
Starfish | 12 | Majestic, Pride, Strong, Bold, Beautiful, Proud, Interesting, Nice, Brave, Smart, Leader, Pretty, Free, Graceful, Awesome, Regal, Smart | 73.8 | 23 | 3.2 |
Bird (Redtailed Hawk) | 13 | Big, Cute, Strong, Fuzzy, Scary, Cuddly, Fluffy, Huge, Huggable, Bear | 67.6 | 29.1 | 3.3 |
Bear | 14 | Pretty, Beautiful, Cool, Cute, Funny, Colorful, Interesting, Unique, Different | 72 | 14.8 | 13.2 |
Caterpillar (Monarch) | 15 | Pretty, Beautiful, Cool, Cute, Funny, Colorful, Interesting, Unique, Different | 57.2 | 25.8 | 17 |
Note: The words used were defined as positive, neutral or negative based on the mean participants attitude rating toward the specific animal shown. Words that were used only once were included in the percentages but have not been listed in the table
Table 6. Extremely negative or negative words used to describe the animal presented
Animal | Negative Ranking Based on Mean Attitude toward Animal (Most to Least) | Extremely Negative or Negative Words Used to Describe the Animal Presented (Listed from Most Used to Least Used) | % of Words that were Extremely Negative (1) or Negative (2) | %of Words that were Neutral (3) | %of Words that were Extremely Positive (5) or Positive (4) |
Cockroach (MHC) | 1 | Gross, Nasty, Yuck, Ugly, Disgusting, Creepy, Slimy, Bastard3, Ewwwww | 77 | 13.3 | 9.4 |
Spider | 2 | Scary, Creepy, Ugly, Hairy, Gross, Fear, Poison, Disgusting, Scared, drills. Sick, Dangerous, Bite, Freaky | 68.9 | 19.1 | 12 |
Crayfish | 3 | Ugly, Gross, Scary, Disgusting, Weird, Pinch, Yuck | 53.8 | 32.4 | 13.8 |
Worm (Earth) | 4 | Slimy, Gross, Nasty, Ugly, Dirty, Disgusting, Yuck | 49.7 | 33.9 | 16.4 |
Snake | 5 | Scary, Bite, Poisonous, Danger, Sneaky, Ugly, Gross, Creepy, Slithery | 49 | 27.6 | 23.4 |
Salamander | 6 | Slimy, Gross, Nasty, Slippery, Poisonous, Yuck | 37.8 | 40.6 | 21.6 |
Grasshopper | 7 | Ugly, Gross, Jumpy, Noise, Crawly, Horrible | 28.3 | 45.6 | 26.1 |
Lizard (Iguana) | 8 | Ugly, Scaly, Mean, Nasty, Scary, Gross, Weird, Creepy, Green | 26.4 | 39.6 | 34 |
Frog | 9 | Gross, Slimy, Nasty, Ugly, Dirty | 22.5 | 40.7 | 36.8 |
Mouse | 10 | Gross, Ugly, Nasty, Dirty Yuck | 29.9 | 24.5 | 45.6 |
Clam | 11 | Ugly, Yuck, Strange, Curious | 12.7 | 51.9 | 35.4 |
Coral | 12 | Weird, Gross | 10.6 | 56.1 | 33.3 |
Fox | 13 | Scary, Bite, Ugly | 13.9 | 42.8 | 43.3 |
Sponge | 14 | Weird | 9.4 | 52.2 | 38.4 |
Fish (Freshwater Perch) | 15 | Ugly | 5.6 | 55.9 | 38.5 |
aThe author does not endorse calling Madagascar Hissing Cockroaches “bastards”
Discussion
Research Question 1
Three research questions defined this study. Research question one assessed the K-4 preservice elementary teacher's attitudes toward the thirty animal pictures presented. All mammals and birds that were presented (Table 4), except for the mouse and the fox, occur in the positively ranked category. Nine of the fifteen positively ranked animals are mammals and two are birds. Only one invertebrate (monarch) occurs in the fifteen positive ranked animals. The positive ranking of the monarch was dependent on the stage in the monarch's life cycle that was presented. Thirteen of the fifteen negative ranked animals are non-mammalian and eight of these are invertebrates (sponge, coral, worm, mollusk, insects, crustacean, and arachnid) (Table 4). The remaining five non-mammalian animals consist of two amphibians (salamander and frog), two reptiles
Table 7. Positive and negative ranking based on likelihood of incorporation in future science curriculum
Slide Number | Animal | Mean Positive Likelihood of Incorporation (Most to Least) | Positive Ranking based on Likelihood of Incorporation |
9 | Butterfly (Monarch) | 3.771 | 1 |
26 | Dolphin | 3.685 | 2 |
11 | Elephant | 3.647 | 3 |
13 | Fish (Goldfish) | 3.614 | 4 |
22 | Rabbit | 3.531 | 5 |
16 | Bird (Sparrow) | 3.421 | 6 |
27 | Deer | 3.410 | 7 |
7 | Bear | 3.402 | 8 |
29 | Monkey | 3.390 | 9 |
5 | Lion | 3.377 | 10 |
3 | Seal | 3.372 | 11 |
4 | Starfish | 3.293 | 12 |
18 | Bird( Red-tailed Hawk) | 3.225 | 13 |
19 | Caterpillar (Monarch) | 3.201 | 14 |
24 | Turtle | 3.180 | 15 |
| Animal | Mean Negative | Negative Ranking based on Likelihood |
Number | Incorporation (Least to Most) | of Not Incorporation | |
8 | Cockroach (MHC) | 1.836 | 1 |
6 | Crayfish | 2.295 | 2 |
17 | Spider | 2.473 | 3 |
20 | Salamander | 2.593 | 4 |
30 | Worm (Earth) | 2.615 | 5 |
10 | Grasshopper | 2.664 | 6 |
28 | Coral | 2.712 | 7 |
12 | Snake | 2.750 | 8 |
23 | Sponge | 2.792 | 9 |
2 | Clam | 2.798 | 10 |
25 | Lizard (Iguana) | 2.830 | 11 |
21 | Frog | 2.836 | 12 |
15 | Fish (Freshwater Perch) | 2.967 | 13 |
14 | Mouse | 3.043 | 14 |
1 | Fox | 3.045 | 15 |
(snake and lizard) and one fish (freshwater perch).
An extremely high percentage of the positive words the preservice elementary teachers listed (Table 5) as descriptive of these animals are associated with assigning anthropomorphic attributes (i.e., sweet) and/or associating positive (i.e., beautiful) value to the animal's physical appearance. The most frequent words associated with animals identified as positive (Table 5) were cute, pretty, beautiful, adorable and sweet. An extremely high percentage of the negative words the preservice elementary teachers listed (Table 6) as descriptive of these animal are associated with assigning anthropomorphic attributes (i.e., sneaky), and/or associating negative (i.e., ugly) value to the animal's physical appearance and/or believing the animals can cause physical harm (i.e., poison). The most frequent words associated with animals identified as negative (Table 6) were gross, ugly, nasty, scary and disgusting. Based on this data (Table 4, 5 and 6) the general trend observed is that the preservice elementary teachers tend to have a positive attitude toward mammals and birds and a negative attitude toward non-mammalian animals such as reptiles, amphibians and invertebrates.
Research Question 2
Research question two assessed how likely the K-4 preservice elementary teachers were to incorporate the animals presented into their future science curriculum. The same general trends observed with the preservice elementary teacher's attitudes toward the animals presented were observed with the preservice elementary teacher's likelihood of incorporating the animals presented. Of the ten animals (Table 8) the preservice elementary teachers are likely to incorporate into their future science curriculum, 90% consist of vertebrates and 70% are mammals. Three non-mammalian animal groups account for the remaining 30%. They include specific insects (monarch butterfly), specific fish (goldfish) and specific birds (sparrow).
Animal groups that are highly likely to be incorporated into the preservice teacher's future science curriculum consist of mammals. The preservice elementary teachers were only willing to use certain species of insects, at certain developmental stages, into their future science curriculum and not all representatives of this animal group. This is apparent by the preservice teacher's exclusion of all insects and only including the monarch when in an adult stage (butterfly). The preservice elementary teachers were also only willing to incorporation certain species of birds (sparrow) into their future science curriculum. This is evident by the preservice teacher's moderate willingness to use the red-tailed hawk. And finally, the preservice elementary teachers were also only willing to incorporation certain species of fish (goldfish) into their future science curriculum. This is made clear by the preservice teacher's moderate willingness to include the freshwater perch. These findings are consistent with the results of the pilot study where multiple examples of these animal groups (insects, birds and fish) were included because of the preservice elementary teacher's tendency to display different attitudes and different levels of likelihood of incorporation for specific species within an animal group.
Of the ten animals (Table 8) the preservice elementary teachers are unlikely to incorporate into their future science curriculum, 80% consist of invertebrates. The remaining 20% consist of an amphibian (salamander) and a reptile (snake). Animal groups that are highly unlikely to be incorporated into the preservice teachers future science curriculum consist of insects (MHC and grasshopper1), crustaceans (crayfish), arachnids (spider), amphibians (salamander), annelids (earthworm), cnidarians (coral), reptiles (snake), poriferans (sponge) and mollusks (clam).
Research Question 3
Research question three assessed if a statistically significant association existed between the K-4 preservice elementary teacher's attitudes toward specific animals and likelihood of incorporating specific animals into their future science curriculum. For all thirty animal pictures presented a statistically significant positive polychoric correlation (Table 3) was found between the K-4 preservice elementary teacher's attitude toward a specific animal (Research Questions 1) and the likelihood of incorporated that specific animal into the preservice teacher's future science curriculum (Research Questions 2). This finding validates the model presented (Figure 1) and provides strong statistically valid evidence (P-Value=<0.001 for all animals) that the K-4 preservice elementary teacher's attitudes (B) toward specific animals directly influenced their beliefs (C) about the likelihood of incorporating specific animals into their future science curriculum. In a practical sense, this means that if a preservice teacher has a positive attitude toward an animal (Table 8) they are much more likely to believe that they will use that animal in their future science curriculum. Conversely, if a preservice teacher has a negative attitude (Table 8) toward an animal they are much more likely to believe that they will not use that animal in their future science curriculum.
Conclusions Associated with Research Question 1, 2 and 3
The trends, based on the data associated with this study, are clear. A strong statistical association exists between the preservice elementary teacher's attitude about a specific animal and their belief to include or exclude that animal from their future science curriculum. The K-4 preservice elementary teachers do believe they will include animals into their future science curriculum that they believe possess positive anthropomorphic attributes (i.e., happy, smart, fun, free, etc.) and/or positive physical appearances (i.e., beautiful, adorable, cute, etc.). The K-4 preservice elementary teachers do not believe they will include animals from their future science curriculum that they believe possess negative anthropomorphic attributes (i.e., sneaky, mean, etc.), and/or negative physical appearances or behaviors (i.e,, ugly, slimy, hairy, creepy, etc.) and/or if they believe the animals can cause physical harm (i.e., poison, pinch, bite, dangerous, etc.). These animal beliefs, which form the basis for the inclusion or exclusion of these animals, are inconsistent with the scientific communities understand of the nature of these animals.
Based on these beliefs the K-4 science learning environment that the vast majority of the preservice elementary teachers in this study will construct for their future students will be dominated by mammals which the preservice elementary teachers believe possess positive anthropomorphic attributes and/or positive physical appearances. Small percentages of other nonmammalian animals (i.e., monarch butterfly) will also be included into the learning environment if the teacher believes these animals possess these same positive attributes and positive physical appearances. This is most evident with the inclusion of the monarch butterfly and the non inclusion of the monarch caterpillar. The learning environment will be void of any invertebrates (sponges, corals, worms, mollusks, insects1, crustaceans, and arachnids), amphibians and reptiles because of the preservice elementary teacher's tendency to believe these animals possess negative anthropomorphic attributes, and/or negative physical appearances/behaviors and/or the ability to cause harm. Furthermore, it can be speculated that the teachers will convey, to their students, their incorrect beliefs about the nature of the animals that are present in their classrooms.
Implications of the Study
Implications Concerning Students Long Term Biological Comprehension
During the developmental period from kindergarten to fourth grade the K-4 National Science Education Standards (NSES) (NRC 1996) and the K-4 North American Association for Environmental Education Standards for the Initial Preparation of Environmental Educators (NAAEES) (NAAEE, 2004) have emphasized, to different degrees, the need for students to be exposed to biodiverse groups of animals in their science classes. In both sets of standards this content is considered essential to understanding the ever-increasingly complex biological concepts a student will be exposed to in middle and secondary science.
For example, in the elementary school (K-4) exposure to biodiverse groups of animals from different trophic levels (e.g., cockroach-> spider-> frog-> bird->fox) is necessary to understanding the concepts associated with food chains (NAAEE, 2004; NRC, 1996). In middle school (5-8) the knowledge of animal biodiversity and food chains, learned during kindergarten to fourth grade, is essential to the understanding of many higher order concepts such as species populations, ecosystems, food webs, limiting factors, biotic and abiotic interactions, energy flow, species extinction and the role of biological evolution (NAAEE, 2004; NRC, 1996). In the secondary (9-12) life science courses the knowledge learned in middle school is vital in developing a more thorough understanding of the complex interactions between the Earth's abiotic and biotic systems and underlying mechanisms and processes such as heredity, natural selection, descent from
common ancestor, genetic drift, biological coevolution, genetic variation, symbiosis and past mass extinctions (NAAEE, 2004; NRC, 1996).
By reading the K-12 NSES (NRC, 1996) and the K-12 NAAEES (NAAEE, 2004) standards, it is apparent there existences a causal cognitive chain of increasing biological comprehension that begins with elementary teachers providing a science curriculum that presents a representative sample of animals from invertebrates to mammals. If students are not exposed to this foundational knowledge of animal biodiversity during their elementary years they will not learn and understand this knowledge. This knowledge is essential to the student's progressive cognitive development in the biological sciences during the middle and secondary school years. Therefore, when K-4 students do not experience a science curriculum of this nature and are then exposed, in their middle school science courses, to the increasingly complex interactions of the earth's abiotic environment and the biodiverse animals that live in that environment, they fall behind in their conceptual understanding. This compounding negative effect is carried into the secondary biology and environmental science classroom.
Six categories defined the criteria for including an animal picture in the study (Selection of Animal Pictures). All of the six categories (Tables 8) provide interconnected positive long term educational benefits to students throughout their K-12 educational experience. Each category assists in developing a causal cognitive chain of increasing biological comprehension within a student.
The animals in categories one, two and three, if allowed into the K-4 classroom provide, among other positive benefits, an environment where students have direct interaction with both invertebrate and vertebrate animals. Knowledge associated with these animals is fundamental to the students understanding of trophic levels in a food chain. An inclusion of animals from different tropic levels (category four) provides students with opportunities to understand how different types of animals interact in food chains, food webs, ecosystems, biomes and the biosphere. By including the animals in categories five and six into the K-4 classroom a learning environment is constructed where students interact with animals they will, more than likely, experience in their middle and secondary biological sciences classes. This interaction reinforces many of the biological concepts the students learned in their K-4 classroom.
Unfortunately, most of these "essential" categories (and associated animals) will not be included (Table 8, see Negative Ranking based on Likelihood of Not Incorporation) in the preservice elementary teacher's future science curriculum. This exclusion will negatively affect the student's success in middle school science and in high school biology/environmental science courses.
Implications Concerning Pre service Elementary Teacher Preparation
Research carried out over the last four decades, from multiple countries, has shown there is a general trend among children to more frequently believe the conceptual understanding of an animal refers to common well-known mammals. Children also have a tendency to have difficulty classifying invertebrate and vertebrate animals.2 More recently, Prokop, Prokop and Tunnicliffe (2008), in a study addressing the effects of keeping pet's on children's concepts of invertebrates and vertebrates, found a "significant proportion of children showed misunderstandings of internal organs of invertebrates and ascribed an internal skeleton to them in their drawings. This drawing of bones inside invertebrates was mostly among younger children (up to age of 10)" (Prokop, Prokop, & Tunnicliffe, 2008, p. 444). Of the 2,438 animals reported as pets, by the 1,252 participating children, only ten were invertebrates. Prokop, Prokop and Tunnicliffe (2008) suggest that "biology/science teachers should encourage children to keep a diverse range of animals, particularly invertebrates that can be obtained and reared easily" (Prokop, Prokop, &
Tunnicliffe, 2008, p. 446) and "that science activities with animals should be more focused on rearing invertebrates and improving children's attitudes and knowledge about them" (Prokop, Prokop, & Tunnicliffe, 2008, p. 431).
Bjerke, Odegardstuen and Kaltenborn (1998b) conducted a study assessing Norwegian children and adolescents attitudes toward animals. A questionnaire, based on Kellert‘s (1996) attitude typology toward animals, was developed and administered. Findings included that the "humanistic attitude type ranked first, followed by the moralistic, ecologistic, naturalistic, negativistic, dominionistic, and utilitarian attitude types. Gender differences appeared on the moralistic and negativistic (girls highest), and the naturalistic, dominionistic, and utilitarian (boys highest) sub-scales. Scores on the ecologistic, naturalistic, and dominionistic sub-scales decreased with increasing age. Urban respondents had higher moralistic, and rural respondents had higher dominionistic sub-scale scores. Respondents who owned a pet had higher humanistic, moralistic, and lower utilitarian sub-scale scores than had non-owners" (Bjerke, Odegardstuen, & Kaltenborn, 1998, p. 79).
Bjerke, Odegardstuen and Kaltenborn (1998b) also conducted a study assessing Norwegian children and adolescents "degree of preference for various animal species" (Bjerke, Odegardstuen, & Kaltenborn, 1998b, p. 224). The "crow, worm, bee, and spider" were found to be the least favorite species while the "dog, cat, horse, and rabbit were the favorite species" (Bjerke, Odegardstuen, & Kaltenborn, 1998b, p. 224). "Girls were more positive toward horses, and were more pet-orientated than boys, while more boys than girls preferred wild animals. Younger respondents liked animals more than did 15-year-olds, with a few exceptions: the wolf, bear, and whale. Urban respondents liked animals more than rural respondents did, a finding which applied to the large carnivores in particular. Interests in wildlife decreased with increasing age, and few respondents wished to save ecologically-significant species (ants, bees, ladybirds) from extinction" (Bjerke, Odegardstuen & Kaltenborn, 1998a, p. 224).
Bjerke, Kaltenborn and Odegardstuen (2001) assessed Norwegian children and adolescents "degree of preference for various animal species, participation in animal-related activities, and the presence of pets at home" (Bjerke, Kaltenborn, & Odegardstuen, 2001, p. 86). They found that 71% of the participants had an animal at home, 72% were involved in fishing, 72% fed birds and 66% read about animals. Animal-related activity participation decreased as the children and adolescents got older. Participants without pets disliked farm and wild animals more than those that owned pets. Positive correlations were found between participation in animal-related activities and the liking of animal species. Children and adolescents "who reported allergic reactions to animals, or had been injured by an animal, liked animals as much as, or more than, did the other respondents" (Bjerke, Kaltenborn, & Odegardstuen, 2001, p.86). Uastly, "gender differences were largest for horseback riding (girls most) and for fishing and hunting (boys most)" (Bjerke, Kaltenborn, & Odegardstuen, 2001, p.86). All three studies used data collected from"562 children and adolescents, aged between 9 and 15 years, from one urban and two rural areas in Southern Norway" (Bjerke, Odegardstuen, & Kaltenborn, 1998, p. 79).
As others studies have shown, preservice teacher's attitudes (Pedersen & McCurdy, 1992; Piper & Hough, 1979; Syh-Jong, 2007; Weinburgh, 2007; Wenner, 1993; Westerback, 1982) and beliefs (Cakiroglu, Cakiroglu, & Boone, 2005; King & Wiseman, 2001; Moseley & Utley, 2006; Mulholland, Dorman, & Odgers, 2004; Palmer, 2006; Schoon & Boone, 1998; Utley, Moseley, & Bryant, 2005; Yilmaz-Tuzun & Topen, 2008) play a role in preservice teacher preparation. This study provides the first empirical evidence that a preservice elementary teacher's attitude toward an animal affects their belief about using that animal in their future science curriculum. The general trend observed was that the preservice elementary teachers believe they will include a large majority of mammals and exclude all reptiles, amphibians and invertebrates1. Based on this evidence, the past research on children's understanding of animals (Yen, Yao, & Mintzes, 20 072; Prokop, Prokop, & Tunnicliffe, 2008) and Bjerke, Odegardstuen and Kaltenbom's (1998a; 1998b; 2001) research it is important that the preparation of preservice elementary teachers includes experiences associated with a biodiverse array of animals from invertebrates to mammals. Preservice elementary teacher preparation programs are in a unique position to offer these experiences, and have a meaningful impact in the future teacher's classroom, since they are often the last training future teachers receive before they take their first teaching job in a school.
These experiences may be through direct contact, as in Weinburgh's 2007 study, that found an improvement in preservice elementary teacher's content knowledge and attitudes about mealworms; through course trips where preservice elementary teachers can experience and learn about ecosystems that possess great biodiversity; by having preservice elementary teachers develop and teach specific animal activities or by simply incorporating scientifically accurate information about biodiverse animals into preservice elementary teacher's science methods courses. Any combination of these methods, when applied to the animals the preservice elementary teachers are unlikely to incorporate into their future science curriculum (Table 8), has the potential to change the preservice teacher's attitudes and beliefs concerning these animals. This, in turn, may increase their ability to implement future science curriculums, representative of the biodiverse ecosystems of the earth, which incorporate reptiles, amphibians and invertebrates.
Conclusions
Approximately (~) 10,000,000 extant animal species exist on our planet. -99% of these animals are invertebrates (Johnson, 2003). Only -4,600 of the -10,000,000 extant species are mammals. An elementary classroom dominated by misrepresented mammals combined with the inability to experience invertebrates, amphibians and reptiles will negatively affect a student's success in middle school science, high school biology and high school environmental science courses. It is essential that students are exposed to a K-4 science curriculum which incorporates reptiles, amphibians and invertebrates; represents all animals in a scientifically accurate way; and conveys the interconnected life-sustaining relationship animals have to one another and to the environment. Preservice elementary teacher preparation programs can play a crucial role in making this vision a reality by including meaningful experiences with biodiverse types of animals in the courses they offer.
References
- Albarracin, D., Johnson В. T., & Zanna, M. P. (Ed.). (2005). The handbook of attitudes. Mahwah, NJ: Lawrence Erlbaum.
- American Association for the Advancement of Science (AAAS). (1993). Benchmarks for science literacy. New York: Oxford University Press.
- Ashton, P. (1985). Motivation and the teacher's sense of efficacy. In C. Ames and R. Ames (Eds.), Research on motivation in education: Vol. 2. The classroom milieu (pp. 141-174). Orlando: Academic Press.
- Bjerke, T., Odegardstuen, T. S., & Kaltenborn, В. P. (1998a). Attitudes toward animals among Norwegian adolescents. Anthrozoös, 77(2), 79-86.
- Bjerke, T., Odegardstuen, T. S., & Kaltenborn, В. P. (1998b). Attitudes toward animals among Norwegian children and adolescents: species preferences. Anthrozoös, 77(4), 227-235.
- Bjerke, T., Kaltenborn, В. P., & Odegardstuen, T. S. (2001). Animal-related activities and appreciation of animals among children and adolescents. Anthrozoös, 14(2), 86-94.
- Cakiroglu, J., Cakiroglu, E., & Boone, W. (2005). Pre-service teachers self-efficacy beliefs regarding science teaching: A comparison of pre-service teachers in Turkey and the USA. Science Educator, 7-/(l), 31-40.
- Eagly, A. H., & Chaiken, S. (1993). The psychology of attitudes. Orlando: Harcourt Brace Jovanovich.
- Eagly, A. H., & Chaiken, S. (1998). Attitude structure and function. In D. Gilbert et al. (Ed.), Handbook of Social Psychology 4th Ed. (Vol. 1, pp. 269-322). Boston: McGraw-Hill.
- Enochs, L., & Riggs, I. (1990). Further development of an elementary science teaching efficacy belief instrument: A preservice elementary scale. School Science and Mathematics, 90(8), 694-706.
- Heider, F. (1958). The psychology of interpersonal relations. Hillsdale: Lawrence Erlbaum Associates.
- Johnson, G. B. (2003). The living world. New York: McGraw Hill.
- Kellert, S. R. (1996). The value of life. New York: Island Press.
- King, К. P., & Wiseman, D. L. (2001). Comparing science efficacy beliefs of elementary education majors in integrated and non-integrated teacher education coursework. Journal of Science Teacher Education, 12, 143-153.
- Kruglanski, A. W. & Stroebe, W. (2005). The influence of beliefs and goals on attitudes: Issues of structure, function, and dynamics. In D. Albarracin, В. T. Johnson & M. P. Zanna (Eds.), The handbook of attitudes (pp. 323-368). Mahwah: Lawrence Erlbaum.
- Lohr. S. (1999). Sampling: Design and Analysis. Pacific Grove: Brooks/Cole Publishing.
- Marsh, K. L., & Wallace, H. M. (2005). The influence of attitudes on beliefs: Formation and change.
- In D. Albarracin, В. T. Johnson & M. P. Zanna (Eds.), The handbook of attitudes (pp. 323- 368). Mahwah: Lawrence Erlbaum.
- Moseley, C., & Utley, J. (2006). The effect of an integrated science and mathematics content-based course on science and mathematics teaching efficacy of preservice elementary teachers. Journal of Elementary Science Education, 18(2), 1-12.
- Mulholland, J., Dorman, J. P., & Odgers, В. M. (2004). Assessment of science teacher efficacy of preservice teachers in an Australian university. Journal of Science Teacher Education, 75(4), 313-331.
- North American Association for Environmental Education (NAAEE). (2004). North American association for environmental education standards for the initial preparation of environmental educators (NAAEE 8). Retrieved June 16, 2010, from North American Association for Environmental Education Web site: http://www.naaee.org/programs-and-initiatives/ncate-ee- program-standards
- National Research Council (NRC). (1996). National science education standards. Washington, DC: National Academy Press.
- National Research Council (NRC). (2000). Inquiry and the national science education standards: A guide for teaching and learning. Washington, DC: National Academies Press.
- Osgood, С. E., & Tannenbaum, P. H. (1955). The principle of congruity in the prediction of attitude change. Psychological Review, 62, 42-55.
- Palmer, D. (2006). Durability of changes in self-efficacy of preservice primary teachers. International Journal of Science Education, 28(6), 655-671.
- Pedersen, J. E., & Mccurdy, D. W. (1992). The effects of hands-on, minds-on teaching experiences on attitudes of preservice elementary teachers. Science Education, 76(2), 141-146.
- Piper, M. K., & Hough, L. (1979). Attitudes and open-mindedness of undergraduate students enrolled in a science methods course and a freshman physics course. Journal of Research in Science Teaching, 76(3), 193-197.
- Prokop, R, Prokop, M., & Tunnicliffe, S. D. (2008). Effects of keeping animals as pets on children's concepts of vertebrates and invertebrates. International Journal of Science Education, 30(4), 431-449.
- Rosenberg, M. J. (1960). An analysis of affective-cognitive consistency. In M. J. Rosenberg, С. I. Hovland, W. J.McGuire, R. P. Abelson, & J. W. Brehm (Eds.), Attitude organization and change: An analysis of consistency among attitude components (pp. 15-64). New Haven, CT: Yale University Press.
- Schoon, K. J., & Boone, W. J. (1998/ Self-efficacy and alternative conceptions of science of preservice elementary teachers. Science Education, 82, 553-568.
- Sherif, C. W., Sherif, M. S., & Nebergall, R. E. (1965). Attitude and attitude change. Philadelphia: W.B. Saunders Company.
- Syh-Jong, J. (2007). A study of students' construction of science knowledge: Talk and writing in a collaborative group. Educational Research, -/9(1), 65-81.
- Uebersax, J. S. (2009). The tetrachoric and polychoric correlation coefficients. Retrieved June 16, 2010, from Statistical Methods for Rater and Diagnostic Agreement Web site: http://www.john-uebersax.com/stat/tetra.ht
- Utley, J., Moseley, C., & Bryant, R. (2005). Relationship between science and mathematics teaching efficacy of preservice elementary teachers. School Science and Mathematics, 705(2), 40-45.
- Weinburgh, M. (2007). The effect of tenebrio obscurus on elementary preservice teachers' content knowledge, attitudes, and self-efficacy. Journal of Science Teacher Education, 18, 801-815.
- Wenner, G. (1993). Relationship between science knowledge levels and beliefs toward science instruction held by preservice elementary teachers. Journal of Science Education and Technology, 2(3), 461-468
- Westerback, M. E. (1982). Studies on attitude toward teaching science and anxiety about teaching science in preservice elementary teachers. Journal of Research in Science Teaching, 79(7), 603-616.
- Yen, С.-F., Yao, T.-W., & Mintzes, J. J. (2007). Taiwanese students' alternative conceptions of animal biodiversity. International Journal of Science Education, 29(4), 535-553.
- Yilmaz-Tuzun, O., & Topen, M. S. (2008). Relationships among preservice science teachers' epistemological beliefs, epistemological world views, and self-efficacy beliefs. International Journal of Science Education, 30(1), 65-85.
Related Articles
Mahsa Kazempour
Justin Dillon
Gaye Teksoz
Elvan Sahin
Hamide Ertepinar
Dr. Ron Wagler
Dr. Amy Wagler