This article is published under a Creative Commons license and not by the author of the article. So if you find any inaccuracies, you can correct them by updating the article.

The Effect of Investment, Free Cash Flow, Earnings Management, and Interest Coverage Ratio on Financial Distress


Meryana
Erna Setiany
Published: Jan. 1, 2021
Latest article update: Nov. 17, 2022
This article is published under the license


Abstract
The purpose of this research is to test investments, free cash flow, earnings management, and interest coverage ratio are affecting the risk of financial distress in healthy enterprises.. Healthy companies can be seen from how large the value of working capital, retained earnings, income before tax, market value and sales implemented in the measurement of the financial difficulties model with the Altman Z-score method. Collection of data by purposive sampling and number of samples as many as 33 companies in the category of healthy companies. The results show that free cash flows and interest coverage ratio significant effect on the financial difficulties of healthy companies whereas investment and earnings management had no significant effect on the financial difficulties of healthy companies
Keywords
Free Cash Flow, Investment, Earnings Management, Interest Coverage Ratio, Financial Distress
INTRODUCTION
Every company generally can face financial distress conditions. Financial distress is a condition in which the agreement or contract between the company and creditors does not function as expected or at a difficult stage (Ghazali et. Al., 2015). Financial difficulties can be characterized by the company's inability to meet its short-term obligations. In Indonesia, financial distress and bankruptcy have again received serious attention, especially when leading companies in Indonesia such as PT. Sariwangi Agricultural Estate Agency and PT. Nyonya Meneer went bankrupt. In addition, there are also large companies experiencing financial difficulties that have had to close their services, such as PT. Citra Maharlika Nusantara Corpora Tbk. (Cipaganti) and PT Intern их (a subsidiary of PT. First Media Tbk. BOLT! Service provider). In addition, the collateral manipulation case committed by SNP Finance against 14 banks which resulted in losses of up to IDR 14 trillion also added to the study of the bankruptcy issue.
The manufacturing industry is one of the strategic industries in Indonesia. In 2018, the manufacturing industry sector absorbs as much as 14.72% of the workforce or as many as 18.25 million people (Ministry of Industry, 2019). With the high rate of employment, the manufacturing industry has an important role in maintaining the national economy. Performance growth in this industry must be catalyzed in order to generate higher profits and avoid financial distress situations because bankruptcy in companies in these industries can cause unemployment and national economic instability.
Analysis of the causes of companies experiencing financial distress will affect the company in determining its financial strategy. A good financial strategy will allow the company to operate sustainably and generate profits in the long term. Therefore, company financial managers must know important indicators that can detect financial distress signals and take innovative steps to prevent bankruptcy.
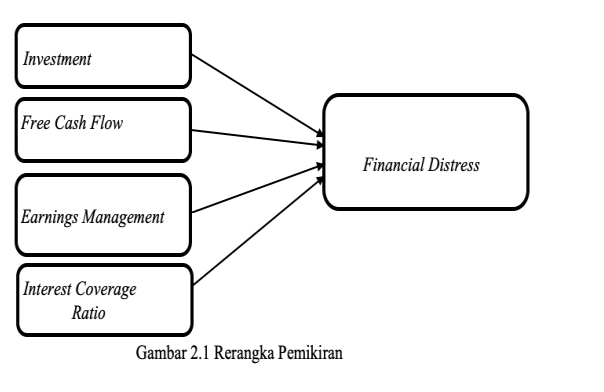
Based on the phenomenon of bankruptcy in Indonesia and other countries, the author proposes research on financial distress, investment, free cash flow, earnings management, interest coverage ratio in manufacturing companies listed on the Indonesia Stock Exchange for the 2016-2017 period.
Literature Review
In agency theory it is developed with three assumptions. First, agents tend to have limited rationality (bounded rationality), prioritize their own interests (self interest), and avoid risk (riskaversion). Second, in an organization there is always a conflict of purpose between interested parties, asymmetric information between owners and managers, and principals tend to make efficiency a criterion. Third, information is a commodity that can be traded. Agents tend to prioritize their own interests rather than organizational interests. If faced with a choice that meets the minimum criteria, the agent as the decision maker will choose an option that benefits himself. In addition, agents of selfishness can take the risk of fraud, selling products at prices lower than market prices, and maintaining positions even though they are no longer competent. The problem that arises from this assumption is that the principal faces high costs to replace management.(Setiany, Suhardjanto, Lukviarman, & Hartoko, 2017) explained that an investor needs information about the company's financial condition and performance to make investment decisions. The relationship between management and investors, which basically needs each other, will be limited by information problems and agency problems.
To anticipate the risks of financial distress and bankruptcy, a prediction model is needed. (Altman, 1968) developed a model to predict the model of financial distress. The model developed by Altman is based on the results of an analysis of public manufacturing companies that are considered bankrupt and not bankrupt. One of them is that investment activities contain an element of risk. To reduce risk, investors need to form a portfolio. When forming a portfolio, investors generally consider a high rate of return with a certain level of risk or consider a low level of risk with a certain rate of return. According to Harnovinsah and Sustari (Harnovinsah & Alamsyah, 2017), One of the sources of internal company financing for investment is profit generated from operating activities. Thus, investors will form an efficient portfolio. (Jiang, Liu, & Yang, 2019) defines investment in more detail, namely expenses in a certain period which are equivalent to the purchase value of fixed assets, intangible assets, and other long-term assets plus net cash paid to acquire subsidiaries and other business units. This value is then reduced by net cash paid to dispose of fixed assets, intangible assets, and the cost of asset recovery and other long-term depreciation costs. Then, the remaining value from the calculation is divided by the total assets at the beginning of the period.
According to Ghazali, et al (2015) by conducting this free cash flow study, managers are expected to invest in profitable projects instead of letting them not be exploited. There is a significant relationship between opportunistic behavior. The presence of effective and efficient monitoring and disciplinary action by institutional shareholders, lenders, boards of directors, audit committees and others can retain company managers with free cash flow and low growth opportunities to invest in wasteful investments. (Scott & O’Brien, 1997) (2015) An understanding of earnings management is important for accountants, because it allows a better understanding of the usefulness of net income, both for reporting to investors and for contracts. It can also help accountants to avoid some serious problems. Legal and reputational consequences that arise when companies become financially stressed. Debt costs relate to potential bankruptcy costs. Increasing debt holdings compared to equity increases the probability of default as the fraction of ownership of assets backed by equity decreases.
METHOD
The sample is a portion of the population consisting of a number of selected members of the population (Sekaran and Bougie,2013). The samples in this study were determined using purposive sampling, i.e. sample selection according to certain criteria applied based on research objectives (Leia,2018). The samples in this study are:
- Manufacturing companies registered with IDX during the period 2016-2017.
- Manufacturing companies report complete data on all research variables.
- Manufacturing companies that publish financial statements in rupiah.
- Companies based on Altman Z-score calculations are classified as healthy companies
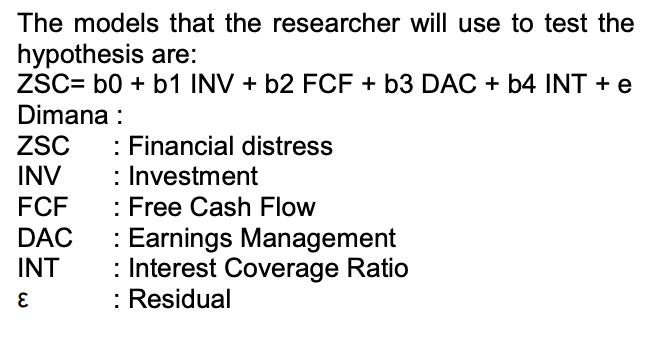
The models that the researcher will use to test the hypothesis are:
RESULT AND DISCUSSION
33 Manufacturing companies that have healthy financial distress results during the 2016- 2017 period, and from the data that has been collected, investment is seen as the right measuring tool to reduce agency conflicts that cause high agency costs. Table 4.1 shows that the minimum value is -0.5245 or -52%, at the Semen Baturaja Company (Persero) Tbk (SMBR) in 2016, Manufacturing Basic Industry & Chemical Sector, Cement Sub-sector. The minus sign here means that the company has issued new funds from the purchase of new assets, it is assumed that the company has funds to purchase additional new assets, it can be used to add machinery / equipment for merchandise, in order to increase the business activities of manufacturing companies. The maximum value on the investment variable is 1.1792 or 118% in the company Indofood Sukses Makmur Tbk, PT (INDF), meaning that in cash flow investment funds, INDF has allocated funds amounting to 118% of total assets in 2016. Mean - 0.0623 and Standard deviation 0.17549.
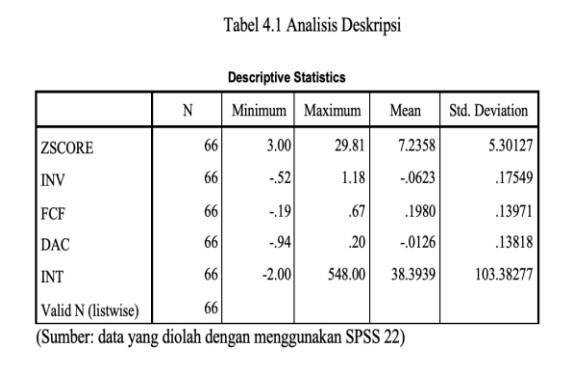
Table 4.1 shows that the minimum value of free cash flow is -0.1875 or -19%, at the Indofarma Company (Persero) Tbk (INAF) in 2016, Manufacturing in the Consumer Goods Industry Sector, Pharmaceutical Sub-sector. The minus sign here means that the company is overbudget for operational and investment costs, it is assumed that the company realizes operational activities and investments that have not been included in the budget at the beginning of the year so there is a minus. The maximum value for the free cash flow variable is 0.67 or 67% at Multi Bintang Indonesia Tbk, PT (MLBI). This means that in free cash flow, MLBI still has cash of 67% of total assets in 2016. Mean: 0.1980 and standard deviation: 0.13971.
Earnings management has a minimum value of -0.94 or -94%, at the Alaska Industrindo Tbk (ALKA) Company in 2016, the Basic Industry & Chemical Manufacturing Sector, the metal subsector and the like. The minus sign here means that the company has used earnings management policies in accounting records in the financial statements and the result is -94%. The maximum value of the earnings management variable is 0.20 or 20% in the company Indofarma (Persero) Tbk, PT (INAF), meaning that the company has used earnings management policies in accounting records in financial statements of 20% of total assets in 2016. Mean : -0.0126 and Standard deviation: 0.13818.
The debt interest ratio shows that the minimum value is -1.74 or -174%, at Indofood СВР Sukses Makmur Tbk, PT (ICBP) in 2017, Manufacturing in the Consumer Goods Industry Sector, Food and Beverage Sub-sector. The minus sign here is because the company's EBITDA is Rp. - 48,912,133,851 then divided by interest expense of Rp. 28,179,335,746, so the result is -174% interest coverage ratio. The maximum value in the interest coverage ratio variable is 548.00 or 54800% at Ultrajaya Milk Industry and Trading Company Tbk, PT (ULTJ). This means that the company is not burdened by debt because it can be seen from the interest coverage ratio it has very sufficient when viewed from the EBITDA value of the company.
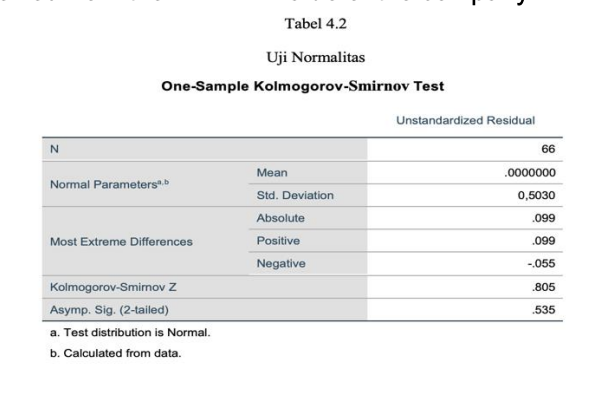
Based on table 4.2 shows the independent variables consisting of investment, free cash flow, earnings management and interest coverage ratio have data that are normally distributed. This can be seen in the value of Asym, Sig. (2-tailed) that the significance value of 0.535 is greater than the level of significance of 5% or 0.05. This indicates that the residuals are stated to be normally distributed. Thus the normality assumption is fulfilled.
From the picture 4.1 show the dots do not converge only above or below, the spread of the dots does not form a wavy pattern then narrows and widens again and the spread of the dots is not patterned. So it can be concluded that the variable investment, free cash flow, earnings management and interest coverage ratio does not occur heterocedasitisity or the data used is free from heterocedasiticity and is feasible to be used in research.
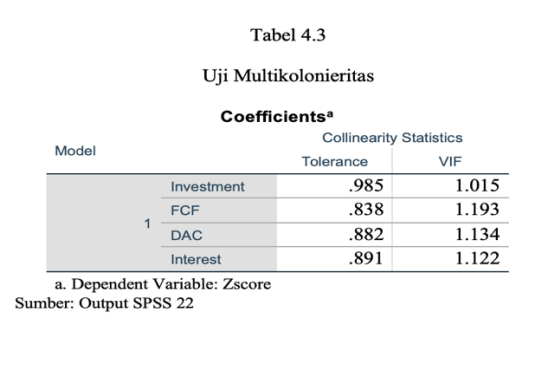
Based on the test results using SPSS 22 shown in table 4.3, it is known that the tolerance value of the regression model shows that there are no independent variables that have a tolerance value less than 0.1 (10%) and a variance inflation factor (VIP) value of more than 10. So This means that there is no muticollinearity between the independent variables, namely investment, free cash flow, earnings management and interest coverage ratio.
The DW value is 1.502, this value will be compared with the DW table value. Based on the DW table, with a sample size of 66 and the number of independent variables 4, the DW table values are dl = 1.4758 and du = 1.7319. Because the DW value is 1.502, it can be concluded that there is no autocorrelation.
The value of R Square in table 4.5 is 0.231 which means 23.1%, this means that the variation in the dependent variable, financial distress which can be explained by the independent variable, investment, free cash flow, earnings management and interest coverage ratio is 23.1%, while the remaining 76.9% is explained by other variables which are not included in the regression model in this study. So it can be concluded that investment, free cash flow, earnings management and interest coverage ratio have an effect of 23.1% on financial distress, while the remaining 76.9% is influenced by other variables not examined.
- Hypothesis testing 2
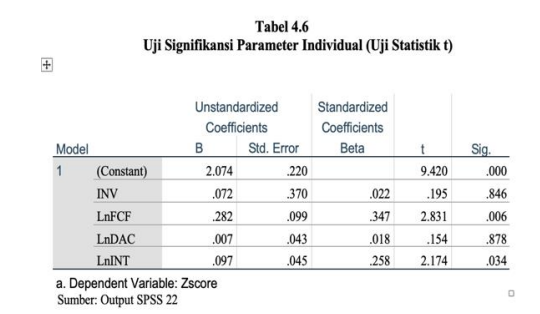
H2: Free Cash Flow affects financial distress. The partial test results show that Free Cash Flow has a positive and significant effect on financial distress, where the coefficient value is 0.347 (standardized beta) with t count 2.831 and significant 0.006 at 0.05. In other words the test accepts H2.
- Hypothesis testing 3
HO: Earnings Managements has no effect on financial distress. The partial test results show that earnings management has no significant effect on financial distress, where the results of earnings management are in financial distress with a coefficient value of 0.018 (standardized beta) with t count 0.154 and not significant 0.878 at 0.05. In other words, the test rejects H3
- Hypothesis testing 4
H4: Interest Coverage Ratio affects financial distress. The partial test results show that the Interest Coverage Ratio has an effect on financial distress, where the beta coefficient results show a coefficient value of 0.258 (standardized beta) with t count 2.174 and significant 0.034 at 0.05. In other words the test accepts H4.
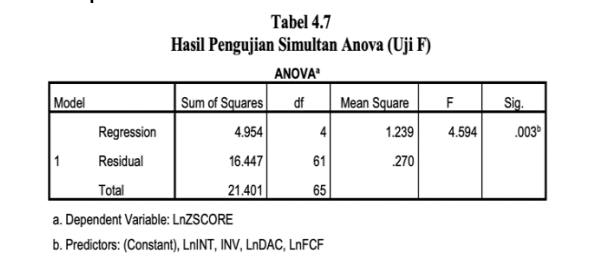
Based on Table 4.7, the results of the regression analysis show that investment, free cash flow, earnings management and interest coverage ratio simultaneously (simultaneously) affect the dependent variable, namely financial distress. This can be proven from the significance of the F-test value of 0.003, where the significance value is less than 0.05 or 5%.
Y=2.074+0.072X1+0.282X2+0.007X3+0.097X4
So from each of the independent variables it can be interpreted that the effect on financial distress is as follows:
- A constant of 2.074 means that if the regression coefficient of the investment variable, free cash flow, earnings management and interest coverage ratio or the independent variable is zero (0), then the financial distress coefficient (Y) is positive, which is 2.074.
- The investment regression coefficient (XI) is positive and the amount is 0.072, which means that if the investment increases by 1 unit, the coefficient of financial distress (Y) will increase by 0.072. The coefficient is positive means that there is a positive relationship between investment and healthy financial distress (Y).
- The free cash flow regression coefficient (X2) is positive and the amount is 0.282, meaning that if free cash flow increases by 1 unit, the free cash flow rate coefficient (Y) will increase by 0.282. The coefficient is positive, meaning that there is a positive relationship between free cash flow and healthy financial distress (Y).
- The regression coefficient of earnings management (X3) is positive and the amount is 0.007, meaning that if earnings management has increased by 1 unit, then the coefficient of financial distress (Y) will increase by 0.007. The coefficient is positive, meaning that there is a positive relationship between earnings management and healthy financial distress (Y).
- The regression coefficient of interest coverage ratio (X4) is positive and the amount is 0.097, meaning that if the interest coverage ratio increases by 1 unit, the coefficient of financial distress (Y) will increase by 0.097. The coefficient is positive, meaning that there is a positive relationship between the interest coverage ratio and healthy financial distress (Y).
Discussion
Based on the results of statistical tests and significance, it is known that investment has no significant effect on healthy financial distress with hypothesis H1 is rejected. The results of this study support the research conducted by Appendini (2018) and Gutierez (2014) that investment has played an optimal role in increasing financial distress in the category of healthy companies in 66 research samples. A company that is healthy, has good trading skills, so that it considers continuing a going concern in its business industry, as a result cash or funds owned by the company may not choose to invest either in fixed assets, financial instruments, and other investment categories. Because it is better to continue to develop product introduction to the wider community, thereby increasing company profits.
The results of this study indicate that free cash flow in the financial distress category of healthy companies has a significant effect, meaning that free cash flow in the company is still quite a lot after many previous expenses.
According to (Nouri & Gilaninia, 2017) the relationship between agency theory and free cash flow is when managers try to maximize their wealth, this context provides that they can benefit from free cash flow themselves.
In this study, it shows that companies that are in a safe zone or healthy category do not have a significant effect on earnings management and healthy financial distress. Because these companies have implemented accounting policies well and there is no significant thing happening on earnings management activities in these companies. In the results of this study, the interest coverage ratio has a significant effect on financial distress in the category of healthy companies, because healthy companies are affected by debt interest. The management of a healthy company is good enough at managing debt obligations so that the interest on the debt that must be paid also does not have a major impact on the company's cash flow
CONCLUSON
So from this research it can be concluded that, investment that focuses more on business that is looking for profit can provide opportunities in a situation of financial difficulties such as participating in the capital market (money market) through fixed income such as coupons, and others that are more certain, return on returns, not investing in fixed asset products, long term assets. Then, free cash flow is the company's strength to carry out company operations. Furthermore, earnings management does not always mean fraud, earnings management includes restoration of accounting and estimates in accordance with generally accepted principles. The effect of the interest coverage ratio shows the effect on financial distress in the category of healthy companies. The positive direction of the interest coverage ratio shows that the greater the interest coverage ratio, the financial distress in a healthy company. Then the company is able to maintain cash flow in order to keep paying its debt interest obligations and consider reducing debt and avoiding agency problem activities according to agency theory.
- For researchers can further re-examine the influence of variable investment and earnings management on financial distress by using different variable measurement methods.
- In an effort to prevent bankruptcy the company is advised to pay attention to free cash flow and interest coverage ratio and still pay attention to investment and earnings management which in theory affects financial distress.
- Investors are expected to pay attention to accrual information presented in the company's financial statements related to profit management practices in order to reduce the risk of losses that investors will bear.
REFERENTS
- Altman, E. I. (1968). Financial Ratios, Discriminant Analysis, and The Predicton of Corporate Bankruptcy. The Journal of Finance, XXIII.
- Altman, E. I., & Hotckhkiss, E. (2006). Corporate Financial Distress and Bankruptcy. New Jersey: John Wiley.
- Appendini, E. G. (2018). Financial Distress and Competitor Investment. Journal of Corporate Finance, 182-209.
- Campa, D. (2019). Earning management strategies during financial difficulties: A comparison between listed and unlisted French companies. Research in International Business and Finance, 457-471.
- Danso, A., Lartey, T., Amoah, J., Adomako, S., Lu, Q., & Uddin, M. (2019). Market Sentiment and Firm Investment Decision-Making. International Review of Financial Analysis.
- Dechow, P. M. (1994). Accounting Earning and Cash Flow as Measures of Firm Performance. Journal of Accounting and Economics 18 Elsevier, 3-42.
- Dothan, M. (2006). Cost of Financial Distress and Interest Coverage Ratio. The Journal of Financial Research Vol. XXIX No. 2, 147-162.
- Gebauer, S., Setzer, R., & Westphal, A. (2018). Corporate Debt and Investment: A Firm-Level Analysis for Stressed Euro Area Countries. International Money and Finance.
- Gutierrez, C. L., Azofra, S. S., & Olmo, В. T. (2014). Investment Decision of Companies in Financial Distress. Business Research Quarterly, 14.
- Harnovinsah, & Alamsyah, S. (2017). The Meditation Influence of Value Relevance of Accounting Information, Investment Decision and Dividend Policy on the Relation Between Profitability and the Company Value. The Mediation Influence of Value Relevance of Accounting 21 (2), 170-183.
- Jensen, M. C., & Meckling, W. H. (1976). Theory of the Firm: Managerial Behaviour, Agency Costs, and Ownership Structure. Journal of Financial Economics, 305-360.
- Jiang, J., Liu, B., & Yang, J. (2019). The Impact of Debt Restructuring on Firm Investment: Evidence from China. Economic Modelling, 325-337.
- Kementerian Perindustrian. (2019, Februari 15). Siaran Pers. Retrieved from Kementerian Perindustrian Republik Indonesia: https://kemenperin.go.id/artikel/20288/Penyerapan-Tenaga-Kerja-lndustri-Manufaktur-Terus-Meningkat#:~:text=%E2%80%9CPada%20tah un%202018%2C%20sektor%20industri,Jumat %20(15%2F2)
- Kim, S. T., & Rescigno, L. (2017). Monetary Policy Shocks and Distressed Firm's Stock Returns: Evidence from the Publicly Traded U.S. Firms. Economics Letters 160, 91-94.
- Nouri, S., & Gilaininia, B. (2017). The Effects of Surplus Free Cash Flow and Audit Quality on Earning Management. International Journal of Economics and Financial Issues, 270-275.
- Patunrui, K., & Yati, S. (2017). Analisis Penilaian Financial Distress Menggunakan Model Altman (Z-Score) Pada Perusahaan Farmasi Yang Terdaftar di Bursa Efek Indonesia Periode 2013-2015. Jurnal Akuntansi, Ekonomi, dan Manajemen Bisnis 5, 55-94.
- Scott, W. R. (2009). Financial Accounting Theory 5th Edition. Waterloo: Pearson.
- Setiany, E., Hartoko, S., Suhardjanto, D., & Honggowati, S. (2017). Audit Committee Charasteristic and Voluntary Financial Disclosure. Review of Integrative Business & Economics Research 6, 239-253.
- Shamsudin, A., & Kamaluddin, A. (2015). Impending Bankruptcy: Examining Cash Flow Pattern of Distress and Healthy Firms. Procedia Economics and Finance, 766-774.
- Srinivasan, & Sundari, T. (2011). Dimension of Financial Performance of Cement Units in South India - An Empirical Study (Z-Score Analysis). International Journal of Research in Commerce and Management, 7.
- Tran. (2019). Financial Crisis, Shareholder Protection and Cash Holdings. Research in International Business and Finance.
Related Articles
Patrick Velte
Jakob Issa