This article is published under a Creative Commons license and not by the author of the article. So if you find any inaccuracies, you can correct them by updating the article.

The impact of market orientation on business performance – the case of Tatarstan knowledge-intensive companies (Russia)


Ekaterina Protcko
Utz Dornberger
Published: Nov. 19, 2014
Latest article update: Dec. 8, 2022
This article is published under the license


Abstract
The article provides a direct test of the applicability of a western paradigm to Russia – a country with a different cultural and economic system. This article aims to give knowledge-intensive companies in Tatarstan (Russia) a better understanding about influence of their level of market orientation on business performance. This study validated Kohli and Jaworski’s market orientation scale in knowledge-intensive industries, particularly in small and medium knowledge-intensive companies in Russia. The findings show that the market orientation has a positive impact on nancial and non-financial business performance in knowledge-intensive industries. It is important for hi-tech companies to improve their performance by implementing market orientated strategies, putting emphasis in conducting effective market research and be strong in customer and competitor orientation
Keywords
Business performance, Tatarstan, knowledge-intensive companies, market orientation
Introduction
Small and new high technology ventures are often described as technology focused, as opposed to being market oriented, and there is a call for a more market oriented approach in technology based new ventures. However, the current understanding of market orientation of an organization is based on research mostly conducted in an era of mass production, increasing consumption, excess supply over demand, and branding which has an impact on the generalization of the current theoretical constructs. The complicated environment surrounding high-tech companies creates a great need for sophisticated marketing strategies. Yet these companies continue to have under-developed competencies in marketing and in understanding customer needs. Understanding the issues of market orientation provides managers of small, knowledge-intensive firms with a better understanding of the nature and sources of market orientation in their organizations and will help them in developing more market oriented high technology ventures [16].
1. Literature review
1.1. Knowledge-intensive companies. It is difficult to find a precise definition for knowledge-intensive organizations even though there is a lot of literature on this subject. However, knowledge-intensive organizations can be recognized from the following characteristics such as, first, their most valuable asset is intellectual capital - physical assets, such as machinery are of secondary importance; second, gathering and applying new information and knowledge is essential for the success of the organization; they are flexible, adaptive, and they have low organizational hierarchies; they produce mass customized products and services using close relations with their customers, suppliers and strategic partners [4].
1.2. Market orientation. The concept of market orientation has received great attention in the recent years from the side of scientists and practicians in many countries. Narver and Slater (1990), who put emphasis on the content of the construct, considered market orientation as “the organizational culture that most effectively and efficiently creates the necessary behaviors for the creation of superior value for buyers and, thus, superior performance for the business” [10].
Another concept is initiated by Kohli and Jaworski. They developed a process-driven model that emphasizes the stages of generating, disseminating and responding to market intelligence as the essence of market orientation [8]. They defined market orientation concept through three basic components (processes) dealing with marketing information, those are Generation of marketing intelligence all over the company pertaining to customer needs, the Dissemination of intelligence across functions in the company, and the organizational responsiveness to this market.
After Kohli and Jaworski (1990) and Narver and Slater (1990), many other marketing scholars all over the world adopt their conceptual basic to develop the theory of market orientation, such as Greenley (1995), Pelham (1997), Chan and Ellis (1998), Baker and Sinkula (1999), Farrell (2000), Shoham and Rose (2001), Hult et al. (2003), Ellis (2005) and many others.
In this study the definition of market orientation that was given by Kohli and Jaworski is used.
1.3. Business performance. Although the concept of business performance has a variety of meanings (e.g. short- or long-term, financial or organizational benefits), in the literature it is broadly viewed from two perspectives, those are subjective and objective methods.
The subjective method is primarily concerned with the performance of firms relative to their own expectations or assessments [14] or relative to the competition [5].
The second method is the objective concept which is based on absolute measures of performance. Objective measures relate mainly to financial measures, e.g. return on assets (ROA), return on equity (ROE), return on investments (ROI), growth in sales, growth in profit and other indicators. This study uses the subjective approach because of the difficulty in obtaining objective data from documentary sources and the unwillingness of organizations to reveal such truthful information.
1.4. Relationship between market orientation and business performance. The relationship between market orientation and business performance has been studied by many researchers. Most of them agreed that market orientation has positive effect on business performance such as new-product success [10], sales growth [14], profitability [8, 15], profitability levels or return on investments (ROI) of small firms [2]. A direct link between the level of market orientation in US firms, at the strategic business unit (SBU) level, and performance has been confirmed in a number of studies [8,10]. Narver and Slater (1990) conducted a study within a single industry suggesting that market orientation is related to return on assets (ROA). Jaworski and Kohli (1990) found that market orientation is positively related to overall firm performance. It is widely known that a number of studies having as a starting point the studies of the above-mentioned scholars were undertaken in order to test the relationship between the market orientation and organizational performance. Deshpande et al. (1993) empirically investigated this relationship in Japan. It has been found that the association between market orientation and sales, profitability, ROA and overall performance is significant in a German context. Pitt et al. (1996) conducted a study in UK and Malta and found that the level of market orientation positively affects financial performance i.e. ROCE and sales growth [12].
These researches used the assumption that market orientation provides a firm with a better understanding of its environment and customers, this can lead to more satisfaction of customers. Some researches highlighted the significance of including market orientation in an integrated model of determinants and performance.
In contrast with these researches, some studies did not support a direct positive relationship between market orientation and business performance (Kohli and Jaworski, 1993); Greenley (1995); Perry and Shao (2002), Langerak (2001) also used self-reports, customer reports and supplier reports to test the relationship between the manufactures’ market orientation and its business performance.
As the target group for this study were small and medium knowledge-intensive companies, it would be important to know what is the relationship between market orientation and business performance in SMEs.
Most of the studies support a direct and positive relationship between MO (or its components) and performance in SMEs [15]. Reasons exist to believe that the МО-Performance relationship might be generally stronger in SMEs as compared to larger firms. Pelham argues that smaller firms can “leverage their potential advantages of flexibility, adaptability, and closeness to their customer base into superior, individualized service” (p. 34). In one study examining the МО-Performance relationship in the hospital industry, Raju et al. find the relationship to be significantly stronger for smaller hospitals than for larger hospitals [15].
The interest in this research is to find out the influence of market orientation on business performance in developing countries and countries with transitional economies. There are some examples of researches which were done in these countries: the study of Sin et al. (2005) that was conducted in hotel industry in Hong Kong; the study of Appiah-Adu (1998) in Ghana. Also there are studies of Lai et al. (1992) from Taiwan and Ghosh et al. (1993) from Singapore. Au and Tse (1995) have conducted the research about market orientation and business performance in Hong Kong and New Zealand. There is also the only study from Russia that was found. It was done by Smirnova (2011). The results of most of the studies show the positive association between market orientation and business performance. And only some of them, such as the study of Au and Tse (1995) did not find any association.
In summary, most of the articles agreed that there’s a positive relationship between market orientation and business performance, despite of some unclear cases for this relationship. Maybe the possible reason for the lack of clear relationship between business performance and market orientation is that it is a more complex relationship than those have been tested in previous studies [13].
2. Objective of the study
Although there are numerous studies related to market orientation and its impact on business performance in European countries and in the USA, in Russia this topic is not well-promoted and developed. The mechanisms as to how the different aspects of market orientation (MO) achieve these positive outcomes are less well conceptualized; and virtually no research exists on understanding how MO works in countries with transitional economies such as Russia and China [1, 5, 6]. The positive effect of market orientation on business performance has been proved in free market-oriented in U.S., in western companies, but is there any impact of market orientation on business performance on the knowledge-intensive companies in Russia? After economic restructuring in Russia, since 1990s the knowledge-intensive companies work under market condition, which were completely new phenomena after planned economy. They did not have any experience and knowledge how to work with customers and compete on the market with others. After two decades it would be useful to analyze, how are they handling this situation. Therefore the main objective of the study is to find out the impact of the market-orientation of the knowledge- intensive companies on their business performance.
3. Study methodology
3.1. Development of instruments and measurement methods. Dependent and independent variables are used in the research. Independent variables are adapted from MARKÖR scale of Kohli, Jaworski and Kumar (1993) [7]. They are intelligence generation, intelligence dissemination and responsiveness. Totally 21 items are identified, including 7 items for intelligence generation, 5 items for intelligence dissemination and 9 items for responsiveness. All these items use 5-point Likert scale to measure the level of market orientation. The respondents have indicated the degree of how much they agree with the statement about market orientation’s performance in their companies. The scale varies from number 1, which means “strongly disagree”, to number 5 with the meaning of “strongly agree”.
Dependent variable of the model is business performance. The 11 items for business performance are adapted from Ali Kara et al. (2005). These 11 items are measured by 7-point scale, where number 1 means “much lower” and number 7 means “much higher” relative to major competitors.
The indicators for intelligence generation, intelligence dissemination, responsiveness and business performance are represented in Table 1.
Table 1. Indicators for intelligence generation, intelligence dissemination, responsiveness
Dimensions | Indicators |
Intelligence generation | 1. Frequency of doing customers’ need analysis. 2. Ability of interaction between service department and customers. 3. Ability to adapt customers’ preference changes. 4. Frequency of doing product’s quality analysis. 5. Ability to adapt environment’s changes. 6. Frequency of reviewing the effect of changes in business. 7. Environment. |
Intelligence dissemination | 1. Frequency of exchanging market information in firm. 2. Sharing information level of marketer with other units in firm. 3. Quick-witted ability of the whole firm with major importance about customer or market. 4. Ability of sharing data on customer satisfaction in all levels of firm. 5. Ability of sharing data on competitors. |
Responsiveness | 1. Ability of attention to competitors’ actions. 2. Ability of attention to customers’ needs. 3. Frequency of reviewing product in comparison with customers’ needs. 4. Ability of coordination between departments in firms to plan a response to changes of business environment. 5. Ability to implement a response to competitors immediately. 6. Ability of coordination between difference units in firm. 7. Ability of attention to customers’ complaints. 8. Ability to implement a marking plan on time. 9. The concert of departments to modify a product/service for customers. |
Business performance | 1. Financial performance (market share growth, sales volume, ROI, ROE, operating income, net income). 2. Non-financial performance (success in achieving customer satisfaction, success in retaining current customers, success in attracting new customers, success in building a positive image and overall performance of a company). |
This study chooses the high-tech companies located in Kazan as a sample for this research. The author could reach 62 feedbacks in a survey which was contact from October to December in 2010. The companies are working in different sectors like chemical, biotechnology, engineering and oil industries.
3.2. Data assessment Collected data was transferred into SPSS statistics program for further analysis. To find out the impact of market orientation on the business performance of knowledge-intensive companies in Kazan the correlation analysis was applied. Before coming to the data analysis, the data was tested for normality. Kolmogorov-Smirnov test was used for this. The reliability analysis of constructs was done using Cronbach’s Alpha. Correlation analysis was done using Pearson coefficient. FinaUy regression analysis was applied in order to determine the level of relationship between the market orientation and business performance.
4. Results of the study
4.1. Reliability analysis and test for normality. The reliability of the grouped items was tested to provide the validity of questions measuring variables in the research. For this purpose the Cronbach’s Alpha test was used. The results are represented in Table 2.
Table 2. Reliability results on the basis of Cronbach’s Alpha
№ | Variable | Cronbach’s Alpha |
1 | Intelligence generation | 0.713 |
2 | Intelligence dissemination | 0.722 |
3 | Responsiveness | 0.774 |
4 | Business performance (financial) | 0.965 |
5 | Business performance (non-financial) | 0.958 |
According to Table 2 Cronbach’s Alpha values varies from 0.713 to 0.965, that is higher than 0.7. Thus the questions used to measure variables in this research show the high reliability and meet the standards recommended for research purposes. To test the data distribution the Kohnogorov-Smimov test was used. According to the results of this test the data are distributed normally.
4.2. Correlation analysis between market orientation indicators and business performance. The correlation analysis between independent variables (market orientation’s components) and dependent variables (business performance financial, business performance non-financial and business performance overall) is carried out. Correlation analysis will help to find out, if relationship between variables exist and how strong it is. The Pearson correlation coefficient was used as the data is normally distributed. The correlation details are represented in Table 3.
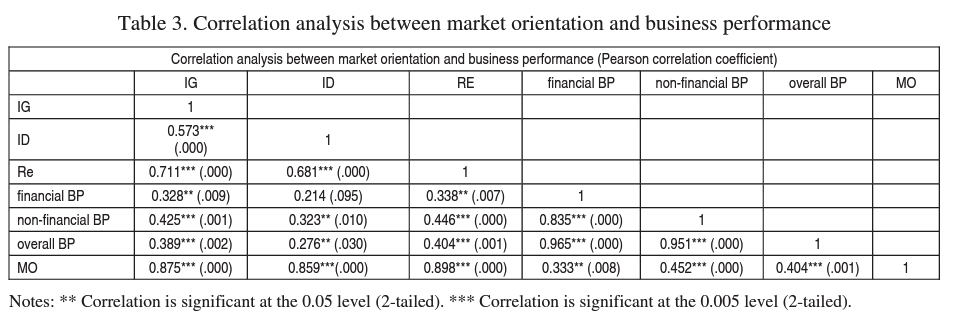
According to the results from the table, there is a significant correlation among all indicators except financial business performance and intelligence dissemination.
There is a significant correlation between financial business performance and intelligence generation and responsiveness. However, the correlation is weak (0.328 and 0.338). Financial business performance and intelligence dissemination are not significantly correlated (significance is 0.095 that is higher than 0.05).
There is a significant correlation between non- financial business performance and all components of market orientation. Correlation of non-financial business performance is weak (but close to moderate) with intelligence generation (0.425) and responsiveness (0.446). Correlation between non-financial business performance and intelligence dissemination is pretty weak (0.323).
There is weak (but close to moderate) correlation between overall business performance with intelligence generation (0.389) and responsiveness (0.404). The correlation between overall business performance and intelligence dissemination is pretty weak with the correlation coefficient 0.276.
The correlation between market orientation and non- financial business performance (0.452) is higher than correlation between market orientation and financial business performance (0.333).
Totally, there is the weak (but close to moderate) correlation between market orientation and business performance (0.404). Moreover, all of the components of market orientation are intercorrelated and even stronger than with business performance.
4.3. Regression analysis. Additionally a regression analysis to measure the strength of the relationship between market orientation and business performance were carried out.
The results of regression analysis are shown in Table 4.
Table 4. Regression analysis
Panel A. Dependent variable: Business performance
| Unstandardized coefficients | Standardized coefficients | T | Sig. | |
В | Std. error | Beta | |||
(Constant) | 1.178 | .855 |
| 1.378 | .173 |
Market orientation | .829 | .242 | .404 | 3.426 | .001 |
R | R square | Adjusted R square | Std. error of the estimate | F-value | |
F | Sig | ||||
.404(a) | .164 | .150 | 1.18904 | 11.735 | .001 |
The results show that market orientation is significantly correlated with business performance. The relationship between them is moderate with R = 0.404. Only 16.4% of the variance in the business performance can be explained by market orientation (R2 = 0.164). However, the value of F = 11.795 and is significant at 0.001 level (less than 0.05). This indicates that the model is acceptable and market orientation explains well business performance. Moreover, the T value equals 3.426 and is significant at 0.001 that means this independent variable is significantly contributing to the equation indicate that market orientation contributes significantly to the prediction of business performance.
Nevertheless, market orientation is not only the dominating factor explaining to influence business performance. It explains only 16.4% of business performance.
Conclusion
To better understand the meaning of results it is worth comparing them with findings from other researches.
The study conducted by Consuegra and Esteban (2007) investigates potential influence of market orientation on airline performance. The results support the positive influence of market orientation on business performance. Their findings confirm that market orientation is a key element of business performance for the airline industry [9]. The results of this study show that all of the variables of market orientation have almost the same influence on business performance. In comparison with the findings of this study, our results show the lower correlation between intelligence generation, intelligence dissemination, responsiveness and business performance. Particularly in our study, correlation between intelligence dissemination and business performance is very weak (0.268) relative to the quite high correlation (0.564) in Consuegra and Esteban (2007) study. The reason for such differences could be the fact that there is high competition in airline industries in comparison of high-tech industries. The level of how airline companies work with the information about customers and competitors, how they fulfill their wishes and respond to the competitors’ campaign highly influence their business performance.
In the study of Panigyrakis and Theodoridis (2007) they have investigated the relationship between market orientation and business performance in retail industry. Retail business performance was measured following the logic of Venkatraman and Ramanujam (1986). In other words they measure financial and non-financial performance. The findings suggest that retailers in Greece implement market orientation. The study clearly demonstrates a positive effect of market orientation on retail performance, both financial and non-financial [9]. These are the same results in comparison with high- tech companies, where there is also positive influence of market orientation of financial and non- financial business performance.
The study of Sin et al. (2005) investigated the relationship between market orientation and business performance in hotel industry in Hong Kong. In this study the concept of Narver and Slater was used. Nevertheles, the findings of the study indicate that a firm’s degree of market orientation is positively associated with financial performance (ROI, ROS, sales growth and market share) and marketing performance (customer retention, customer satisfaction and trust) in the hotel industry. This finding supports the finding of prior empirical research that market orientation is a factor in determining organizational effectiveness [17]. To measure the influence of market orientation on business performance the authors used the regression analysis. According to their results betta coefficient is 0.683 and R2 is 0.491. In our study the results of these indicators are the following: betta coefficient is 0.404 and R2 is 0.164. That shows market orientation in hotel industry plays bigger influence on business performance than in high-tech companies. That is also could be explained with the fact that in hotel industry (as a service) the market orientation plays crucial role in responding to business performance.
In the article of Raju (2011) the summary of researches which investigated the relationship between market orientation and business performance in SMEs is presented [15]. Generally, the МО-Performance correlations in these studies range from .20 to .44 [13, 14]. The correlation coefficient between MO and performance in small and medium high-tech companies in Kazan is 0.404 that also fits to the above-mentioned statistics. Only three studies, those by Becherer and Maurer (1997), Demirbag et al., 2006 and Keskin, 2006) did not find a direct positive relationship between MO and firm performance. However, two of these studies (Demirbag et al. (2006), Keskin (2006)), in fact, did find evidence for an indirect positive relationship between MO and performance when the analysis included mediating variables [15].
The study from Ghana represents the findings about influence of market orientation on company’s performance. Due to the non-significant impact of market orientation on performance, hypothesis about the positive influence of market orientation on business performance is rejected [2]. This is inconsistent with the findings of similar research in developing economies (e.g. Caruana et al., 1995; Bhuain, 1996), but is partially supported by Golden et al. (1995) study in a country undergoing transition from a centralized economy to a free market.
There are few researches available that reinforce the widely-held perception that successful Asian firms, and in particular Japanese firms, are highly market- oriented. In one study Deshpande et al. (1993) investigated the customer orientation-performance relationship based on matched “dyad pairs” or “quadrads” of Japanese manufacturers and their customers. That is, 50 sets of interviews were held both with two executives from a selling firm and with two executives from a customer firm of that supplier firm. Interestingly, they found support for the market orientation-performance relationship but only when marketing effectiveness was based on customers’ subjective appraisals. Based on managers’ reports of their own company’s customer orientation, no relation with performance was observed. The lack of a correlation between managers’ and their own customers’ assessments of the firm’s degree of customer orientation is curious, and is attributed by the authors to Japan’s strong consensus culture which may make it difficult for some managers to be self-critical about their firm’s degree of customer orientation. Another possibility raised is that many marketing managers simply do not know how customer-oriented their firms really are [3].
In the study of Lai et al. (1992) it was surveyed 777 Taiwanese executives and, based on respondents’ self assessments, split their sample into successful and less successful companies to examine differences in their marketing practices. The 104 firms labelled as the better performers were found to be more marketing-oriented than the other firms in the sample. A similar methodology was used by Ghosh et al. (1993) to examine the marketing effectiveness of 161 Singaporean companies drawn from a cross-section of industries. Again, the better performers were found to be more committed to marketing than other firms [3].
The research that was conducted in Russia investigates the role of market orientation as an antecedent for the development of relational capabilities and performance in Russian industrial firms. Their path estimations show that they have a significant effect on firm performance. While the relationships between customer orientation and interfunctional coordination on the one hand, and firm performance on the other are non-significant, competitor orientation has a relatively strong and positive effect on business performance (0.355, with a p < 0.01). That means with regard to direct effects only one of the three components of MO has a significant effect on firm performance [17].
Their results show that positive aspects relating to market sensing in Russia are not so much about developing a customer orientation, but mainly about understanding competitors’ actions. This result therefore contributes to our understanding of the specifics of Russian industrial firms which is reflected in adaptation to the characteristics of the Russian transitional economy, specifically by exploiting opportunities via extensive growth strategies vis-a-vis competitors.
As a conclusion, the results of the study contribute to the previous studies showing the positive relationship between market orientation and business performance, particularly in the transitional countries.
Recommendation
The results obtained from this study should be helpful for the CEOs of the knowledge-intensive companies in Kazan to develop the appropriate market-oriented strategy for them and show the better performance of their companies. The results of Smirnova et al. (2011) study could be appropriate for knowledge-intensive companies in Kazan.
The first area of managerial concern focuses on developing a competitor orientation. There has not been a high need for competency in this area due to the former central planning, thus, there is some leeway to developing such skills and resources [18]. With the freeing up of the economy, there will be more competition from both local and also multinational competitors, implying a greater need to monitor business network activities (Ma et al., 2009).
Smirnova (2011) assumes that within 3 constructs of market orientation, customer orientation needs to be managers’ main area of focus. Customer orientation is a skill that a highly planned economy did not require (Farley & Deshpande, 2005). Thus, Russian managers can use this as a lever to enhance their firms’ ability to interact within business networks by building relational capabilities. Developing such relational skills represents the third implication: as we have argued above, in a planned economy personal relationships played an important role [18]. With a freer hand in deciding with whom to do business, managers within Russian companies need to develop their own abilities to interact with economic counterparts - not just learning to interact “better” but also learning to chose better - i.e. identifying those potential partners that can enhance business performance the most (Butler & Purchase, 2008).
References
- Akimova, I. (2000). Development of market orientation and competitiveness of Ukranian firms, European Journal of Marketing, 34 (9/10), pp. 1128-1248.
- Appiah-Adu, K. (1998). Market orientation and performance: Empirical tests in a transition economy, Journal of Strategic Marketing, 6, pp. 25-45.
- Chan Hung Ngai, J. and Ellis, P. (1998). Market orientation and business performance: some evidence from Hong Kong international Marketing Review, 15 (2), pp. 119-139.
- Edvinsson, L. and Malone, M.S. (1997). Intellectual Capital: Realizing your Company’s True Value by Finding Its Hidden Brainpower, Harper Business, New York.
- Golden, P.A., Johnson, D.M. and Smith, J.R. (1995). Strategic orientation and marketing strategies in transition economies: A study of Russian firms, Journal of Strategic Marketing, 3, pp. 1-22.
- Greenley, G. (1995). Market Orientation and Company Performance: Empirical Evidence from UK Companies, British Journal of Management, (6), pp. 1-13.
- Kohli, A.K., Jaworski, B.J. and Kumar, A. (1993). MARKÖR: A Measure of Market Orientation, Journal of Marketing Research, 30, pp. 467-477.
- Kohli, A.K. and Jaworski, B.J. (1990). Market Orientation: The Construct, Research Propositions, and Managerial Implications, Journal of Marketing, 54, pp. 1-18.
- Martin-Consuegra, D. and Esteban, A. (2007). Market orientation and business performance: An empirical investigation in the airline industry, Journal of Air Transport Management, 13, pp. 383-386.
- Narver, J.D. and Slater, S.F. (1990). The Effect of a Market Orientation on Business Profitability, Journal of Marketing, 5, 20-35.
- Noble, C.H., R.K. Sinha and A. Kumar (2002). Market Orientation and Alternative Strategic Orientation: A Longitudinal Assessment of Performance Implications, Journal of Marketing, 66, pp. 25-39.
- Panigyrakis, G. and Theodoridis, P. (2007). Market orientation and performance: An empirical investigation in the retail industry in Greece, Journal of Retailing and Consumer Services, 14, pp. 137-149.
- Pelham, A.M. (1999). Influence of Environment, Strategy, and Market Orientation on Performance in Small Manufacturing Firms, Journal of Business Research, 45, pp. 33-46.
- Pelham, A.M. and D.T. Wilson. A. (1996). Longitudinal Study of the Impact of Market Structure, Firm Structure, Strategy, and Market Orientation Culture on Dimensions of Small-Firm Performance, Journal of the A cademy of Marketing Science, 24 (I), pp. 7-43.
- Raju, P.S. et al. (2011). Market orientation in the context of SMEs: A conceptual framework, Journal of Business Research.
- Renko, M. and Carsrud, A. (2003). Market orientation in the context of knowledge intensive high technology SMEs - operationalizing the concept in biotechnology, Available from: http://citeseerx.ist.psu.edu/viewdoc/down- load?doi=l0.1.1.126.3260&rep=rep1&type=pdf.
- Sin, Leo Y.M., Tse, Alan C.B., Heung, Vincent C.S., Yim, Frederick H.K (2005). An analysis of the relationship between market orientation and business performance in the hotel industry, Hospitality Management, 24, pp. 555-577.
- Smirnova, M. et al. (2011). The impact of market orientation on the development of relational capabilities and performance outcomes: The case of Russian industrial firms, Industrial Marketing Management, 40, pp. 44-53.
- Sydänmaanlakka, P. (2000). Älykäs organisaatio, Tiedon, osaamisen ja suorituksen johtaminen, Kauppakaari, Helsinki.
- United Nations Statistical Division. Availble from: http://unstats.un.Org/unsd/methods/m49/m49regin.htm#transition.
- Vagizova, V I., Klaas, J.A., Batarshina, A.F. (2013). Financial stability assessment of regional banking sector under modem conditions by means of operating procedures of its determination, Investment Management and Financial Innovations,
- Vagizova, V I., Lurie, K.M., Ivasiv, I B. (2014). Clustering of Russian banks: business models of interaction of the banking sector and the real economy, Problems and Perspectives in Management,
Related Articles
Simon Radipere
Shepherd Dhliwayo