This article is published under a Creative Commons license and not by the author of the article. So if you find any inaccuracies, you can correct them by updating the article.

Modelled realistic daily variation in low winter sea-ice concentration over the Barents Sea amplifies Asian cold events


Shengni Duan
Zhina Jiang
Min Wen
Published: Jan. 1, 2022
Latest article update: July 26, 2023
This article is published under the license


Abstract
The boreal wintertime atmospheric responses, especially cold events over central Asia, to low sea-ice concentration (SIC) with and without realistic daily variation over the Barents Sea are explored with the Community Atmosphere Model version 4.0 (CAM4.0). The results show that the general atmospheric responses to approximately equal winter-mean Arctic sea-ice loss with a similar pattern but with climatological versus realistic daily variation are different. With the forcing of low SIC with climatological daily variation, Asian cold events become a little longer and stronger than in the control experiment; this mainly results from the enhancement of a 500-hPa Ural anticyclonic anomaly. However, the low SIC forcing that includes realistic daily variability greatly intensifies central Asian cold events and the cyclonic anomaly downstream of the Ural anticyclone. Further analysis reveals that Asian cold events are closely associated with Arctic deep warming at an intraseasonal time scale, which is also the strongest in the perturbed experiment forced by low SIC with realistic daily variation. This work provides a better understanding of the linkage between sea-ice variation over the Barents Sea and central Asian cold events, which may improve extreme weather prediction. It also implies that it is necessary to force air–sea coupling models and atmospheric models with realistic daily SIC in the study of the relationship between Arctic sea ice and mid-latitude cold events.
Keywords
Arctic, extreme weather events, Sea-ice loss, Community Atmosphere Model
Introduction
Arctic amplification of surface warming is a prominent feature of climate change in recent decades, especially since 2000, and is thought to be closely related to Arctic sea-ice loss (Screen & Simmonds 2010; Screen et al. 2013; Simmonds 2015; Wu & Wang 2018; He et al. 2020). In contrast to Arctic warming, since the late 1990s, mid-latitude continental surface air over central and eastern Asia and North America presents a cooling trend in winter (Kug et al. 2015; Overland et al. 2015). Many studies reveal that it is the Arctic sea-ice loss that contributes to the mid-latitude continental cold extremes (Inoue et al. 2012; Liptak & Strong 2014; Kug et al. 2015; Xu et al. 2021; Yang et al. 2021). However, the causal linkage is still under debate (Overland & Wang 2010; Cheung et al. 2013; Cohen et al. 2014; Sato et al. 2014; Sun et al. 2016; Cho & Chang 2017; Kelleher & Screen 2018; Zhang et al. 2018; Zhu et al. 2018; Han & Li 2020).
Specifically, by setting heavy and light SIC boundary conditions in the model, Cohen et al. (2020) suggest that low Arctic sea ice in autumn could induce winter cold anomalies from Europe to the Far East through the formation of stationary Rossby waves. With the ECHAM5 general circulation model, the anomalous decrease of wintertime climatological BS SIC from 80% to 40% could lead to a strong anticyclonic anomaly over the North Pole and anomalous easterly advection over northern continents, which, therefore, brings about cold extremes (Petoukhov & Semenov 2010). Ensemble experiments forced by prescribing SIC with observed monthly composites for low- and high-ice years suggest that sea-ice decline leads to more frequent Eurasian blocking highs, which then favour cold air advection and severe winters (Dai et al. 2021).
Using high-top general atmospheric circulation models, recent numerical study has found that enhanced vertical wave activity due to Arctic sea-ice loss can weaken the stratospheric polar vortex, which then leads to a stronger Siberian high and cold air advection in Eurasia (Xu et al. 2019). The stratosphere has been identified as another key pathway for resolving Arctic-mid-latitude linkages (Hoshi et al. 2019; Cohen et al. 2020; Kretschmer et al. 2020). Furthermore, the background state of the stratosphere (e.g., quasi biweekly oscillations phase) may strongly impact the Eurasian surface temperature response to Arctic sea-ice loss (Labe et al. 2019).
However, some numerical work indicates that the influence of dramatic sea-ice melting on mid-latitude cold events is limited (Barnes 2013; Peings & Magnusdottir 2014; Woollings et al. 2014; Blackport et al. 2019). With a simplified linear steady-state model, there is a weak atmospheric mid-latitude circulation response to an idealized Arctic surface warming (Sellevold et al. 2016). Atmospheric model experiments prescribed with observed monthly-mean sea ice cannot capture the changes in weather patterns across the Northern Hemisphere that are correlated with sea-ice variations (Warner et al. 2020). The model sensitivity experiments may generate an unrealistic atmospheric response because of unrealistic amounts of Barents and Kara sea ice (Kretschmer et al. 2020). Moreover, high temporal frequency sea-ice variability cannot be ignored to improve the model forecasts (Dammann et al. 2013).
To better represent daily sea-ice variation, Liptak & Strong (2014) interpolate monthly sea ice and SST fields to daily values as boundary forcing to explore the winter atmospheric response to sea-ice anomalies, but this may still underestimate the observed variability in SIC. This shows that realistic daily SIC should be used as a boundary forcing to explore the responses of mid-latitude weather patterns and cold events.
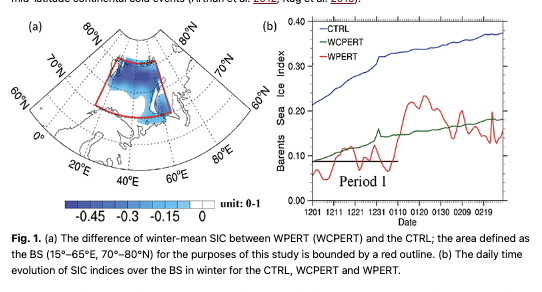
Observations indicate that 2015 was one of the warmest years in the historical instrumental records and its most evident warm anomaly occurred over land, especially at high latitudes (Zhang et al. 2016). Consistently, Arctic SIC shows great loss (Wu & Yang 2016). The SIC value in the winter of 2015/16 over the BS was the third lowest during the period 1979 to 2018 (Fig. 1; Duan & Jiang 2021). In this work, the daily BS SIC during the winter of 2015/16 is adopted to force the atmospheric model, as a comparison to the experiment forced by approximately equal winter-mean SIC loss but with daily variation similar to the climatological variability, to explore the influence of sea-ice loss with short-time variability on the linkage between BS sea-ice variation and mid-latitude continental cold events (Årthun et al. 2012; Kug et al. 2015).
After we describe the design of the model experiments, which include a CTRL and two winter perturbation experiments (WCPERT and WPERT), and we define cold events for the purposes of this study, we present the results of general atmospheric responses to sea-ice variation. The differences between cold events for the three experiments are then analysed, followed by a discussion.
Model experiments design
This study adopts the CAM4.0 standalone community atmosphere model for the simulations. The configuration of the model has 26 vertical levels, ranging from the surface to 2.917 Pa, with a horizontal resolution of 1.9 degrees of longitude by 2.5 degrees of latitude (Grassi et al. 2013). More details on the model are presented by Neale et al. (2010). The changes of sea-ice thickness are not considered here, which is uniformly set as 2 m in the Arctic (Labe et al. 2018; Dai et al. 2021).
We performed three simulations. In the CTRL, the model was prescribed with the annually repeating daily climatological SST and SIC, which were obtained by interpolation from daily mean ERA-Interim reanalysis during 1979–2018 on a horizontal resolution of 1° × 1° to the model grid (Dee et al. 2011). In WPERT, the SST was prescribed the same as for the CTRL, whilst the daily climatological SIC during winter (December–February) over the BS (15°–65°E, 70°–80°N) was replaced by observed daily varying SIC during the winter of 2015/16. The winter-mean difference of SIC between WPERT and CTRL is presented in Fig. 1a, which illustrates that the most evident sea-ice loss for WPERT was located over the northern-BS. In WCPERT, the winter daily SIC was obtained by adding the winter-mean difference of SIC between WPERT and CTRL to the climatological daily SIC in the CRTL (if the obtained SIC was less than 0.0, it was set to 0.0). Therefore, the winter daily variation of SIC in WCPERT over the BS is similar to that in the CTRL, but the winter-mean SIC value approximately equals that in WPERT. The daily SIC index was defined as the latitude-weighted area-averaged SIC over the BS. It is evident that the SIC indices for WPERT and WCPERT show lower SIC values than in the CTRL. However, in WPERT, a significant SIC daily variability can be seen (Fig. 1b). Considering that the mean SIC value or its daily variation during early winter (Period 1 is shown in Fig. 1b) is quite different from that in mid-late winter in WPERT, the atmospheric responses during early and whole winters are also compared in the following work.
Screen et al. (2013) pointed out that large ensembles are important for capturing the higher signal-to-noise ratio of remote responses. Consistent with previous numerical work (Honda et al. 2009; Cassano et al. 2014; Sun et al. 2016), 50-year continuous simulations were carried out for the three experiments, initialized on 1 December, to separate the forced response from natural atmospheric internal variability to sea-ice changes. The latter 40 winters were analysed to avoid the bias of model spin-up. The differences between perturbation experiments and the CTRL were regarded as the responses to BS sea-ice changes. Student’s t-test was used to assess the statistical significance.
Cold event definition
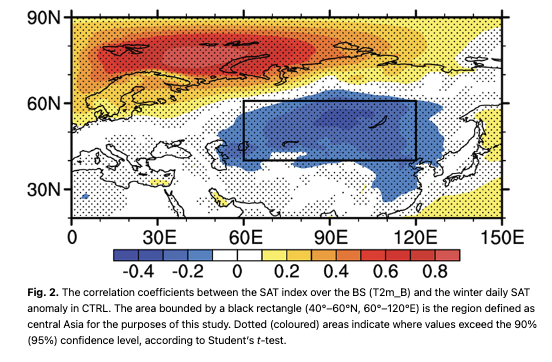
To explore the possible linkage between BS sea-ice changes and cold events over the Eurasian continent, a specific region that is strongly associated with Arctic warming over the BS was determined, in accordance with Zhuo & Jiang (2020). T2m_B index was defined as the latitude-weighted area-averaged daily SAT over the BS. Figure 2 shows the correlation coefficients between the T2m_B index and the daily SAT anomaly over the Eurasian continent in winter in the CTRL. There was a significant negative correlation centre between the T2m_B index and the SAT anomaly over central Asia (40°–60°N, 60°–120°E). Similar patterns were obtained in WPERT and WCPERT, though they were a little weaker than that in the CTRL. Accordingly, the winter SAT index over central Asia (T2m_A) was defined as the latitude-weighted area-averaged daily SAT over the domain (40°–60°N, 60°–120°E).
A cold event during Period 1 (whole winter) was defined to have taken place if (i) the T2m_A index reached the criterion of 251.3 K (251.1 K), whose occurrence probability was 10% for CTRL, (ii) the duration reached not less than three consecutive days and (iii) the time interval between two cold events exceeded 15 days (Wu et al. 2017). With these criteria, there were 17 (36) cold events in the CTRL, whereas there were 17 (42) cold events in WCPERT, and 13 (35) cold events in WPERT during Period 1 (whole winter), which are listed in Table 1. The results show that the duration of cold events in WCPERT is a little longer than in the CTRL, whereas the duration of cold events in WPERT is the longest. It is extended by two more days from CTRL to WPERT in Period 1, and half a day from CTRL to WPERT in the whole winter. The finding that cold events become longer under sea-ice loss is consistent with Luo et al. (2016). To better illustrate this difference, the composites of cold events during early winter (Period 1) are presented below. Similar conclusions can also be found for the whole winter.
Table 1 The information about cold events over the Asian continent during the whole winter and Period 1 for three experiments. | ||||
Period | Criterion | Experiment | Cold events | Duration |
Winter | SAT < 251.1K | CTRL | 36a | 6.4 |
WCPERT | 42a | 6.5 | ||
WPERT | 35b | 6.9 | ||
Period 1 | SAT < 251.3K | CTRL | 17b | 5.1 |
WCPERT | 17b | 5.2 | ||
WPERT | 13c | 7.7 | ||
aEvent exceeds the 90% confidence level, according to Student’s t-test. | ||||
The atmospheric responses to BS sea-ice variation
Before we examine the impact of sea-ice change on SAT variation over the Northern Hemisphere, the wintertime atmospheric responses are presented (Fig. 3). The atmospheric responses in winter to low SIC with and without significant (or realistic) daily variability are quite different (Fig. 3a, c). For low SIC forcing with realistic daily variability in WPERT, a wave train with a zonal tripole structure of positive-negative-positive anomalies at 500 hPa is distinctly distributed over Eurasia in winter (Fig. 3a). The downstream positive anomaly over central Asia is much stronger in early winter (Period 1; Fig. 3b). A strong warming dominates the BS, which is consistent with a large sea-ice loss over that region. Central Asia is also covered with a relatively weak warm anomaly, which is more significant in early winter. However, for low SIC forcing without significant daily variability in WCPERT, a weak anticyclone is located over the high latitudes of Eurasia, accompanied by a weak cyclone over northern Africa and southern Europe (Fig. 3c). This structure is also more evident in early winter (Period 1; Fig. 3d). Similarly, a strong warming dominates the BS, whilst no evident SAT anomaly can be seen over the main Eurasian continent, but a cold anomaly can be found over northern Africa and western Europe. Previous work suggests that the general atmospheric responses to sea-ice loss with different amplitudes and locations are nonlinear (Semenov & Latif 2015; Sui et al. 2017; McKenna et al. 2018). Furthermore, our work reveals that the different responses may also be attributed to the SIC with and without realistic daily variation.

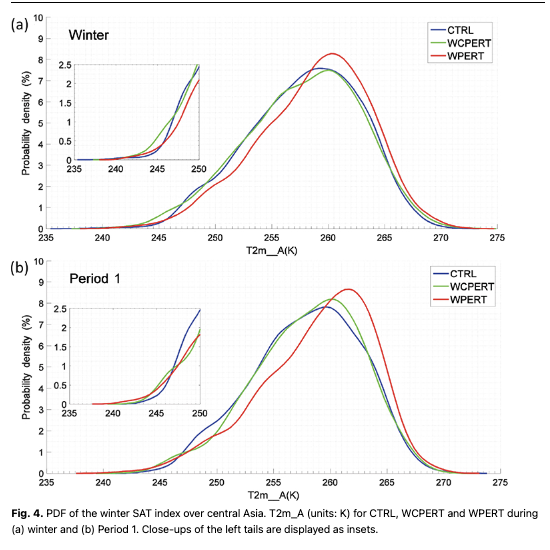
Figure 4 presents the PDF of T2m_A indices during early and whole winters for CTRL, WCPERT and WPERT. The PDF of T2m_A indices in WPERT is more skewed to the right than those in CTRL and WCPERT throughout the winter, which also illustrates that the response of SAT over central Asia to sea-ice loss with realistic daily variation is more sensitive than that to sea-ice loss with climatological daily variation (Fig. 4a). In addition, the peak in the WPERT shifts to the right (Fig. 4a), but the skewness changes from -0.35 in the CTRL to -0.45 in the WPERT (Table 2); the tail on the left side of the PDF of Asian SAT in WPERT becomes much longer than that on the right. In other words, the probability of Asian cold extremes in the WPERT is the greatest. This characteristic is more evident during early winter (Period 1; Fig. 4b). Table 2 presents the temperatures corresponding to the 1st percentile in the three experiments. It can be seen that, compared to WCPERT and CRTL, the temperature corresponding to the 1st percentile in WPERT is the smallest, which further verifies the above conclusions.
Table 2 The information about skewness coefficient and temperature corresponding to the 1st percentile (K) during the whole winter and Period 1 for the three experiments. | ||||
Information | Period | CTRL | WCPERT | WPERT |
Skewness | Winter | -0.35 | -0.32 | -0.45 |
Period 1 | -0.29 | -0.49 | -0.65 | |
1st percentile | Winter | 246.7 | 246.2 | 246.2 |
Period 1 | 247.3 | 246.3 | 245.9 | |
Atmospheric circulation associated with cold events
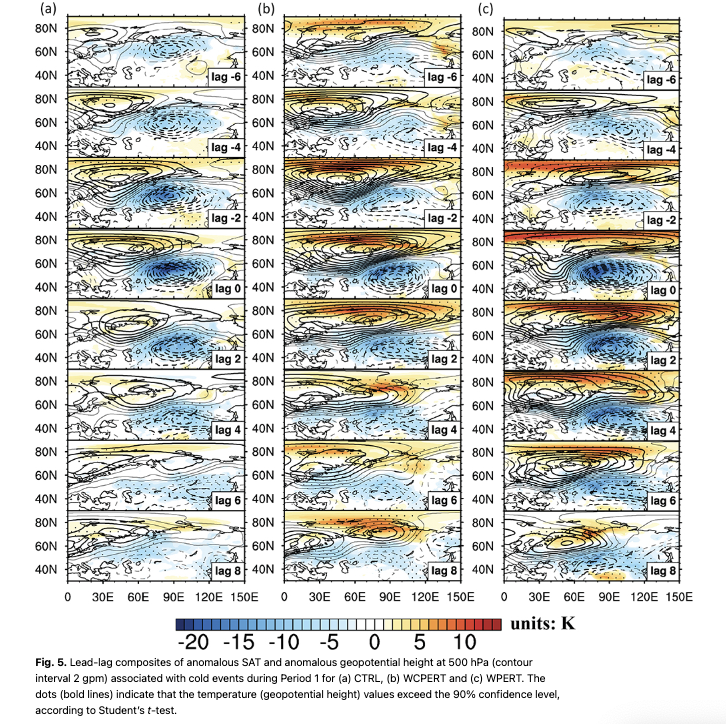
To explore the influence of SIC over the BS on central Asian cold events, the composites of 500-hPa geopotential height and SAT anomalies associated with cold events during Period 1 are shown in Fig. 5. Lag 0 is the onset day when the T2m_A index first reaches the criterion of cold events. For cold events in the CTRL (Fig. 5a), a warm-Arctic cold-central Asia SAT anomaly can be clearly observed during the cold events. Corresponding to this warm anomaly, there is a weak anticyclonic anomaly west of the BS on 500 hPa at lag -6 days, which propagates eastward gradually with time. It reaches its maximum amplitude over the BS at lag 0 days and then weakens. Meanwhile, a cyclonic anomaly to the south-east of the anticyclonic anomaly appears over Asian continent, which corresponds well with the cold anomaly. This dipole blocking pattern is favourable for the invasion of cold air advection into central Asia (Peings & Magnusdottir 2014; Cheung et al. 2018). By comparison, the warm-Arctic anomaly and high-latitude anticyclonic anomaly become stronger and more persistent in WCPERT (Fig. 5b). From lag -6 days to lag 0 days, this anticyclonic anomaly strengths and propagates gradually from the western BS to the Kara Sea. Afterwards, it retrogrades and weakens. For cold events in WPERT (Fig. 5c), the high-latitude anticyclonic anomaly becomes much stronger and more persistent, as does the cyclonic anomaly over central Asia, especially after lag 0 days. Correspondingly, the warm-Arctic and cold-Asia anomalies become much stronger and more persistent than those in WCPERT.
In order to further illustrate the difference of cold events amongst CTRL, WCPERT and WPERT, Fig. 6 presents the difference of anomalous SAT and geopotential height at 500 hPa associated with cold events between the CTRL (WPERT) and WCPERT. It can be seen from the difference of cold events between WCPERT and CTRL (Fig. 6a), a significant anticyclonic anomaly is located over around 70°E of the high latitude area from lag -6 days to lag -2 days, extending south-eastward until lag 6 days. Accordingly, a weak cold anomaly only exists from lag -6 days to lag 0 days over central Asia. Comparatively, from the difference of cold events between WPERT and WCPERT (Fig. 6b), a Ural anticyclonic anomaly can be seen during lag 2 days to lag 8 days, though it is not significant. Meanwhile, a significant cold cyclonic anomaly can be observed over central Asia from lag 0 days to lag 6 days. These results suggest that sea-ice loss with realistic SIC daily variability over the BS is conducive to intensifying the Ural anticyclone (Francis & Vavrus 2012; Luo et al. 2016; Chen et al. 2017; Yao et al. 2017; Li & Luo 2019), especially the downstream cold cyclonic anomaly.

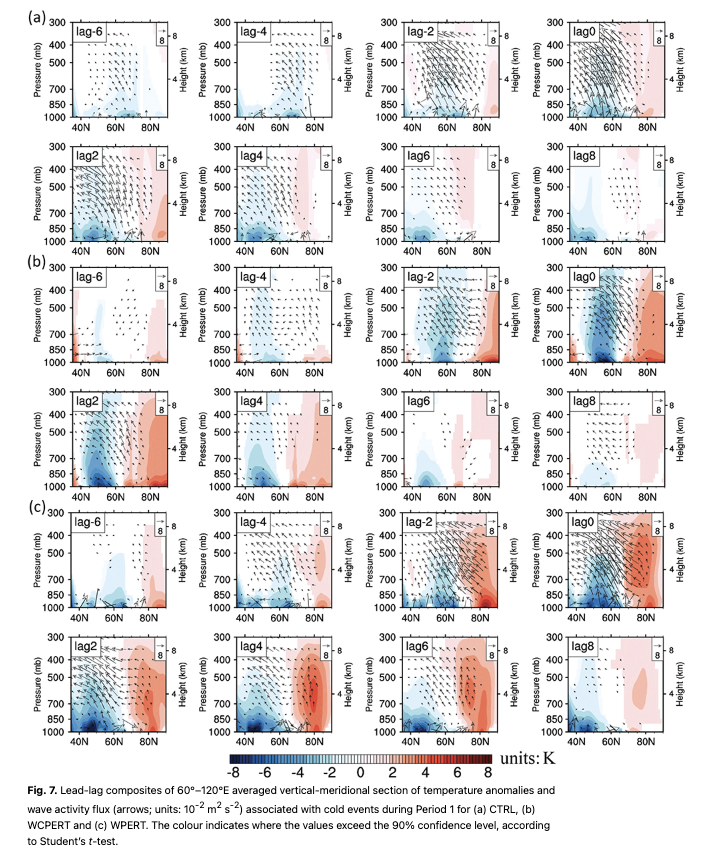
To better understand the Arctic warming accompanying the central Asian cold events, Fig. 7 presents the 60°–120°E averaged vertical-meridional section of the anomalous temperature fields during the cold events. For the CTRL (Fig. 7a), a weak surface warming appears over the high latitudes of the Eastern Hemisphere on lag -2 days. This surface warming anomaly strengthens gradually, reaches up to 4 K on lag 2 days and weakens afterwards. Meanwhile, a shallow cold anomaly is seen, which reaches its minimum at lag 2 days. For WCPERT (Fig. 7b), a surface warming appears on lag -6 days and extends upward into the upper troposphere on lag -2 days. This warming anomaly lasts to lag 4 days and then gradually weakens. Accompanying the Arctic deep warming, a deep Asian cold anomaly can be seen during lag -2 days to lag 4 days. Compared with the previous two experiments, an obvious surface warming anomaly appears as early as lag -6 days over high latitudes in WPERT (Fig. 7c), which exceeds 6 K and extends into the upper troposphere on lag -2 days. In addition to the surface warming centre, a second centre can also be observed in the mid-troposphere after lag 0 days. This Arctic deep warming anomaly lasts until lag 6 days, which is stronger and more persistent than that in the CTRL and WCPERT. Consistent with the Arctic warming, the surface cold anomaly over central Asia appears as early as lag -6 days and lasts to lag 8 days in WPERT. The Asian cold events in WPERT are also the strongest amongst the three experiments.
The 15°–65°E averaged vertical-meridional section of the anomalous temperature fields during the cold events is presented in Fig. 8. It further verifies that the cold events over central Asia are usually accompanied by Arctic deep warming, which is consistent with previous work by Labe et al. (2020) and He et al. (2020). What is more, the Arctic deep warming anomaly is the strongest and most persistent with the low BS SIC forcing including realistic daily variability. We know that sea-ice loss over Arctic, on average, may only warm the local lower atmosphere (Serreze et al. 2009). It is possible that the enhanced Arctic deep warming in WPERT is the result of intensified anticyclonic anomaly over the Ural Mountains, and therefore, the increased poleward heat and water transport.
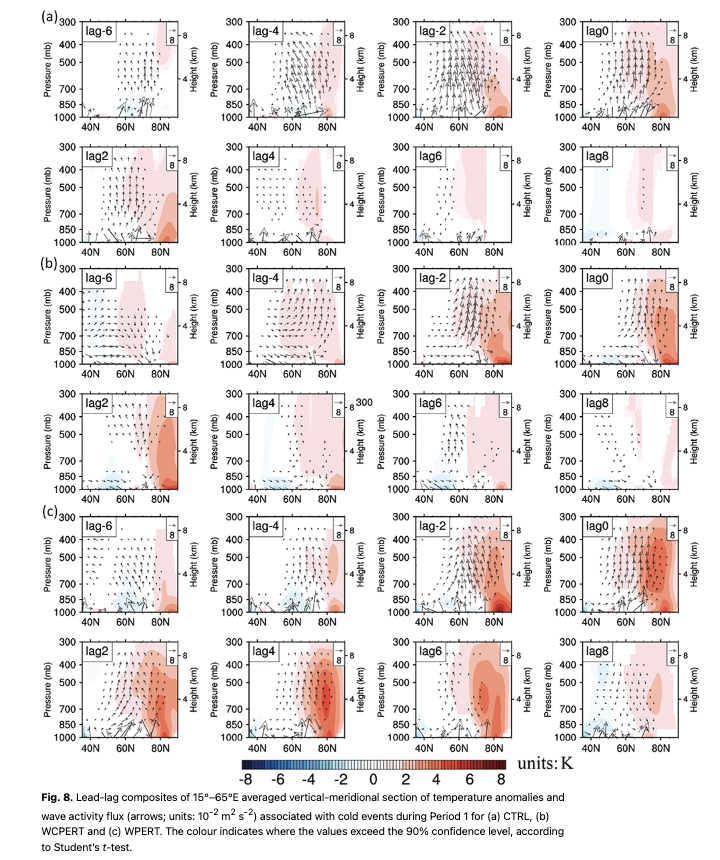
The wave activity flux is a useful tool for quantifying wave energy propagation (Takaya & Nakamura 2001). The source and sink of the wave packet can be represented by the divergence and convergence of wave activity flux. The vertical cross-section of wave activity flux associated with cold events is shown in Figs. 7 and 8. In CTRL (Fig. 7a), an upward and southward wave activity flux appears between 65° and 80°N as early as lag -6 days, which intensifies and reaches the maximum at lag 0 days. Afterwards, it weakens and disappears at lag 4 days. In WPERT, the wave activity flux becomes stronger, especially at lag -2 days (Fig. 7c), and the divergence of wave energy also becomes stronger. However, this difference between CTRL and WCPERT is not very significant (Fig. 7b). If we focus on the domain of the BS, an evident upward wave activity flux can also be found (Fig. 8). The above analysis reveals that the linkage between Arctic and the downstream mid-latitude continent has been enhanced with the forcing of low SIC, especially with realistic daily variability.
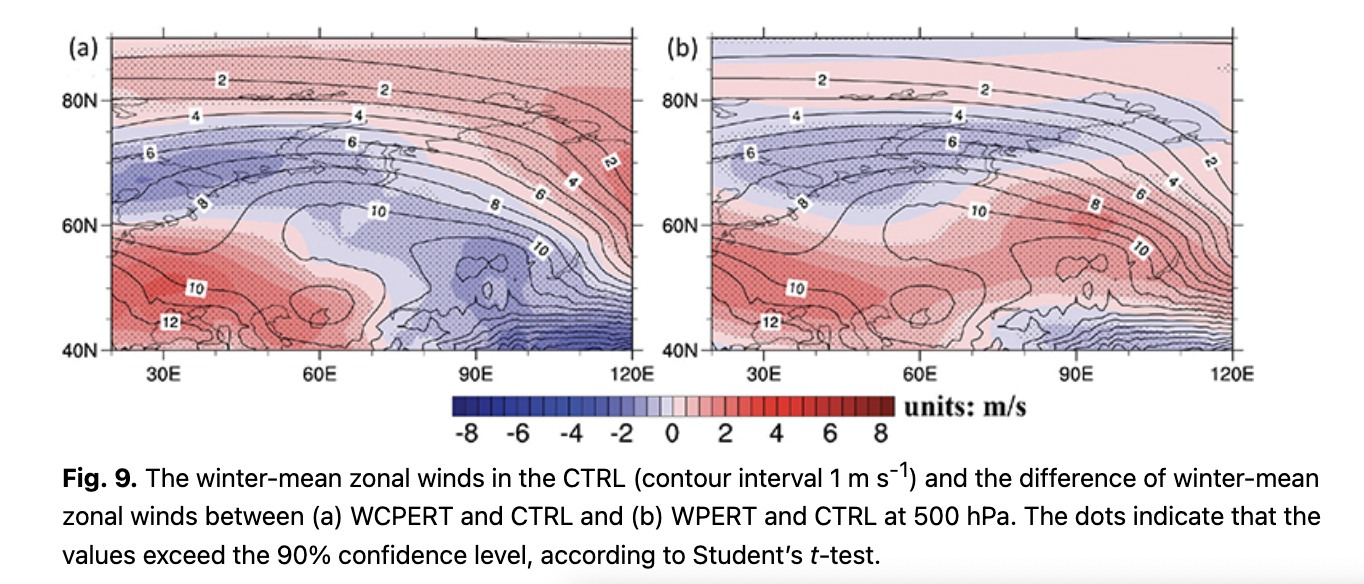
To reveal the possible mechanism for the stronger and longer-lived dipole 500-hPa geopotential height anomalies in WCPERT and WPERT, the winter-mean zonal winds in the CTRL and wind differences in WCPERT and WPERT at 500 hPa are shown in Fig. 9. The mid-high latitude zonal winds are reduced in both WCPERT and WPERT to some extent, which results in weakened energy dispersion and a stronger positive 500-hPa geopotential height anomaly. Comparatively, the weakened zonal wind is concentrated over higher latitudes in WPERT than in WCPERT. As a result, the anticyclonic centre in WPERT maintains over higher latitudes for a longer time period, whilst the anticyclonic centre in WCPERT retreats from high latitude to mid-latitude quickly.
Discussion and conclusions
In this work, we have investigated the atmospheric response to low SIC with and without realistic daily variations over the BS using the CAM4.0 atmospheric general circulation model. The emphasis is laid on the cold events over the Asian continent. Our results suggest that a mild boreal continental winter may be associated with sea-ice loss. However, with the forcing of low SIC over the BS with climatological daily variation, the cold events over central Asia may become stronger and of longer duration. Certainly, low SIC with realistic daily variation greatly intensifies the central Asian cold event, which may be mainly due to the amplified 500-hPa Ural anticyclone (Luo et al. 2016; Cohen et al. 2018; Xu et al. 2019; He et al. 2020; Labe et al. 2020), especially the downstream cyclone. Accompanying Asian cold events, a deep warm anomaly appears over the eastern Arctic, which extends into the upper troposphere. Our results suggest that low SIC with realistic daily variation over the BS is conducive to maintaining and strengthening the quasi-stationary state of the Ural anticyclonic anomaly and central Asian cyclonic anomaly. We partially attribute such an atmospheric quasi-stationary wave train response to the weakened zonal wind in mid- to high latitudes. The prescribed daily SIC variation over the BS is a result of air–sea interaction, which may act to lock the atmospheric responses in the surrounding perturbed region, making the anticlone centre relatively stable. We believe this study contributes to a better understanding of the linkage between sea-ice variation over the BS and Asian cold extremes, which will improve extreme weather predictions.
However, as a low-top model, CAM4.0 would not simulate realistic stratosphere–troposphere coupling, which may have some influence on the results presented here. Some previous studies have mentioned that the decline of Arctic sea ice in autumn is closely related to the anomalous atmospheric circulation in winter (Honda et al. 2009; Wu & Zhang 2010; Wu et al. 2011). Meanwhile, the response of boreal atmospheric circulation to the reduction of sea ice during autumn and winter is different (Tang et al. 2013). Future work will entail using the high-top model to explore atmospheric responses to sea-ice changes in autumn and winter separately and together.
Acknowledgements
The authors thank National Center for Atmospheric Research for providing the community atmosphere model and the European Centre for Medium-Range Weather Forecasts for providing the ERA-interim reanalysis data (http://apps.ecmwf.int/datasets/data/interim-full-daily/). The authors also thank the Subject Editor and the two anonymous reviewers for improving this work.
References
| Årthun M., Eldevik T., Smedsrud L.H., Skagseth Ø. & Ingvaldsen R.B. 2012. Quantifying the influence of Atlantic heat on Barents Sea ice variability and retreat. Journal of Climate 25, 4736–4743, doi: 10.1175/JCLI-D-11-00466.1. |
| Barnes E.A. 2013. Revisiting the evidence linking Arctic amplification to extreme weather in midlatitudes. Geophysical Research Letters 40, 4734–4739, doi: 10.1029/2012GL051000. |
| Blackport R., Screen J.A., Wiel K.V.D. & Bintanja R. 2019. Minimal influence of reduced Arctic sea ice on coincident cold winters in mid-latitudes. Nature Climate Change 9, 697–704, doi: 10.1038/s41558-019-0551-4. |
| Cassano E.N., Cassano J.J., Higgins M.E. & Serreze M.C. 2014. Atmospheric impacts of an Arctic sea ice minimum as seen in the Community Atmosphere Model. International Journal of Climatology 34, 766–779, doi: 10.1002/joc.3723. |
| Chen X.D., Luo D.H., Feldstein S.B. & Lee S.Y. 2017. Impact of winter Ural blocking on Arctic sea ice: short-time variability. Journal of Climate 31, 2267–2282, doi: 10.1175/JCLI-D-17-0194.1. |
| Cheung H.H.N., Keenlyside N., Omrani N.E. & Zhou W. 2018. Remarkable link between projected uncertainties of Arctic sea-ice decline and winter Eurasian climate. Advances in Atmospheric Sciences 35, 38–51, doi: 10.1007/s00376-017-7156-5. |
| Cheung H.N., Zhou W., Shao Y.P., Chen W., Mok H.Y. & Wu M.C. 2013. Observational climatology and characteristics of wintertime atmospheric blocking over Ural-Siberia. Climate Dynamics 41, 63–79, doi: 10.1007/s00382-012-1587-6. |
| Cho K.H. & Chang E.C. 2017. Sensitivity of the sea ice concentration over the Kara–Barents Sea in autumn to the winter temperature variability over East Asia. American Geophysical Union Fall Meeting Abstracts, abstract no. A43D-2472. |
| Cohen J., Screen J.A., Furtado J.C., Barlow M., Whittleston D., Coumou D., Francis J., Dethloff K., Entekhabi D., Overland J. & Jones J. 2014. Recent Arctic amplification and extreme mid-latitude weather. Nature Geoscience 7, 627–637, doi: 10.1038/NGEO2234. |
| Cohen, J., Zhang X., Francis J., Francis J., Jung T., Kwok R., Overland J., Ballinger T.J., Bhatt U.S., Chen H.W., Coumou D., Feldstein S., Gu H., Handorf D., Henderson G., Ionita M., Kretschmer M., Laliberte F., Lee S.Y., Linderholm H.W., Maslowski W., Peings Y., Pfeiffer K., Rigor I., Semmler T., Stroeve J., Taylor P.C., Vavrus S., Vihma T., Wang S., Wendisch M., Wu Y. & Yoon J. 2020. Divergent consensuses on Arctic amplification influence on midlatitude severe winter weather. Nature Climate Change 10, 20–29, doi: 10.1038/s41558-019-0662-y. |
| Cohen J., Zhang X., Francis J., Jung T. & Blackport R. 2018. Arctic change and possible influence on mid-latitude climate and weather. US CLIVAR Report March 2018, doi: 10.5065/D6TH8KGW. |
| Dai G.K., Mu M. & Wang L. 2021. The influence of sudden Arctic sea-ice thinning on North Atlantic Oscillation events. Atmosphere–Ocean 59, 39–52, doi: 10.1080/07055900.2021.1875976. |
| Dammann D.O., Bhatt U.S., Langen P.L., Krieger J.R. & Zhang X.D. 2013. Impact of daily Arctic sea ice variability in CAM3.0 during fall and winter. Journal of Climate 26, 1939–1955, doi: 10.1175/JCLI-D-11-00710.1. |
| Dee D.P., Uppala S.M., Simmons A.J., Simmons A.J., Berrisford P., Poli P., Kobayashi S., Andrae U., Balmaseda M.A., Balsamo G., Bauer P., Bechtold P., Beljaars A.C.M., van de Berg L., Bidlot J., Bormann N., Delsol C., Dragani R., Fuentes M., Geer A.J., Haimberger L., Healy S.B., Hersbach H., Hólm E.V., Isaksen L., Kållberg P., Köhler M., Matricardi M., McNally A.P., Monge-Sanz B.M., Morcrette J.-J., Park B.-K., Peubey C., de Rosnay P., Tavolato C., Thépaut J.-N. & Vitart F. 2011. The ERA‐Interim reanalysis: configuration and performance of the data assimilation system. Quarterly Journal of the Royal Meteorological Society 137, 553–597, doi: 10.1002/qj.828. |
| Duan S.N. & Jiang Z.N. 2021. Sensitivity of the boreal winter atmosphere to sea ice anomalies in autumn and winter over Barents Sea. Acta Meteorologica Sinica 79, 209–228, doi: 10.11676/qxxb2021.018. (In Chinese with English abstract.) |
| Francis J.A. & Vavrus S.J. 2012. Evidence linking Arctic amplification to extreme weather in mid‐latitudes. Climate Dynamics 39, L06801, doi: 10.1029/2012GL051000. |
| Grassi B., Redaelli G. & Visconti G. 2013. Arctic sea ice reduction and extreme climate events over the Mediterranean region. Journal of Climate 26, 10101–10110, doi: 10.1175/JCLI-D-12-00697.1. |
| Han Z. & Li S.L. 2020. Atmospheric responses over Asia to sea ice loss in the Barents and Kara seas in mid-late winter and early spring: a perspective revealed from CMIP5 data. Advances in Polar Science 31, 55–63, doi: 10.13679/j.advps.2017.0035. |
| He S.P., Xu X.P., Furevik T. & Gao Y.Q. 2020. Eurasian cooling linked to the vertical distribution of Arctic warming. Geophysical Research Letters 47, e2020GL087212, doi: 10.1029/2020GL087212. |
| Honda M., Inoue J. & Yamane S. 2009. Influence of low Arctic sea-ice minima on anomalously cold Eurasian winters. Geophysical Research Letters 36, 1119–1138, doi: 10.1029/2008GL037079. |
| Hoshi K., Ukita J., Honda M., Tetsu N., Koji Y., Yasunobu Y. & Ralf J. 2019. Weak stratospheric polar vortex events modulated by the Arctic sea‐ice loss. Journal of Geophysical Research—Atmospheres 124, 858–869, doi: 10.1029/2018JD029222. |
| Inoue J., Hori M.E. & Takaya K. 2012. The role of Barents Sea ice in the wintertime cyclone track and emergence of a warm-Arctic cold-Siberian anomaly. Journal of Climate 25, 2561–2568, doi: 10.1175/JCLI-D-11-00449.1. |
| Kelleher M. & Screen J. 2018. Atmospheric precursors of and responses to anomalous Arctic sea ice in CMIP5 models. Advances in Atmospheric Sciences 35, 27–37, doi: CNKI:SUN:DQJZ.0.2018-01-004. |
| Kretschmer M., Zappa G. & Shepherd T.G. 2020. The role of Barents–Kara sea ice loss in projected polar vortex changes. Weather and Climate Dynamics 1, 715–730, doi: 10.5194/wcd-1-715-2020. |
| Kug J.S., Jeong J.H., Jang Y.S. & Kim B.M. 2015. Two distinct influences of Arctic warming on cold winters over North America and East Asia. Nature Geoscience 8, 759–762. doi: 10.1038/NGEO2517. |
| Labe Z., Peings Y. & Magnusdottir G. 2018. Contributions of ice thickness to the atmospheric response from projected Arctic sea ice loss. Geophysical Research Letters 45, 5635–5642, doi: 10.1029/2018GL078158. |
| Labe Z., Peings Y. & Magnusdottir G. 2019. The effect of QBO phase on the atmospheric response to projected Arctic sea ice loss in early winter. Geophysical Research Letters 46, 7663–7671, doi: 10.1029/2019GL083095. |
| Labe Z., Peings Y. & Magnusdottir G. 2020. Warm Arctic, cold Siberia pattern: role of full Arctic amplification versus sea ice loss alone. Geophysical Research Letters 47, e2020GL088583, doi: 10.1029/2020GL088583. |
| Li M.Y. & Luo D.H. 2019. Winter Arctic warming and its linkage with midlatitude atmospheric circulation and associated cold extremes: the key role of meridional potential vorticity gradient. Science China Earth Sciences 62, 1329–1339, doi: 10.1007/s11430-018-9350-9. |
| Liptak J. & Strong C. 2014. The winter atmospheric response to sea ice anomalies in the Barents Sea. Journal of Climate 27, 914–924, doi: 10.1175/JCLI-D-13-00186.1. |
| Luo D.H., Xiao Y.Q., Yao Y., Dai A.G., Simmonds I. & Franzke C.L.E. 2016. Impact of Ural blocking on winter warm Arctic-cold Eurasian anomalies. Part I: blocking-induced amplification. Journal of Climate, 29, 3925–3947, doi: 10.1175/JCLI-D-15-0611.1. |
| McKenna C.M., Bracegirdle T.J., Shuckburgh E.F., Haynes P.H. & Joshi M.M. 2018. Arctic sea ice loss in different regions leads to contrasting Northern Hemisphere impacts. Geophysical Research Letters 45, 945–954, doi: 10.1002/2017GL076433. |
| Neale R.B., Richter J.H., Conley A.J., Park S., Lauritzen P.H., Gettelman A., Williamson D.L., Rasch P.J., Vavrus S.J., Taylor M.A., Collins W.D., Zhang M.H. & Lin S.J. 2010. Description of the NCAR Community Atmosphere Model (CAM4.0). NCAR technical note. NCAR/TN-485+STR. Boulder, CO: National Center for Atmospheric Research. |
| Overland J.E., Francis J.A., Hall R., Hanna E., Kim S.J. & Vihma T. 2015. The melting Arctic and midlatitude weather patterns: are they connected? Journal of Climate 28, 7917–7932, doi: 10.1175/JCLI-D-14-00822.1. |
| Overland J.E. & Wang M. 2010. Large-scale atmospheric circulation changes are associated with the recent loss of Arctic sea ice. Tellus A 62, 1–9, doi: 10.1111/j.1600-0870.2009.00421.x. |
| Peings Y. & Magnusdottir G. 2014. Response of the wintertime Northern Hemisphere atmospheric circulation to current and projected Arctic sea ice decline: a numerical study with CAM5. Journal of Climate 27, 244–264, doi: 10.1175/JCLI-D-13-00272.1. |
| Petoukhov V. & Semenov V.A. 2010. A link between reduced Barents–Kara sea ice and cold winter extremes over norther continents. Journal of Geophysical Research—Atmospheres 115, D21111, doi:10.1029/2009JD013568. |
| Sato K., Inoue J. & Watanabe M. 2014. Influence of the Gulf Stream on the Barents Sea ice retreat and Eurasian coldness during early winter. Environmental Research Letters 9, article no. 084009, doi: 10.1088/1748-9326/9/8/084009. |
| Screen J.A. & Simmonds I. 2010. The central role of diminishing sea ice in recent Arctic temperature amplification. Nature 464, 1334–1337, doi: 10.1038/nature09051. |
| Screen J.A., Simmonds I., Deser C. & Tomas R. 2013. The atmospheric response to three decades of observed Arctic sea-ice loss. Journal of Climate 26, 1230–1248, doi: 10.1175/JCLI-D-12-00063.1.1. |
| Sellevold R., Sobolowski S. & Li C. 2016. Investigating possible Arctic–midlatitude teleconnections in a linear framework. Journal of Climate 29, 7329–7343, doi: 10.1175/JCLI-D-15-0902. |
| Semenov V.A. & Latif M. 2015. Nonlinear winter atmospheric circulation response to Arctic sea ice concentration anomalies for different periods during 1966–2012. Environmental Research Letters 10, article no. 054020, doi: 10.1088/1748-9326/10/5/054020. |
| Serreze M.C., Barrett A.P., Stroeve J.C., Kindig D.N. & Holland M. 2009. The emergence of surface-based Arctic amplification. The Cryosphere 3, 11–19, doi: 10.5194/tc-3-11-2009. |
| Simmonds I. 2015. Comparing and contrasting the behavior of Arctic and Antarctic sea ice over the 35 year period 1979–2013. Annals of Glaciology 56, 18–28, doi: 10.3189/2015AoG69A909. |
| Sui C., Zhang Z., Yu L., Yi L.I. & Mirong S. 2017. Sensitivity and nonlinearity of Eurasian winter temperature response to recent Arctic sea ice loss. Acta Oceanologica Sinica 36, 52–58 , doi: 10.1007/s13131-017-1018-y. |
| Sun L., Perlwitz J. & Hoerling M. 2016. What caused the recent “warm Arctic, cold continents” trend pattern in winter temperatures? Geophysical Research Letters 43, 5345–5352, doi: 10.1002/2016GL069024. |
| Takaya K. & Nakamura H. 2001. A formulation of a phase-independent wave-activity flux for stationary and migratory quasi-geostrophic eddies on a zonally varying basic flow. Journal of the Atmospheric Sciences 58, 608–627, doi: 10.1175/1520-0469(2001)058<0608:AFOAPI>2.0.CO;2. |
| Tang Q.H., Zhang X.J., Yang X.H. & Francis A.J. 2013. Cold winter extremes in northern continents linked to Arctic sea ice loss. Environmental Research Letters 8, article no. 014036, doi: 10.1088/1748-9326/8/1/014036. |
| Warner J.L., Screen J.A. & Scaife A.A. 2020. Links between Barents–Kara sea ice and the extratropical atmospheric circulation explained by internal variability and tropical forcing. Geophysical Research Letters 47, article no. e2019GL085679, doi: 10.1029/2019GL085679. |
| Woollings T., Harvey B. & Masato G. 2014. Arctic warming, atmospheric blocking and cold European winters in CMIP5 models. Environmental Research Letters 9, article no. 014002, doi: 10.1088/1748-9326/9/1/014002. |
| Wu B.K., Yang K. & Francis J.A. 2017. A cold event in Asia during January–February 2012 and its possible association with Arctic sea ice loss. Journal of Climate 19, 7971–7990, doi: 10.1175/jcli-d-16-0115.1. |
| Wu B.Y., Su J.Z. & Zhang R.H. 2011. Effects of autumn–winter Arctic sea ice on winter Siberian high. Chinese Science Bulletin 56, 3220–3228, doi: 10.1007/s11434-011-4696-4. |
| Wu B.Y. & Yang K. 2016. Roles of Arctic sea ice and the preceding summer Arctic atmospheric circulation anomalies in the atmospheric circulations anomalies of 2011/2012 and 2015/2016 winters. Acta Meteorologica Sinica 74, 683–696, doi: 10.7519/j.issn.1000-0526.2016.04.013. (In Chinese with English abstract.) |
| Wu Q. & Zhang X. 2010. Observed forcing‐feedback processes between Northern Hemisphere atmospheric circulation and Arctic sea ice coverage. Journal of Geophysical Research—Atmospheres 115, D14119, doi: 10.1029/2009JD013574. |
| Wu Z. & Wang X. 2018. Variability of Arctic sea ice (1979–2016). Water 11, article no. 23, doi: 10.3390/w11010023.s. |
| Xu M., Tian W.S., Zhang J.K., Wang T. & Qie K. 2021. Impact of sea ice reduction in the Barents and Kara seas on the variation of the East Asian trough in late winter. Climate Dynamics 34, 1081–1097, doi: 10.1175/JCLI-D-20-0205.1. |
| Xu X.P., He S.P., Gao Y.Q., Furevik T., Wang H.J., Li F. & Ogawa F. 2019. Strengthened linkage between midlatitudes and Arctic in boreal winter. Climate Dynamics 53, 3971–3983, doi: 10.1007/s00382-019-04764-7. |
| Yang X.Y., Zeng G., Zhang G.W. & Li C. 2021. Linkage between interannual variation of winter cold surge over East Asia and autumn sea ice over the Barents Sea. Theoretical and Applied Climatology 144, 339–351, doi: 10.1007/s00704-021-03545-9. |
| Yao Y., Luo D.H., Dai A.G. & Simmonds I. 2017. Increased quasi stationarity and persistence of winter Ural blocking and Eurasian extreme cold events in response to Arctic warming. Part I: insights from observational analyses. Journal of Climate 30, 3549–3568, doi: 10.1175/JCLI-D-16-0261.1. |
| Zhang C., Li S.L. & Wan J.H. 2016. The warmest year 2015 in the instrumental record and its comparison with year 1998. Atmospheric and Oceanic Science Letters 9, 487–494, doi: 10.1080/16742834.2016.1237255. |
| Zhang P.F., Wu Y.T., Simpson I.R., Smith K.L., Zhang X.D., De B. & Callaghan P. 2018. A stratospheric pathway linking a colder Siberia to Barents–Kara sea ice loss. Science Advances 4, eaat6025, doi: 10.1126/sciadv.aat6025. |
| Zhu Y.L., Wang H.J., Wang T. & Guo D. 2018. Extreme spring cold spells in north China during 1961–2014 and the evolving processed. Atmospheric and Oceanic Science Letters 11, 56–61, doi: 10.1080/16742834.2018.1514937. |
| Zhuo W.Q. & Jiang Z.N. 2020. A possible mechanism for winter sea ice decline over the Bering Sea and its relationship with cold events over North America. Journal of Meteorological Research 34, 575–585, doi: 10.1007/s13351-020-9154-2. |
Related Articles
Olof Bengtsson
Kit M. Kovacs
Christian Lydersen
Øystein Varpe
Geir W. Gabrielsen
Martyn E. Obbard
Christopher Di Corrado
João Franco
Roger Pimenta
et al.
Michał Hubert Węgrzyn
Beata Cykowska-Marzencka
Monica Alterskjær Sundset
Paulina Wietrzyk-Pełka
et al.
Clémentine Peggy Anne-Marie Colpaert
Boris Leonidovich Nikitenko