This article is published under a Creative Commons license and not by the author of the article. So if you find any inaccuracies, you can correct them by updating the article.

Interannual variability in hydrography and water mass distribution in Hornsund, an Arctic fjord in Svalbard


Agnieszka Promińska
Waldemar Walczowski
Eva Falck
Published: Sept. 6, 2018
Latest article update: Aug. 7, 2023
This article is published under the license


Abstract
Progressing warming in the Arctic and increased extreme weather events can significantly influence the hydrography of Svalbard fjords, leading to changes towards more Atlantic-type waters in the fjords. In this paper, we look into the hydrographic conditions in Hornsund, the southernmost fjord on the west coast of Svalbard, by analysing high-resolution CTD measurements collected in July during cruises with the RV Oceania between 2001 and 2015. These observations revealed high interannual variability in temperature, salinity and distribution of water masses, mainly due to differences in timing of the transition between winter and summer conditions but also as a result of changing environmental factors such as air temperature and sea-ice cover. Hornsund shows weak Atlantic Water occupation, probably due to strong influence of the Sørkapp Current along the southern coast of Spitsbergen. The main basin of the fjord was much more influenced by waters entering the fjord from outside than the inner basin, Brepollen, which was mainly characterized by the presence of locally formed Winter Cooled Water (WCW). The amount and properties of WCW in Brepollen revealed high variability after 2006, and no WCW in July 2012. The results of our study show that Hornsund is highly variable and susceptible to recently observed atmospheric and oceanic extreme events in the Svalbard region.
Keywords
Salinity, Spitsbergen, environmental factors, Atlantic Water, Temperature, Sørkapp Current
Introduction
The Arctic region has undergone significant changes during the last decades and these changes concern all components of the climate system. For instance, the Arctic has warmed up at twice the global rate during the last 50 years (Walsh 2014) - this phenomenon is called the Arctic Amplification and it manifests itself in a number of positive feedbacks (Serreze & Barry 2011), among which the most pronounced is the ice-albedo feedback. A significant warming in the atmosphere and huge heat gain by the oceans has been observed during the last 30 years (IPCC 2014). The ice cover in the Arctic Ocean has diminished and extremely low values were observed in August 2012 (Xia et al. 2014), which was correlated with a very strong storm observed in the central Arctic at this time (Simmonds & Rudeva 2012; Parkinson & Comiso 2013). Reduced sea ice in the Arctic and larger areas of open water will increase the heat fluxes from the ocean to the atmosphere and may be one reason for increased extreme weather conditions in the region. Significant decrease in the mass of Greenland and Antarctic ice sheets has also been noted (Velicogna 2009) and the same negative trend has been observed for glaciers around the world (Blaszczyk et al. 2013; IPCC 2014). The warm (positive) trend of Arctic Amplification has become a subject of many recent studies (Miller et al. 2010; Serreze & Barry 2011), among which many are dedicated to linking the Arctic Amplification to midlatitudes climate (Francis & Vavrus 2012; Cohen et al. 2014; Walsh 2014; Francis & Skific 2015).
Arctic fjords play a crucial role in climate warming as a medium linking land and ocean. Arctic Hords are usually dominated by glaciers and a substantial seasonal freshwater input in the inshore part and a warmer oceanic component at the offshore boundary. Lately there has been an increasing interest and activity in investigating the role of oceanic heat on the stability of tidewater glaciers, since propagation of warm oceanic waters into the fjords may have the potential to increase the melt rates of glaciers and lead to increase in calving rates and the acceleration in the retreat of glaciers (Holland et al. 2008; Nick et al. 2009; Rignot et al. 2010; Blaszczyk et al. 2013; Inall et al. 2014; Luckman et al. 2015; Pętlicki et al 2015).
Fjords in Svalbard are extremely vulnerable to climate change as many of them are located on the pathway of warm AW towards the Arctic Ocean, a region of large heat fluxes to the atmosphere. In Svalbard the most studied fjords regarding the physical oceanographic conditions are Storfjorden (Haarpaintner et al. 2001; Skogseth et al. 2004; Skogseth et al. 2005; Fer & Adlandsvik 2008; Skogseth et al. 2008) and Kongsfjorden (Svendsen et al. 2002; Cottier et al. 2005; Cottier et al. 2007; Inall et al. 2015; Tverberg et al. in press). In addition, some work has also been done in Van Mijenfjorden (Skardhamar & Svendsen 2010) and Isfjorden (Nilsen et al. 2008; Pavlov et al. 2013; Nilsen et al. 2016). In contrast, Hornsund, the southernmost fjord on the west coast of Svalbard (Fig. la), is still very poorly presented with regard to hydrography (Urbanski et al. 1980; Swerpel 1985).
The hydrographic patterns in Hornsund, as in other Arctic fjords, are dependent on conditions set by land (glacier)-fjord and fjord-ocean boundaries. The hydrographic conditions outside the fjords along the west coast of Spitsbergen are defined by the SC and WSC (Fig. la). The SC is a prolongation of the East Spitsbergen Current carrying cold ArW from the Barents Sea while the WSC carries the warmer and more saline AW from the Norwegian Sea. The two water masses are separated from each other by the Polar Front (Swerpel 1985; references therein; Walczowski 2013), also referred to as the Arctic Front (Saloranta & Svendsen 2001).
During summer the upper water layer in these fjords is a mixture of inflowing shelf waters from the SC and freshwater coming from land sources (mainly from glacier ablation and calving, snowmelt and river runoff) and is modified by tides and local winds (Svendsen et al. 2002). The thickness of this surface layer is generally largest in the inner parts of the fjords and then decreases towards the fjord mouth. The water in this layer is called SW and exhibits a very wide range of salinities and temperatures. Deeper parts of the fjords may stay under the influence of Atlantic origin waters. This is typically a mixture of AW and ArW, termed TAW. When TAW enters the fjords, it undergoes further transformation due to entrainments and mixing with SW giving rise to IW (Cottier et al. 2010). The topographically steered WSC (Hopkins 1991; Osinski et al. 2003) may, because of enhanced instabilities in the Polar Front and favourable weather conditions, flood the shelf areas and lead to inflow of unmodified AW far into the fjords, as has been observed in both Kongsfjorden and Isfjorden (Cottier et al. 2005; Cottier et al. 2007; Nilsen et al. 2008; Nilsen et al. 2016). Propagation of AW towards Hornsund is facilitated by the Hornsund Deep (ca. 250 m; Gbrlich 1986) located between Hornsund Banken and Sorkapp Banken (Fig. 1c).

During autumn and winter the lower air temperatures and stronger winds will decrease the temperature and deepen the surface mixed layer. This mixing and cooling gives rise to what has been termed LW in the Svalbard Hords (Svendsen et al. 2002; Nilsen et al. 2008). Once the LW has reached the freezing point, which is typically in November or December (Nilsen et al. 2008), continued surface cooling will lead to the formation of sea ice and the associated brine release. This more saline winter water is termed WCW (Svendsen et al. 2002; Nilsen et al. 2008). When the newly formed SW mixes, the next spring, with LW (or WCW) present in the Hord, the resulting water mass will also be classified as IW. An overview of the general oceanographic environment and dominant physical processes in Arctic Hords has been given by Cottier et al. (2010).
So far, literature on Hornsund has been dominated by marine biology and sedimentary studies and very little has been written about the physical oceanographic environment of this Hord. The aim of this paper is therefore to fill some of this gap by providing a detailed description of the hydrography in Hornsund during summer. The data used have been collected in Hornsund during summer cruises nearly every year since 2001. The water masses observed in the Hord each summer are described and special emphasis is given to interannual variability and differences between distinct areas of Hornsund. The interannual variability is also discussed in relation to environmental conditions set by oceanic, atmospheric, and local sea ice factors. An important question during this work has also been to which extent the AW penetrates into Hornsund. Is it comparable to what has been observed in Kongs!)orden and IsHorden or is Hornsund different from these other Hords along the west coast of Svalbard? Since there are no winter data from Hornsund we will also present data obtained from moorings deployed between 2010 and 2013 on the shelf just outside the mouth of Hornsund.
Study area
Hornsund is the southernmost Hord on the west coast of Spitsbergen (Fig. la), the largest island of the Svalbard Archipelago. The fjord is about 35 km long and between 2 and 12 km wide. The total area of Hornsund is about 320 km2 (Muckenhuber et al. 2016), but the area is increasing every year as the surrounding glaciers retreat. The average retreat rate of glaciers in Hornsund is about 70 m yr-1, which is higher than anywhere else in Svalbard (Blaszczyk et al. 2013). Today Hornsund consists of several secondary bays that were covered by glaciers at the beginning of the 20th century (see figure 2 in Blaszczyk et al. 2013): Vestre and Austre Burgerbukta in the north, Brepollen in the inner part and, in the south, just outside Brepollen, Samarinvagen (Fig. 1c).
The bathymetry of Hornsund is shown in Fig. 1c. Depth surveys with echo sounder were done in 2007 and 2008 in Brepollen (Moskalik et al. 2013) and between 2009 and 2011 in the western and central parts (Blaszczyk et al. 2013). The maximum depth of 230 m is found in the central part of the Hord, while the depth in Vestre Burgerbukta exceeds 170 m and Austre Burgerbukta is about 100 m deep. Brepollen and Samarinvagen are separated from the main basin by a sill (Fig. 1c) with a depth of about 50 m. In Samarinvagen the maximum depth is 150 m, in Brepollen the depth is increasing gradually with a maximum value exceeding 140 m in the central part (Moskalik et al. 2013). The mouth of Hornsund has no sill and is generally defined by a line linking Worcesterpynten on the northern shore with Palffyodden on the southern side (Marsz & Styszynska 2013; Fig. 1c).
Most of the area around Hornsund is covered by glaciers, many of them being tidewater glaciers. Hence, the main source of freshwater in Hornsund comes from glacier ablation (W^slawski et al. 1995). W^slawski et al. (1995) have compiled data from different sources (see their table 1) and gives that for Brepollen 86% of the freshwater comes from glacier ablation and 8% from rivers, while rain on the sea surface (0.6%), melted snow (1.4%), and fast ice melt (3.9%) are of secondary importance. July and August are the months with highest discharge of freshwater from land. Jania & Pulina (unpublished report written in 1994; see Waslawski et al. 1995) estimated an annual freshwater discharge of 1.8 km3 to Hornsund, of which 0.5 km3 of this volume comes from icebergs. Beszczynska-Moller et al. (1997) estimated the freshwater content in Hornsund to be about 0.7 km3 from hydrographic measurements. But this latter value only gives the amount of freshwater that was present in the Hord at the time of measurements. The increased atmospheric warming in this area (Isaksen et al. 2016) means that the annual freshwater input to Hornsund is probably higher today.
During summer the Hord is usually free of ice. The fast ice starts to form in late autumn (usually in November), first in Brepollen and then in the other innermost basins of Burgerbukta and Samarinvagen. In the central part of Hornsund the ice cover in winter and spring varies from year to year and consists mainly of pack ice. The ice season in the Hord lasts until May or beginning of June when the drifting ice is transported out of the Hord by the dominant easterly winds. Detailed observations of each ice season in Hornsund between 2005 and 2012 has been described by the following researchers: Styszynska & Kowalczyk (2007), Styszynska & Rozwadowska (2008), Styszynska (2009) and Kraszewski (2010, 2011, 2012, 2013). These papers are written in Polish, but have summaries in English. A recent investigation of sea ice in Hornsund, based on analysis of satellite images and ice charts for the time period 2000-2014, was carried out by Muckenhuber et al. (2016). They found that the highest fast-ice coverage in the fjord was seen in April. They also introduced the concept of DFI, a new index for quantifying fast ice coverage in a fjord, and showed a decrease in mean DFI for Hornsund from 56 for the time period 2000-05 to 34 after 2006. Sea-ice thickness has been measured by Gerland & Hall (2006) in April 2004 for two sites in Hornsund: in Burgerbukta and at the entrance to Brepollen. The thickness varied between 0.99 and 1.43 m.
The climate conditions in the area of Hornsund are mainly influenced by meteorological conditions driven by atmospheric circulation (Marsz & Styszynska 2013) and the West Spitsbergen current system (Walczowski & Piechura 2011; Walczowski et al. 2012). Meteorological observations at the Polish Polar Station (Fig. 1c)) show that more than 80% the winds originate from the north-east, east and south-east directions. The prevailing easterly winds are strengthened by the east-west orientation of the Hord. Tides in Hornsund are semidiurnal, with amplitudes ranging from 0.8 to 1.8 m.

Data
The hydrographic data of temperature and salinity from Hornsund have been collected by the Institute of Oceanology Polish Academy of Sciences from the RV Oceania between 20 and 31 July since 2001, with the exception of 2004, when severe ice conditions prevented it. During these cruises a towed LTD profiling system was used (calibrated each year prior to the cruises). The tracks followed and the amount of data collected varied slightly for the different years, but followed more or less the line shown in Fig. 1c. Until 2006 the data were collected by an Idronaut 316, profiling at 8 Hz, with an accuracy for conductivity, temperature and pressure of, respectively, 0.003 mS cm-1, 0.003°C and 0.05% of the full-scale range. In 2007 and onwards a SBE 49 probe was used, profiling at 16 Hz, with an improved accuracy of 0.0003 S m-1, 0.002°C and 1% of the full-scale range, respectively, for conductivity, temperature and pressure. The data were filtered and vertically averaged every 1 dbar using standard routines in the SBE Data Processing Software, Version 7.22.2. The CTD data from 2005 were considered to be erroneous and are therefore not used in this study.
The along-Hord CTD section (Fig. 1c) was divided for purposes of the analysis into the Outer Part (<15.42°E, the line linking the Worcesterpynten and Palffyodden), the Main Basin (15.42°E-16.14°E) and Brepollen (>16.14°E, the position of the entrance sill) to assess differences between the shelf and different areas of the Hord. To calculate the mean potential temperature (hereafter temperature) and practical salinity (hereafter salinity) the along-fjord section was limited to 15.28°E and 16.48°E so that the length was the same for each year.
To look at conditions outside the Hord, temperature and salinity data from a SeaBird SBE 37 for the period July 2010 to July 2013 have been used. The SBE 37 was mounted on a mooring located on the shelf just outside Hornsund (Fig. 1c). For the period July 2010 to July 2011 the mooring was located on the northern side (76°59.651'N and 15°10.474'E), just outside the fjord, but was moved in July 2011 to the southern position (76°52.898'N and 15°09.288'E). For 2010-11 the SBE 37 was recording data at a depth of 24 m, while for 2011-12 and 2012-13 the SBE 37 was collecting data at 46 m and 85 m depth, respectively (Table 1). Dates of deployment and recovery are presented in Table 1.
To test environmental factors that might influence the hydrographic variability in Hornsund, CTD measurements taken each year along Section N (Fig. la) have been used together with meteorological and seaice concentration data. Section N covers the entire Atlantic domain in the WSC and crosses the SC when it enters the shelf area. This section was taken during the same cruises as the measurements in Hornsund. Meteorological data (air temperature, recorded every 3h) were obtained from the Polish Polar Station in Hornsund (Fig. 1c), which is operated by the Institute of Geophysics, Polish Academy of Sciences. The permanent weather station at the Polish Polar Station is part of the Norwegian observational network and has World Meteorological Organization registration number 01003. Daily sea-ice concentrations for the time period 2001-2015 were obtained from the Integrated Climate Date Center, in Hamburg, where a 5-day median-filter has been applied (Kern et al. 2010). The data were originally computed and provided by the French Research Institute for Exploitation of the Sea, where the ARTIST Sea Ice (ASI) algorithm to brightness temperatures measured with the 85 GHz Special Sensor Microwave/Imager and/or Special Sensor Microwave/ Imager Sounder channels have been applied (Kaleschke et al. 2001; Spreen et al. 2008). The data cover the region of the shelf where the SC flows around Sorkapp Land (Fig. lb).
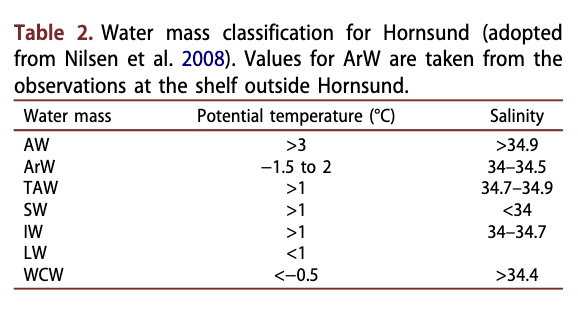
The definition of water masses used is shown in Table 2 and they have been defined according to the classification that was used for Isfjorden by Nilsen et al. (2008). Ocean Data View package (version 4.6.2; Schlitzer 2014) and MatLab Software have been used to visualize the results.
Results
Hydrographic observations from towed CTD
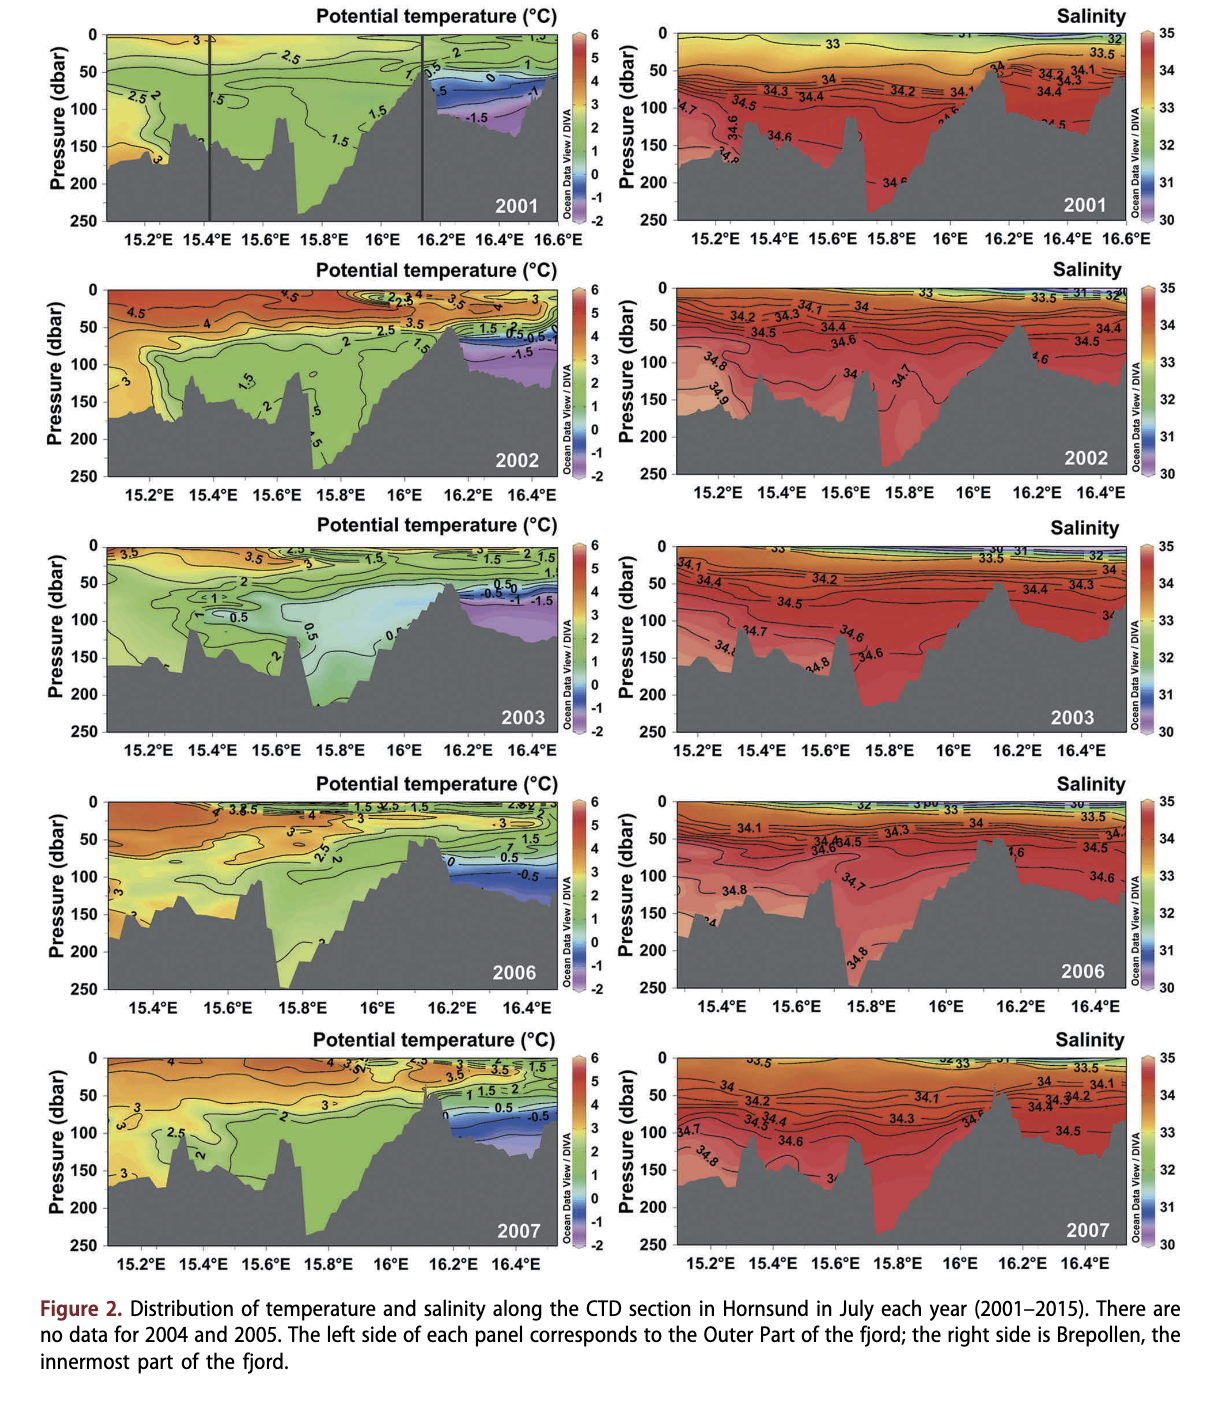
The vertical distribution of temperature and salinity along the Hord (the section shown by yellow dots in Fig. 1c) in July for each year during the period 2001-2015 (with the exception of 2004 and 2005) are shown in Fig. 2. The length of the section varied slightly from year to year. The warmest water was generally found in the surface layer, although in the Outer Part warm water was also present close to the bottom. The temperature in the surface layer varied between years, mainly between 3 and 5°C, with the exception of 2013 and 2014, when the surface temperature was close to 6°C. The warm surface layer over the mouth and Main Basin can be traced into Brepollen as a subsurface layer in most years, when this warm tongue was observed below a thin layer of colder and less saline waters. The coldest water each year was seen in the deeper parts of Brepollen, behind the sill that separates Brepollen from the Main Basin. Here temperatures were below 0°C, with decreasing temperatures towards the bottom. In the years 2001-03 and 2015 the bottom waters in Brepollen showed the lowest temperatures (below -1.5°C).
The distribution of salinity for the different years (Fig. 2) shows a quite thin surface layer (10-20 m) of low salinity (<33) that is thickest in the inner part of the Hord. The salinity is increasing with depth and below 50 m the salinity was generally above 34 for all years. Salinities between 34.7 and 34.9 (i.e., TAW) were found in the Outer Part, outside of the Hord mouth, each year, and also in the Main Basin in most years. The only year when salinities above 34.7 were observed in Brepollen was 2014. Except for 2014, salinities above 34.9 (i.e., AW) was only observed in the Outer Part (and only in the years 2002, 2006 and 2013). In 2014 this high salinity water had also entered into the Main Basin for the first time during the studied period, and a tongue of this high salinity water can be followed into Brepollen; at sill level there was a layer of water with salinities above 34.8. In the deeper parts of Brepollen the salinity was higher in 2014 than in all the other years. The year 2011 was also unusual: the whole Hord was then covered by a 50 m thick surface layer in July, with salinities below 33 and temperatures from 0°C at 50 m to 2°C at the surface.
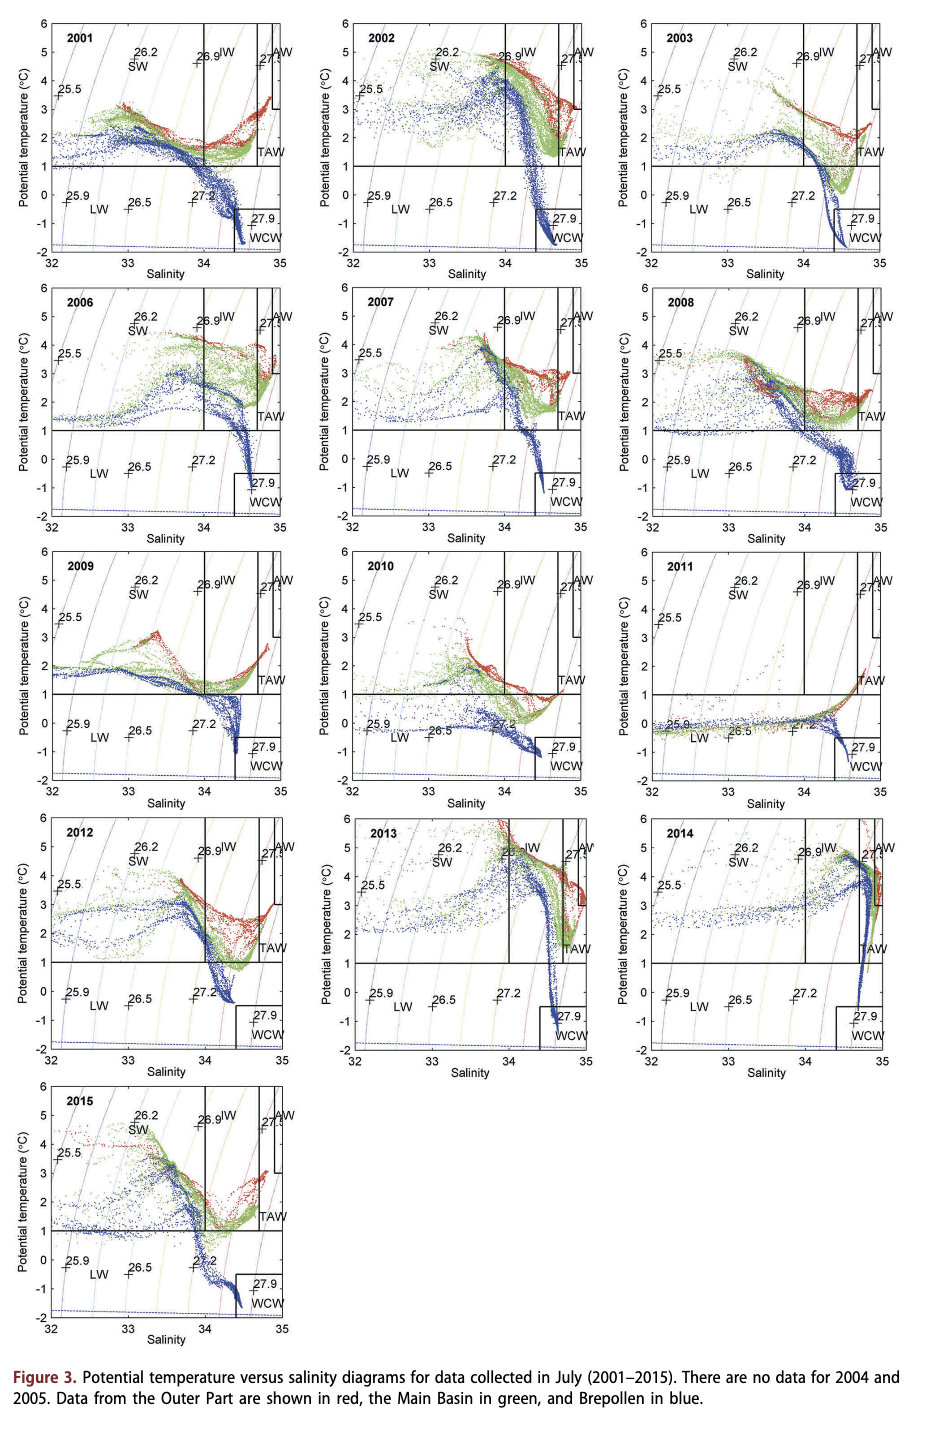
Temperature versus salinity (68) diagrams for each year are shown in Fig. 3. In the 68 diagrams the different water masses are indicated by boxes according to their definitions (Table 2). The most scattered and variable data are those found in the upper layer, i.e., the SW, which has been modified by the atmosphere and freshwater input. In Fig. 3 the lower salinity range for SW is set to 32 to make the 68 diagrams easier to read. Only in 2002, 2003 and 2011 were some salinity values below 29. A drop in temperature of the SW is observed in 2010 and is particularly notable in 2011, when most of the data points from the upper layer fall into the definition of LW instead of SW.
A clear difference can be seen for the deepest water masses in Fig. 3, where two characteristic ‘tails’ clearly define two distinct areas. The blue, for Brepollen, drops to lower temperatures and higher salinities with increasing density and the end of the tail enters the box of WCW for all years except 2012, while the green, Main Basin, mainly increase in temperature and salinity towards the definitions of TAW and AW. The only year that AW was found inside the Main Basin was in 2014. The data from the Outer Part of the section (red) show the same feature as the data from the Main Basin, although generally having slightly higher temperatures. In some years (2002, 2006, 2013 and 2014) data points also fall into the AW box, showing that AW was present close to the mouth of Hornsund in these years.
Figure 4 shows the schematic distribution of water masses (as described earlier and defined in Table 2) along the section in Hornsund around the end of July each year from 2001 to 2015. Starting from outside of the Hord mouth (Fig. 4) the water masses present in the Outer Part were typically SW, IW and TAW at the bottom. AW can be seen only in 2002, 2006, 2013 and 2014. In 2010 a layer of LW was also found, between IW and TAW, at depths between 100 and 150 m. In 2011 the SW was replaced by a 100 m thick layer of LW.
The water masses present in the Main Basin varied considerably from year-to-year. In 2001, 2009 and 2015 only IW was found below the SW, filling the whole basin down to the bottom. In most years TAW occupied the deepest part of the Hord, below the IW. In the years when AW was observed outside the fjord the TAW filled the Main Basin to a greater extent (2002, 2006, 2013 and 2014). LW was also present in the Main Basin in 2003, 2010 and 2011. Brepollen showed a quite different picture than the Main Basin. Here the dominant water masses below SW and IW were the locally produced winter waters, LW and WCW. Some exceptions from this can be seen in 2010 and 2011, when LW was found also at the surface, and in 2012, when it filled the area from ca. 50 m to the bottom. WCW was observed in Brepollen with varying amounts in all years except for 2012. TAW was found in Brepollen only in 2014.
The SW that forms during summer as a result of heating and input of freshwater was distributed along the entire fjord in almost every year, but was absent from Brepollen in 2010 and was more or less absent in the whole Hord in 2011. The thickness of the SW layer varied, from a few metres (2014) to about 70 m (2015). The summer hydrographic measurements revealed high variability in temperature and salinity in Hornsund. Calculated mean temperature and salinity from all the data in the whole section showed that 2011 had the lowest mean temperature (0.3°C) and salinity (33.3) while 2014 was the warmest (3.2° C) and most saline (34.6).
Mooring observations
To see how the hydrographic conditions were on the shelf outside Hornsund between 2010 and 2013, measurements from the mooring deployed outside of the Hord are shown in Fig. 5. The data recorded between 2010 and 2011 are from a depth of 24 m at the northern location (total depth of water column was 74 m) and clearly shows periods of summer and winter conditions (Fig. 5). During July 2010 the temperature increased rapidly from below 0°C to around 2°C and stayed around that temperature until midOctober with relatively low salinity. After this period a gradual decrease in temperature is observed with corresponding increase in salinity and density. This was the time of shift between summer and winter conditions, which was fully achieved after 19 December, when the temperature stayed near the freezing point. The steady winter conditions remained until the beginning of May 2011, when the first impulse of warm water, with temperatures above 0°C, occurred. The salinity decreased during late winter/spring and the water at 24 m got less saline with time, until the mooring was removed. During the whole period (July 2010-July 2011) only waters of Arctic origin were present at this location (at 24 m).

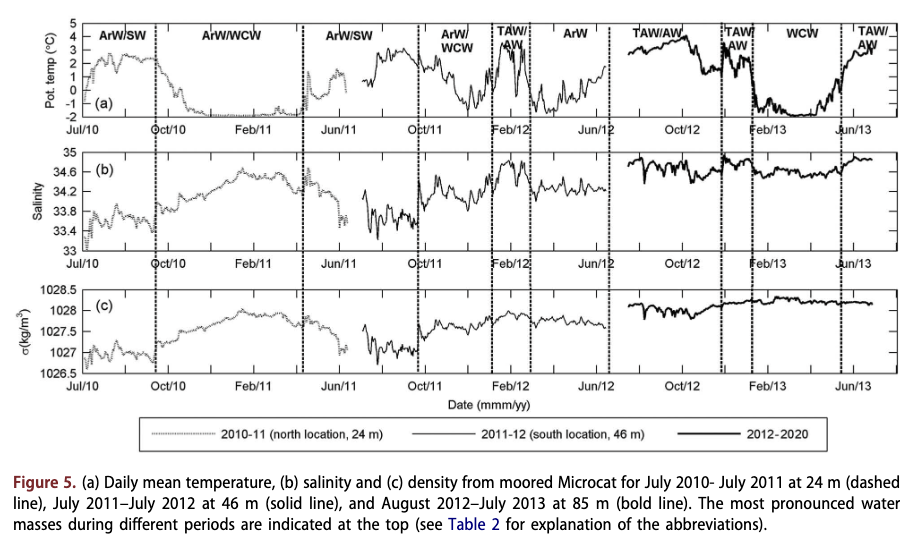
The time series of temperature, salinity, and density in 2011-12 (Fig. 5), now in the southern location and at 46 m (water depth 100 m), also showed increasing temperatures and low salinities until October. Summer conditions are coming to an end in the second part of October and the temperature is gradually decreasing, but with values still above 0°C until 6 December. However, instead of reaching freezing temperatures, a sudden increase in temperature started in January 2012. Between 5 and 25 February and between 6 and 11 March 2012 the water temperature was above 2°C and salinity ranged between 34.60 and 34.84. The highest temperature (3.54°C) was observed on 9 February, with a corresponding salinity of 34.76. So the winter of 2012 was characterized by high variability in water properties changing from ArW to TAW and back again. There was practically no time during which steady winter conditions prevailed. At the beginning of May the shift between winter and summer can be seen. The first occurrence of warm water (above 0°C), indicating the transition towards summer conditions, was on 13 May 2012. After 12 of June the temperature was above 0°C and increasing.
The time series of temperature, salinity, and density recorded in 2012-13 (Fig. 5), also in the south location but now at 85 m (water depth 100 m) showed summer conditions with increasing temperatures until 24 of October when a temperature of 4.08°C was reached. During this time salinity and density revealed high variability, but mostly the salinity was above 34.7, indicating the presence of TAW most of the time. After 24 October the temperature started to decrease with concomitant freshening. Compared to the previous year, also this year some pulses of warmer and more saline water entered the area during winter, one in December 2012 and one in January 2013. On 16 December the temperature and salinity were 3.54°C and 34.94, respectively, the pulse in January had slightly lower temperature. Both of these pulses had the characteristics of AW. A rapid decrease in temperature at the end of January gave winter conditions which remained until the beginning of May, when an increase in temperature gave rise to summer conditions. First impulse of warm (above 0°C) water was seen on 4 May. After 6 June the water temperature remained above 0°C, but with salinities high enough to classify this water as TAW.
Discussion
The long-term analysis of CTD measurements taken in Hornsund each year show high variability in the distribution of temperature and salinity and, hence,
water masses, even though the measurements were taken more or less at the same time each year (late July). It has been suggested that within an annual cycle, the waters on the West Spitsbergen Shelf and in the adjacent fjords normally switch from a state of Arctic dominance (cold and less saline in winter) to one of Atlantic dominance (warm and saline in summer) and back (Svendsen et al. 2002). If this also applies to Hornsund, then the high variability seen in July for the period 2001-2015 can indicate that the timing of this seasonal change/shift must vary between years.
Unfortunately, there are not enough data from all year round inside Hornsund that can verify this. However, the data from the mooring when it was located in the northern position (2010/11; Fig. 5) give indications of the seasonal evolution inside the Hord. This position likely captures the outflowing waters from Hornsund and can therefore provide information on conditions inside the fjord, at least for the upper layer (instrument at 24 m) from July 2010 to July 2011. The mooring observations from the northern location showed that the change from winter to summer conditions on the shelf took place between May and June in 2011. Moreover, measurements from a section taken across Hornsund in May 2013, not far from the mouth, showed that winter conditions still prevailed here (not shown), with only LW and WCW present at this time of the year. This suggests that the fjord generally contains only winter waters until May (or later) and that the transition from winter to summer conditions (when there is no more LW and/or WCW) takes place sometime during June or July, or even later. Patches of cold water, with the characteristics of LW, were still found in the Main Basin of the Hord in late July (Fig. 4) in some years (especially 2003, 2010 and 2011), indicating that during these years Hornsund was probably in a late transition phase.
An indication of different oceanic conditions shaping the summer hydrography in the Main Basin of the Hord is given by the mooring observations (Fig. 5) from the southern location (2011-13), since these waters may have entered Hornsund after passing the mooring. In the summer of 2011 and the spring 2012 the data reveal the presence of ArW from the SC on the shelf, at 46 m. In summer 2012 and 2013 the data showed mainly TAW, but these data are from 85 m (close to the bottom). This fits well with what is observed in most years in the Outer Part of Hornsund, with more Arctic type water present in the upper ca. 50 m and TAW normally at depths below 50-100 m.
A clear difference from the conditions described above for the Main Basin was seen in the hydrographic conditions in Brepollen, where the LW and WCW remained behind the sill in the summer (Fig. 4). This difference between the two basins has been mentioned earlier by Urbanski et al. (1980) and Swerpel (1985). The narrow entrance (ca. 2 km; Fig. 1) to Brepollen and the shallow sill (at ca. 50 m) that separates Brepollen from the Main Basin significantly restrict the exchange of water between the two basins. From the ‘tails’ in the temperature versus salinity diagrams (Fig. 3) it is clear that during summer the densest water in the Main Basin is of more Atlantic origin (mainly TAW), while Brepollen contains local waters (mainly WCW). Since Hornsund does not have a sill at the mouth, the Main Basin is more open towards the Outer Part and the conditions in the Main Basin are therefore more influenced by water masses exchanged with the SC on the shelf; the deeper parts of the Main Basin are also open to possible inflow of waters of Atlantic origin. The waters from the Main Basin that can enter Brepollen above the sill that separates the two basins are clearly not dense enough during summer to sink down and replace the deeper waters produced during the last winter in Brepollen. Moreover, the circulation of waters inside Brepollen is assumed to be circular (anticyclonic/cyclo- nic) with changes due to tides and wind pattern (Swerpel 1985). All these factors facilitate the maintenance and deposition of cold and dense water in Brepollen, making it the largest reservoir of WCW in Hornsund (Fig. 4) during summer.
Two summers stand out as more extreme than the others - 2011 and 2014 - and indicate contrasting regimes. In July 2011 the upper water column along the fjord was filled with very cold water with temperature around 0°C and with quite low salinities. The difference between 2011 and other cold years (e.g., 2003 and 2010) was that in 2011 the decrease in temperature was accompanied by large input of less saline water (at ca. 10-50 m). This freshening in the upper layer was caused by the inflow of drifting ice carried by the SC from the Barents Sea (Kraszewski 2012); highly concentrated pack ice entered the fjord twice in July 2011. The first inflow was at the beginning of July and then a second, even stronger, inflow, started on the 13 of July. Sea ice, with a concentration of 7-10/10, occupied the Hord to a large extent (Kraszewski 2012). At the time of measurements this anomalous concentration of drifting sea ice was also observed by two of the authors over the whole south-western Svalbard shelf during the summer cruise of the RV Oceania in 2011. From the sea-ice concentration data obtained from the Integrated Climate Date Center, the mean sea-ice concentration on the shelf south of Hornsund (Fig. lb) was calculated for each July (Fig. 6d). This shows that such inflow events were possible in July 2001, 2004, 2005, 2008 and 2011. The year with highest mean sea ice concentration in the SC in July was 2004, which was the year that no measurements were taken inside Hornsund due to severe ice conditions in the fjord, while the second highest was 2011. The other three years showed much lower ice concentrations.
The summer of 2014, in contrast, turned out to be the warmest and most saline during the study period (Fig. 2). The main reason for this was the amount of warm and saline AW observed far into the Main Basin this year, in contrast to earlier years, when it had only been observed a few times in the Outer Part, close to the mouth area. Intrusions of AW and possible pathways and mechanisms for AW from the WSC to enter Spitsbergen Hords will be discussed later.
Despite the high variability in mean summer temperatures and salinities between years, a general warming and increase in salinity may have taken place in Hornsund over this period. Temperature and salinity anomalies were calculated by subtracting long-term (2001-2015) summer mean (1.79°C and 34.00) from mean values of particular years. A positive linear trend of 0.03°C yr-1 and 0.005 yr-1 for temperature and salinity, respectively, was found for the period 2001-2015. For the period 2006-2015 it was slightly higher, with positive linear trend in temperature of 0.04°C yr-1 and 0.009 yr-1 for salinity, but the trends were not statistically significant (p > 0.05). A thorough analysis of a much longer time series was presented by Pavlov et al. (2013) for Isfjorden and Gronfjorden (the latter is a side Hord of Isfjorden) further north. They used historical temperature data and found an overall warming trend of 1.9°C/decade and 2.1°C/decade, respectively, for these two fjords for the period 1912-2009. They also found that the early 21st century warming was substantially stronger in comparison with historical data before the year 2000. A much longer time series is needed to verify if there is a similar warming trend in Hornsund. However, the above calculated values could indicate a possible lower warming trend per decade in Hornsund compared to Isfjorden.
Comparison with external factors: ocean, atmosphere and sea ice
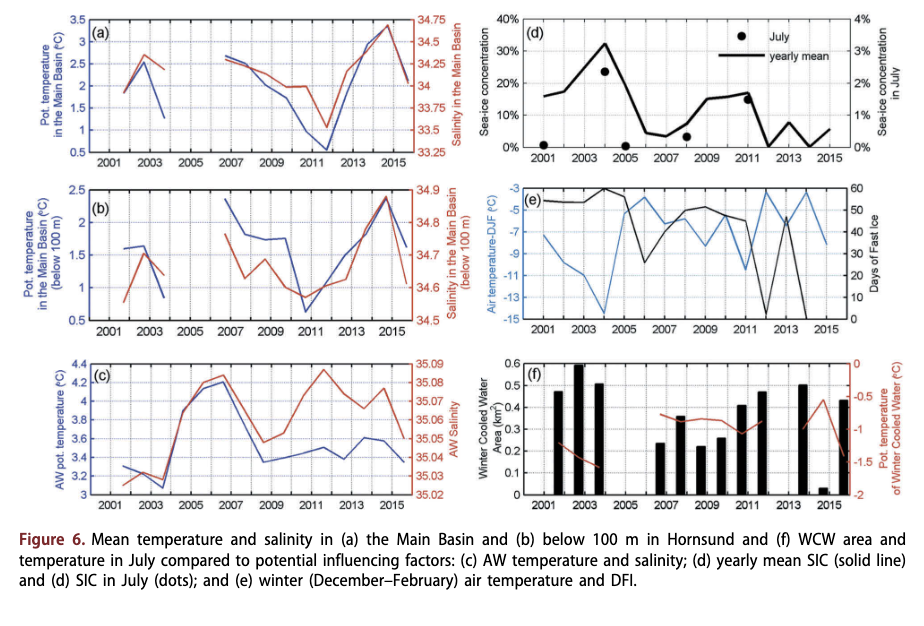
Our measurements showed that the Main Basin is the part of Hornsund that is influenced by the exchange of waters from outside. Figure 6 gives an impression of the relevance of the two currents (the SC and the WSC) on the hydrographic conditions in Hornsund by showing weighted mean temperature and salinity in the Main Basin for each year, together with the calculated yearly mean sea-ice concentration in the SC (Fig. lb) and the mean temperature and salinity of the AW in the WSC in July at Section N (Fig. la). SC, in addition to the ArW, typically carries large amounts of sea-ice pack in winter and occasionally in summer months. A pronounced negative correlation was found between mean temperature in the Main Basin and calculated yearly mean sea-ice concentration (R = -0.68) for the period 2001-2015 (Table 3). Correlation between mean salinity in the Main Basin and yearly mean sea-ice concentration was also high (R = -0.50) but it slightly exceeded the level of being statistical significant (p = 0.081). Comparing the mean temperature and salinity in the Main Basin with that of AW in the WSC (Fig. 6a, c) reveals that in some years they correspond well while in other years they are in counter phase. Hence, these data showed a weak or statistically insignificant correlation (Table 3). This implies that the ArW from the SC probably has a stronger influence on the mean hydrographic conditions in the Main Basin than the waters carried in the WSC. On the other hand, if only water below 100 m is taken into consideration (Fig. 6b), where typically waters of Atlantic origin are found, there is a significant correlation (Table 3) between the mean temperature below 100 m in the Main Basin and the mean AW temperature in Section N (Fig. 6c).

Our measurements also revealed that WCW was present only in Brepollen and not in the Main Basin during summer (Fig. 4) and a significant variability in the amount of WCW in Brepollen could also be seen between the different years. The area of the along-fjord section occupied by WCW has been calculated, together with the weighted mean temperature of the WCW for each year (Fig. 6f) to better see this variability. Since the production of WCW is shaped by climatological conditions (e.g., air temperature and ice production) during winter (Svendsen et al. 2002), the mean December-February air temperature for each year has also been calculated and is shown in Fig. 6e, together with the DFI. The air temperatures used for these calculations were obtained from the Polish Polar Station in Hornsund. This station is situated on the northern side of the Main Basin (Fig. 1c) so these air temperatures are from the closest weather station and not actually from Brepollen. The DFI values are taken from Table 2 in Muckenhuber et al. (2016). This DFI index describes the fast-ice conditions in Hornsund over a considered time period in a single value with unit days and both temporal and spatial extent of the fast ice is included (Muckenhuber et al. 2016).
Muckenhuber et al. (2016) showed a significant reduction in monthly averaged fast ice coverage when comparing the time periods 2000-05 and 2006-2014. For Hornsund the seasonal maximum in ice cover decreased from 52.6 to 35.2%, respectively, for the two periods. Hence, larger areas of Hornsund were covered by fast ice during the winters 2001-03, which is consistent with generally larger areas of WCW for the same period (Fig. 6f). The WCW temperature was also close to the freezing point (Fig. 2) in the deepest parts during these years and the mean temperature of the WCW ranged between -1.26°C and -1.54°C. After 2006 a significant thinning and warming of the WCW in Brepollen took place (Fig. 6f). Only in 2010, 2013 and 2015 was the mean temperature in this layer below -1° C, in the other years the values were slightly below -0.5° C. No WCW was observed in summer 2012 and very little in 2014. The extremely high air temperature during winters 2011/12 (Hansen et al. 2014; Nordli et al. 2014) and 2013/14 (Laszyca et al. 2015), which resulted in very low ice cover (Muckenhuber et al. 2016) in Hornsund during these winters, could have caused these two minima in 2012 and 2014. Nordli et al. (2014), who have produced a time series of air temperature around Svalbard for the period 1898-2012, showed that an extreme warming took place between 2005 and 2012 when compared to earlier years, with higher temperature variability during winter than summer.
Linear regressions performed between the amount of WCW and winter (December-February) air temperature and DFI confirms the assumption that the atmosphere and sea-ice conditions in the Hord has a strong influence on the WCW production. A strong negative (R = -0.76) and positive (R = 0.78) correlation, respectively (Table 3), were found. The mean temperature of the WCW in July each year also showed a good correlation with the winter air temperature (R = 0.69; Table 3), giving further evidence that the atmospheric conditions during winter is important for the properties of the WCW the next summer. An unexpected correlation was found between the mean WCW temperature in Brepollen and the mean AW temperature in Section N (R = 0.66, Table 3). This high correlation probably reflects the influence of AW on the air temperatures in the region as a result of large heat fluxes. Walczowski & Piechura (2011) emphasized the importance of the WSC in shaping the local climate.
The increased winter air temperature is an important factor leading to decreased sea ice cover in Hornsund in recent years (Muckenhuber et al. 2016). This is probably the main but not the only factor influencing the amount and properties of the WCW. Polynya activity caused by winds in the area, which would further help to increase ice production, has not been considered. Brepollen used to be covered by fast ice throughout the winter, but this is now changing.
Influence of Atlantic water
From our summer data we can only see the presence of AW inside Hornsund in 2014 and that it is present on the shelf outside the mouth only in July 2002, 2006, 2013 and 2014. In January-February 2012 the mooring showed the presence of TAW at 46 m (Fig. 5). Although AW most probably was present below the TAW on the shelf outside Hornsund at this time, we do not know if TAW/AW entered into Hornsund during this period. It was, however, not observed in the Outer Part in July 2012. The winter 2012/13 data (Fig. 5) showed pulses of AW on the shelf. But having a closer look at 5 it is clear that in April-May in both 2012 and 2013 the warm water (TAW/AW) had been replaced by water dose to the freezing point (ArW). In July 2013 the mooring data again showed temperature and salinity values (at 85 m) consistent with AW properties (the CTD measurements showed a thick layer of AW in the Outer Part (Fig. 4) at the same time). The mooring data dearly show that TAW/AW can be present on the shelf outside Hornsund, also during winter, and that the water circulating around Hornsund Banker» changes from typical ArW to AW during certain periods, in the form of pulses. From our limited sets of data it is not possible to say how often this shift takes place.
From the literature it is known that the year-round present warm and saline AW in the WSC sometimes propagates onto the shelf and further into some of the west Spitsbergen Hords (Saloranta & Svendsen 2001; Svendsen et al. 2002; Cottier et al. 2005; Nilsen et al. 2008; Tverberg & Nost 2009; Tverberg et al. 2014; Inall et al. 2015; Nilsen et al. 2016). These intrusions depend on the combination and strength of external (wind pattern, sea ice) and local (sea-ice and brine production) environmental factors (Svendsen et al. 2002; Cottier et al. 2005; Nilsen et al. 2008). The timing and extent to which AW occupies particular fjords differ from year to year. Previous studies in Kongsfjorden (Cottier et al. 2005) and Isfjorden (Nilsen et al. 2008) have shown that AW penetration is normally inhibited by a density front at the fjord mouth during winter. But slow modification of the Hord water during spring time reduces the effectiveness of this geostrophic control, so that during summer AW may intrude into these fjords, switching them from being Arctic-dominant to Atlantic-dominant. Throughout the summer AW continues to intrude and by September reaches a quasi- steady-state condition. These fjords then adopt a ‘cold’ or ‘warm’ mode according to the degree of AW occupation (Cottier et al. 2005).
According to this classification, one could say that Hornsund adopted the ‘warm’ mode in the years 2002, 2006, 2013 and 2014. However, summer 2014 was the only year when pure AW was observed inside the Main Basin and TAW reached the inner part of the Hord, Brepollen, resulting in the warmest year during the study period (Fig. 4). For the other ‘warm’ years AW was restricted only to the Outer Part of Hornsund, close to the Hord mouth, and TAW occupied the Main Basin to a lesser extent and did not enter into Brepollen. Evidence of strong Atlantic conditions in summers 2002 and 2006 have been reported for both Kongsfjorden (Cottier et al. 2005; Harms et al. 2007) and Isfjorden (Nilsen et al. 2008). These AW inflows were related to an extensive occupation of AW on the West Spitsbergen Shelf (Cottier et al. 2005; Nilsen et al. 2008). Of the three Hords - Kongsfjorden in the north, Isfjorden in the middle and Hornsund in the south - Kongsfjorden is the most influenced when it comes to inflow of AW (both in number of years and highest salinity), while Hornsund is the less influenced, with inflow of AW only in summer 2014. In a recent review paper for Kongsfjorden, Tverberg et al. (in press) show that AW was present in Kongsfjorden in varying degrees more or less every summer, but to a lesser degree before 2002 than afterwards. Nilsen et al. (2008); show transects along Isfjorden taken in August/September for the years 1999 to 2005. During these years AW was only observed inside Isfjorden in 2002, and in 2000 and 2004 only at the mouth of the fjord. For the years after 2005, reports by University Centre in Svalbard students each autumn semester, reporting the results of the student cruises along the same transect in Isfjorden in late August/beginning of September each year, show that AW was present inside Isfjorden in 2008, 2009, 2012, 2013 and 2014, and only at the mouth in 2007 and 2011. The salinity of the AW inside Kongsfjorden (Tverberg et al. in press) is generally higher when compared to observations further south (Nilsen et al. 2008; Adamek 2013; Nygren 2013; Helhnuth 2014; Tollinger 2014; this paper).
Although similar mechanisms governing ice production, with brine release and salinity increase of the water column, are present in the three Hords, local variability in freezing conditions, including wind stress, can lead to different salinity and density gradients between the Hords and the shelf water masses, with the implications that exchange of water masses during and after the freezing season differs for the three Hords. One important aspect is that the SC passes Hornsund first on its path northwards along the coast. The ArW in this coastal current must be colder as it passes Hornsund since it has been shown that the shelf water gains significant amount of heat from the WSC (Saloranta & Haugan 2004) along the west coast of Spitsbergen, which leads to melting of the drifting sea ice in the SC (Tverberg et al. 2014), thereby reducing the influence of cold and fresher ArW towards the north. Hence, the density gradient between AW and ArW probably changes northward, making it easier for AW to penetrate into the Hords further north than into Hornsund. Compared with
Kongsfjorden, Hornsund has been regarded as a fjord with a more Arctic character (W^slawski et al. 2006).
The mooring observations (Fig. 5) also confirm previous studies revealing that AW can also propagate onto the shelf during winter. Tverberg & Nest (2009) find that the density gradient across the front between AW and ArW is of vital importance for the cross-front exchange of water masses and Tverberg et al. (2014) suggest that eddy overturning across the front is the dominant process for supplying AW to the shelf during winter. A recent study by Nilsen et al. (2016) showed that changes in the sea-surface elevation on the West Spitsbergen Shelf due to large-scale wind systems can force AW from the WSC onto the shelf and over isobaths that directly guides the warm water into troughs and towards the fjords along West Spitsbergen. Passages of strong cyclones in the Fram Strait, which pile up water along the west Spitsbergen coastline, will set up topographically guided currents into the troughs indenting the West Spitsbergen Shelf. Some of the AW in the barotropic WSC branch is then forced to circulate in these troughs, as demonstrated by their shelf circulation model. According to this, the Hornsund Deep (between Serkapp Banken and Hornsund Banker») may guide AW all the way from the WSC to the mouth area of Hornsund given the right conditions. However, the Hornsund Deep is rather narrow and shallow in comparison to the broader and deeper troughs leading to Kongsfjorden or Isfjorden, and this may be another factor that restricts the amount of AW reaching the mouth of Hornsund.
Conclusion
This detailed description of hydrographic conditions in Hornsund over the period 2001-2015 helps fill a gap in our knowledge of the physical oceanography of the fjords along west coast of Svalbard. Our study shows that variability in water temperature, salinity and water mass distribution in Hornsund results from differences in timing of the transition between winter and summer conditions and a complex effect of oceanic, atmospheric and local factors (e.g., sea ice). We have shown that Hornsund shares many common hydrographic features with other Svalbard Hords, e.g., a warming trend caused by the increasing presence of Atlantic origin waters over locally formed waters. This reflects the sensitivity of the fjord to recent atmospheric and oceanic changes observed in the Svalbard region. However, the most important outcome of this work is in documenting the strong influence of the SC. The summer of 2014 was the only time when AW was observed in Hornsund. In other years AW was present in the form of TAW. Our data draw attention to the study of ArW carried by the SC as an equally important factor as AW, widely studied as the main contributor influencing the variability of hydrographic conditions of the fjords along the west coast of Svalbard. We provided evidence of increased influence of the SC based on sea-ice concentration data. However, further investigation needs to be done to parametrize the ArW in the SC. This might be quite a challenge, as unlike AW in the WSC, ArW is highly variable on account of mixing with sea-ice meltwater and terrestrial runoff. Still, this could be useful for a detailed study of the interactions between the WSC and the SC and for qualitative and quantitative estimations of the northward transformation of both currents and, finally, to improve our understanding of the influence on hydrographic conditions of the fjords along Svalbard’s western coast.
Acknowledgments
We thank the crew of the RV Oceania for assistance during measurements and all scientists, technicians and students who contributed to the collection of the impressive hydrographic database from Hornsund. We would like to also thank the Institute of Geophysics, Polish Academy of Science, and especially Tomasz Wawrzyniak, for providing meteorological data from the Polish Station in Hornsund. We thank Joanna Pardus for providing data for the basemap preparation and Ilona Goszczko for valuable comments and suggestions in an early version of the manuscript. Finally, we would like to thank three anonymous reviewers for very constructive comments and suggestions which significantly improved the manuscript.
Disclosure statement
No potential conflict of interest was reported by the authors.
Funding
The main part of this study was supported by the statutory research funding, subject 1.4, carried out by the Institute of Oceanology, Polish Academy of Sciences, in Sopot. Additional financial support was received from the Polish-Norwegian project Arctic Climate System of Ocean, Sea Ice and Glacier Interactions in Svalbard (AWAKE-2; Pol-Nor/198675/17/2013). The largest part of the archival data was processed under the activity of the project Growing of the Arctic Marine Ecosystems (GAME), financed by the Polish National Science Center funds (grant no. DEC-2012/04/A/NZ8/00661). Publication costs were partially covered by funds from the Leading National Research Centre (KNOW), received by the Centre for Polar Studies for the period 2014-18.
References
- Adamek D. 2013. Hydrographic patterns in Hornsund. In: Polar ocean climate. AGF-214. Field report 2013. Pp. 85-98. Longyearbyen: The University Centre in Svalbard. Available on request from library@unis.no.
- Beszczynska-Moller A., Weslawski J.M., Walczowski W. & Zajaczkowski M. 1997. Estimation of glacial meltwater discharge into Svalbard coastal waters. Oceanologia 39, 289-298.
- Blaszczyk M., Jania J.A. & Kolondra L. 2013. Fluctuations of tidewater glaciers in Hornsund Hord (southern Svalbard) since the beginning of the 20th century. Polish Polar Research 34, 327-352.
- Cohen J., Screen J.A., Furtado J.C., Barlow M., Whittleston D., Counou D., Francis J., DethloffK., Entekhabi D., Overland J. & Jones J. 2014. Recent Arctic amplification and extreme mid-latitude weather. Nature Geoscience 7, 627-737.
- Cottier F., Nilsen F., Inall M.E., Gerland S., Tverberg V. & Svendsen H. 2007. Wintertime warming of an Arctic shelf in response to large-scale atmospheric circulation. Geophysical Research Letters 34, doi: 10.1029/ 2007GL029948.
- Cottier F., Nilsen F., Skogseth R., Tverberg V., Skardhamar J. & Svendsen H. 2010. Arctic Hords: a review of the oceanographic environment and dominant physical processes. In J.A. Howe et al. (eds.): Fjord systems and archives. Vol. 344. Pp. 35-50. London: Geological Society.
- Cottier F., Tverberg V., Inall M.E., Svendsen H., Nilsen F.
- & Griffiths C. 2005. Water mass modification in an Arctic Hord through cross-shelf exchange: the seasonal hydrography of Kongs!) orden, Svalbard. Journal of Geophysical Research—Oceans 110, doi: 10.1029/ 2004JC002757.
- Fer I. & Adlandsvik B. 2008. Descent and mixing of the overflow plume from Storfjord in Svalbard: an idealized numerical model study. Ocean Science 4, 115-132.
- Francis J. & Skific N. 2015. Evidence linking rapid Arctic warming to mid-latitude weather patterns. Philosophical Transactions of the Royal Society A 373, article no. 20140170, doi: 10.1098/rsta.2014.0170.
- Francis J.F. & Vavrus SJ. 2012. Evidence linking Arctic amplification to extreme weather in mid-latitudes. Geophysical Research Letters 39, doi: 10.1029/ 2012GL051000.
- Gerland S. & Hall R. 2006. Variability of fast-ice thickness in Spitsbergen fjords. Annals of Glaciology 44, 231-239.
- Gorlich K. 1986. Glacimarine sedimentation of muds in Hornsund fjord, Spitsbergen. Annales Societatis Geologorum Poloniae 56, 433-477.
- Haarpaintner J., O’Dwyer J., Gascard J.C., Haugan P.M., Schauer U. & Osterhus S. 2001. Seasonal transformation of water masses, circulation and brine formation observed in Storfjorden, Svalbard. Annals of Glaciology 33, 437-443.
- Hansen B.B., Isaksen K., Benestad R., Kohler J., Pedersen, Loe L.E., Coulson SJ., Larsen J.O. & Varpe 0. 2014. Warmer and wetter winters: characteristics and implications of an extreme weather event in the High Arctic. Environmental Research Letters 9, article no. 114021, doi: 10.1088/1748-9326/9/11/114021.
- Harms A.A.P., Tverberg V. & Svendsen H. 2007. Physical qualification and quantification of the water masses in the Kongsfjorden-Krossfjorden system cross section. In: Oceans 2007—Europe, 18-21 June. Conference proceedings. IEEE Xplore Digital Library, doi: 10.1109/ OCEANSE.2007.4302332.
- Helhnuth F. 2014. Hydrographic patterns in Hornsund. In: Polar ocean climate. AGE-214. Field report 2014. Pp. 9- 24. Longyearbyen: The University Centre in Svalbard. Available on request from library@unis.no.
- Holland D., Thomas R., De Young B., Ribergaard M. & Lyberth B. 2008. Acceleration of Jakobshavn Isbrae triggered by warm subsurface ocean waters. Nature Geosciences 1, 659-664.
- Hopkins T.S. 1991. The GIN Sea—a synthesis of its physical oceanography and literature review 1972-1985. Earth-Science Reviews 30, 175-318.
- Inall M.E., Murray T., Cottier F.R., Scharrer K., Boyd TJ., Heywood KJ. & Bevan S.L. 2014. Oceanic heat delivery via Kangerdlugssuaq Fjord to the south-east Greenland ice sheet. Journal of Geophysical Research—Oceans 119, 631-645.
- Inall M.E., Nilsen F., Cottier F.R. & Daae R. 2015. Shelf/ Hord exchange driven by coastal-trapped waves in the Arctic. Journal of Geophysical Research—Oceans 120, 8283-8303.
- IPCC 2014. Climate change 2014. Synthesis report. Geneva: Intergovernmental Panel on Climate Change.
- Isaksen K., Nordli 0., Forland EJ., Lupikasza E., Eastwood S. & Nied^wied^ T. 2016. Recent warming on Spitsbergen—influence of atmospheric circulation and sea ice cover. Journal of Geophysical Research— Atmospheres 121, 11913-11931.
- Kaleschke L., Liipkes C., Vihma T., Haarpaintner J., Bochert A., Hartmann J. & Heygster G. 2001. SSM/I sea ice remote sensing for mesoscale ocean-atmosphere interaction analysis. Canadian Journal of Remote Sensing 27, 526-537.
- Kern S., Kaleschke L. & Spreen G. 2010. Climatology of the Nordic (Irminger, Greenland, Barents, Kara and White/ Pechora) seas ice cover based on 85 GHz satellite microwave radiometry: 1992-2008. Tellus A: Dynamic Meteorology and Oceanography 62, 411-434.
- Kraszewski G. 2010. Zlodzenie Hornsundu (Spitsbergen) w sezonie zimowym 2008-2009. (Ice conditions in Hornsund [Spitsbergen] during winter season 2008-2009.) Problemy Klimatologii Polarnej 20,187-196.
- Kraszewski G. 2011. Zlodzenie Hornsundu w sezonie zimowym 2009-2010 (SW Spitsbergen). (Ice conditions in Hornsund during winter season 2009-2010 [SW Spitsbergen].) Problemy KlimatologiiPolarnej21,229-239.
- Kraszewski G. 2012. Zlodzenie Hornsundu i wod przyleglych (Spitsbergen) w sezonie zimowym (Ice conditions in Hornsund and adjacent waters [Spitsbergen] during winter season 2010-2011.) Problemy Klimatologii Polarnej 22 69-82.
- Kraszewski G. 2013. Zlodzenie Hornsundu i wod przyleglych (Spitsbergen) w sezonie zimowym (Ice conditions in Hornsund and adjacent waters [Spitsbergen] during winter season 2011-2012.) Problemy Klimatologii Polarnej 23, 169-179.
- Laszyca E., Perchaluk J., K^pski D., Gorski Z. & Wawrzyniak T. (eds.) 2015. Meteorological bulletin. Summary of the year 2014. Warsaw: Institute of Geophysics, Polish Academy of Sciences.
- Luckman A., Benn D.I., Cottier F., Bevan S., Nilsen F. & Inall M. 2015. Calving rates at tidewater glaciers vary strongly with ocean temperature. Nature Communications 6, article no. 8566, doi: 10.1038/ncomms9566.
- Marsz A.A. & Styszynska A. (eds.) 2013. Climate and climate change at Hornsund, Svalbard. Gdynia: Gdynia Maritime University.
- Miller G.H., Alley R.B., Brigham-Grette J., Fitzpatrick JJ., Polyak L., Serreze M.C. & White J.W.C. 2010. Arctic amplification: can the past constrain the future? Quaternary Science Reviews 29, 1779-1790.
- Moskalik M., Grabowiecki Tagowski J. & Zulichowska M. 2013. Bathymetry and geographical regionalization of Brepollen (Homsund, Spitsbergen) based on bathymetric profiles interpolations. Polish Polar Research 34, 1-22.
- Muckenhuber 8., Nilsen F., Korosov A. & Sandven S. 2016. Sea ice cover in Isfjorden and Homsund, Svalbard (2000-2014) from remote sensing data. The Cryosphere 10, 149-158.
- Nick F.M., Vieli A., Howat I.M. & Joughin I. 2009. Large- scale changes in Greenland outlet glacier dynamics triggered at the terminus. Nature Geosciences 2, 110-114.
- Nilsen F., Cottier F., Skogseth R. & Mattsson S. 2008. Fjord-shelf exchanges controlled by ice and brine production: the interannual variation of Atlantic Water in Isfjorden, Svalbard. Continental Shelf Research 28, 1838- 1853.
- Nilsen F., Skogseth R., Vaardal-Lunde J. & Inall M. 2016. A simple shelf circulation model—intrusion of Atlantic Water on the West Spitsbergen Shelf. Journal of Physical Oceanography 46, 1209-1230.
- Nordli 0., Przybylak R., Ogilvie A.EJ. & Isaksen K. 2014. Long-term temperature trends and variability on Spitsbergen: the extended Svalbard Airport temperature series, 1898-2012. Polar Research 33, article no. 21349, doi: 10.3402/polar.v33.21349.
- Nygren A. 2013. Hydrographic patterns in Billefjorden and Isfjorden. In: Polar ocean climate. AGF-214. Field report 2013. 7-17. Longyearbyen: The University Centre in Svalbard. Available on request from library@unis.no.
- Osinski R., Wieczorek P., Beszczynska-Moller A. & Goszczko I. 2003. ADCP-referenced geostrophic velocity and transport in the West Spitsbergen Current. Oceanologia 45, 425-435.
- Parkinson C.L. & Comiso J.C. 2013. On the 2012 record low Arctic sea ice cover: combined impact of preconditioning and an August storm. Geophysical Research Letters 40, 1356-1361.
- Pavlov A.K., Tverberg V., Ivanov B.V., Nilsen F., Falk- Petersen S. & Granskog M.A. 2013. Warming of Atlantic Water in two Spitsbergen Hords over the last century (1912-2009). Polar Research 32, article no. 11206, doi: 10.3402/polar.v32i0.11206.
- P^tlicki M., Cieply M., Jania J.A., Prominska A. & Kinnard C. 2015. Calving of tidewater glacier driven by melting at the waterline. Journal of Glaciology 61, 851-863.
- Rignot E., Koppes M. & Velicogna I. 2010. Rapid submarine melting of the calving faces of West Greenland glaciers. Nature Geosciences 3, 187-191.
- Saloranta T.M. & Haugan P. 2004. Northward cooling and freshening of the warm core of the West Spitsbergen Current. Polar Research 23, 79-88.
- Saloranta T.M. & Svendsen H. 2001. Across the Arctic front west of Spitsbergen: high-resolution CTD sections from 1998-2000. Polar Research 20, 177-184.
- Schlitzer R. 2014. Ocean data view software package. Accessed on the internet at http://www.odv.awi.de on 3 October 2015.
- Serreze M.C. & Barry R.G. 2011. Processes and impacts of Arctic amplification: a research synthesis. Global and Planetary Changes 77, 85-96.
- Simmonds I. & Rudeva I. 2012. The great Arctic cyclone of August 2012. Geophysical Research Letters 39, L23709, doi: 10.1029/2012GL054259.
- Skardhamar J. & Svendsen H. 2010. Short-term hydrographic variability in a stratified Arctic Hord. Geological Society of London Special Publications 344, 51-60.
- Skogseth R., Haugan P.M. & Haarpaintner J. 2004. Ice and brine production in Storfjorden from four winters of satellite and in situ observations and modeling. Journal of Geophysical Research—Oceans 109, doi: 10.1029/ 2004JC002384.
- Skogseth R., Haugan P.M. & Jakobsson M. 2005. Water mass transformations in Storfjorden. Continental Shelf Research 25, 667-695.
- Skogseth R., Smedsrud L.H., Nilsen F. & Fer I. 2008. Observations of hydrography and downflow of brine- enriched shelf water in the Storfjorden polynya, Svalbard. Journal of Geophysical Research—Oceans 113, doi: 10.1029/2007jc004452.
- Spreen G., Kaleschke L. & Heygster G. 2008. Sea ice remote sensing AMSR-E 89-GHz channels. Journal of Geophysical Research—Oceans 113, C02S03, doi: 10.1029/2005)0003384.
- Styszynska A. 2009. Zlodzenie Hornsundu i jego przedpola (SW Spitsbergen) w sezonie zimowym 2007/2008. (Ice conditions in Homsund and its foreshore [south-west Spitsbergen] during winter season 2007/08.) Problemy Klimatologii Polarnej 19, 247-267.
- Styszynska A. & Kowalczyk M. 2007. Zlodzenie Hornsundu i jego przedpola (SW Spitsbergen) w sezonie zimowym 2005-2006. (Ice conditions in Homsund and its foreshore [south-west Spitsbergen] during winter season 2005/06.) Problemy Klimatologii Polarnej 17, 147-158.
- Styszynska A. & Rozwadowska A. 2008. Zlodzenie Hornsundu i jego przedpola (SW Spitsbergen) w sezonie zimowym 2006/2007. (Ice conditions in Homsund and its foreshore [south-west Spitsbergen] during winter season 2006/07). Problemy Klimatologii Polarnej 18, 141- 160.
- Swerpel S. 1985. The Homsund fiord: water masses. Polish Polar Research 6, 475-496.
- Tollinger M. 2014. Hydrographic patterns in Isfjorden. In: Polar ocean climate. AGF-214. Field report 2014. Pp. 51- 61. Longyearbyen: The University Centre in Svalbard. Available on request from library@unis.no.
- Tverberg V. & Nost O.A. 2009. Eddy overturning across a shelf edge front: Kongsfjorden, west Spitsbergen. Journal of Geophysical Research—Oceans 114, doi: 10.1029/ 2008JC005106.
- Tverberg V., Nost O.A., Lydersen C. & Kovacs K. 2014. Winter sea ice melting in the Atlantic Water subduction area, Svalbard Norway. Journal of Geophysical Research —Oceans 119, 5945-5967.
- Tverberg V., Skogseth R., Cottier F., Sundfjord A., Walczowski W., Inall M., Falck E., Pavlova O. & Nilsen F. in press. The Kongsfjorden Transect: seasonal and inter-annual variability in hydrography. In H. Hop & C. Wiencke (eds.): The ecosystem Kongsfjorden, Svalbard. Berlin: Springer.
- Urbanski J., Neugebauer E., Spacjer R. & Falkowska L. 1980. Physico-chemical characteristic of the waters of Homsund Hord on south-west Spitsbergen (Svalbard Archipelago) in the summer season 1979. Polish Polar Research 1,43-52.
- Velicogna I. 2009. Increasing rates of ice mass loss from the Greenland and Antarctic ice sheets revealed by GRACE. Geophysical Research Letters 36, doi: 10.1029/ 2009GL040222.
- Walczowski W. 2013. Frontal structures in the West Spitsbergen Current margins. Ocean Science 9, 957-975.
- Walczowski W. & Piechura J. 2011. Influence of the West Spitsbergen Current on the local climate. International Journal of Climatology 31, 1088-1093.
- Walczowski W., Piechura J., Goszczko I. & Wieczorek P. 2012. Changes in Atlantic Water properties: an important factor in the European Arctic marine climate. ICES Journal of Marine Science 69, 864-869.
- Walsh J.E. 2014. Intensified warming of the Arctic: causes and impacts on middle latitudes. Global and Planetary Change 117, 52-63.
- Waslawski J.M., Koszteyn J., Zajczkowski M., Wiktor J. & Kwasniewski S. 1995. Fresh water in Svalbard fjord ecosystem. In H.R. Skjoldal et al. (eds.): Ecology of fiords and coastal waters: proceedings of the Mare Nor Symposium on the Ecology of Fjords and Coastal waters, Tromso, Norway, 5-9 December, 1994. Pp. 229-241. Amsterdam: Elsevier.
- Waslawski J.M., Kwasniewski S., Stempniewicz L. & Blachowiak-Samolyk K. 2006. Biodiversity and energy transfer to top trophic levels in two contrasting Arctic Hords. Polish Polar Research 27, 259-278.
- Xia W., Xie H. & Ke C. 2014. Assessing trend and variation of Arctic sea-ice extent during 1979-2012 from a latitude perspective of ice edge. Polar Research 33, article no. 21249, doi: 10.3402/polar.v33.21249.
Related Articles
Mattia Greco
Tine L. Rasmussen
Michal Kucera
Julie Meilland
et al.
Michał Hubert Węgrzyn
Beata Cykowska-Marzencka
Monica Alterskjær Sundset
Paulina Wietrzyk-Pełka
et al.
Shunan Cao
Jianfeng He
Fang Zhang
Ling Lin
et al.
Luidmila A. Pestryakova
Ulrike Herzschuh
Ruslan Gorodnichev
Sebastian Wetterich
et al.
Øyvind Nordli
Rajmund Przybylak
Astrid E.J. Ogilvie
Ketil Isaksen
et al.