This article is published under a Creative Commons license and not by the author of the article. So if you find any inaccuracies, you can correct them by updating the article.

The sensitivity of diatom taxa from Yakutian lakes (north-eastern Siberia) to electrical conductivity and other environmental variables


Luidmila A. Pestryakova
Ulrike Herzschuh
Ruslan Gorodnichev
Sebastian Wetterich
Published: July 31, 2018
Latest article update: Aug. 7, 2023
This article is published under the license


Abstract
Relative abundances of 157 diatom taxa from Yakutian lake surface-sediments were investigated for their potential to indicate certain environmental conditions. Data from 206 sites from Arctic, sub-Arctic and boreal environments were included. Redundancy analyses were performed to assess the explanatory power of mean July temperature (T July ), conductivity, pH, dissolved silica concentration, phosphate concentration, lake depth and vegetation type on diatom species composition. Boosted regression tree analyses were performed to infer the most relevant environmental variables for abundances of individual taxa and weighted average regression was applied to infer their respective optimum and tolerance. Electrical conductivity was best indicated by diatom taxa. In contrast, only few taxa were indicative of Si and water depth. Few taxa were related to specific pH values. Although T July explained the highest proportion of variance in the diatom spectra and was, after conductivity, the second-most selected splitting variable, we a priori decided not to present indicator taxa because of the poorly understood relationship between diatom occurrences and T July . In total, 92 diatom taxa were reliable indicators of a certain vegetation type or a combination of several types. The high numbers of indicative species for open vegetation sites and for forested sites suggest that the principal turnover is the transition from forest–tundra to northern taiga. Overall, our results reveal that preference ranges of diatom taxa for environmental variables are mostly broad, and the use of indicator taxa for the purposes of environmental reconstruction or environmental monitoring is therefore restricted to marked rather than subtle environmental transitions.
Keywords
Arctic, Temperature, diatom indicator species, pH, dissolved silica concentration
As northern Siberia is an area warming at a comparatively fast rate (Stocker et al. 2013), developing reliable tools that capture lake-system reflections of climate change on millennial to decadal time scales is important. In addition, data from remote sites where continuous monitoring is not feasible helps to decipher recent change. In this context, this study aims to set up a regional indicator-diatom set for selected environmental variables for Yakutia.
Diatoms (Bacillariophyceae) are microscopic, unicellular algae found in almost every aquatic environment, where they play an important role in food webs (Douglas & Smol 1993; Wetzel 2001). In Arctic and sub-Arctic lake waters, where low temperatures and ice cover limit other algae, diatoms often substantially contribute to, or even dominate, primary production (Smol & Douglas 2007). Diatoms are sensitive to various environmental variables, such as nutrient content and salinity (Anderson 2000; Smol et al. 2005). Furthermore, a relationship with vegetation type has been described in several studies (e.g., Weckstrom & Korhola 2001; Ruhland, Priesnitz & Smol 2003; Ruhland, Smol & Pienitz 2003; Herzschuh et al. 2013). Diatoms therefore have a high potential for indicating change in most environments given that regional diatom-environment relationships are known. Such knowledge is mostly based on diatom assemblages obtained from lake surface-sediments in which diatom remains, in contrast to most other algae, are preserved because their silica valves resist decay. While such subfossil data sets exist for parts of the Arctic or Eurasia, the distribution of diatom assemblages and their relationship to environmental characteristics in lakes from Siberia in general and Yakutia in particular has not been extensively explored. The fragmentary information on subfossil Yakutian diatom assemblages has been provided by Komarenko & Vasileva (1975), Laing et al. (1999), Laing & Smol (2000), Pestrjakova (2000, 2004), Pestrjakova & Usnickaja (2000), Pestryakova et al. (2012) and Herzschuh et al. (2013).
Typically, the potential of diatom assemblages to indicate certain environmental conditions is investigated using multivariate statistical methods, while the indicator value of individual taxa is less often examined (Ter Braak & Van Dam 1989; Wunsam et al.
1995; Lotter et al. 1998; Schonfelder 2000; Schonfelder et al. 2002). Furthermore, existing studies only report optima and tolerances for selected environmental variables, while the decisive environmental factor for the distribution of a single taxon is not determined. Gaining such information for Yakutia would allow for a more reliable qualitative and semi-quantitative interpretation of available fossil diatom assemblages and monitoring data without the need for entire taxonomic harmonization, as would be necessary when applying multivariate transfer functions to fossil data.
In particular, this study aims to examine the indicator value of individual species for (1) specific environmental variables and (2) vegetation types (Arctic tundra, forest-tundra, northern taiga, mountain taiga, typical taiga), and (3) to evaluate the use of such information for both past environmental reconstruction and modem environmental assessment purposes.
Study area
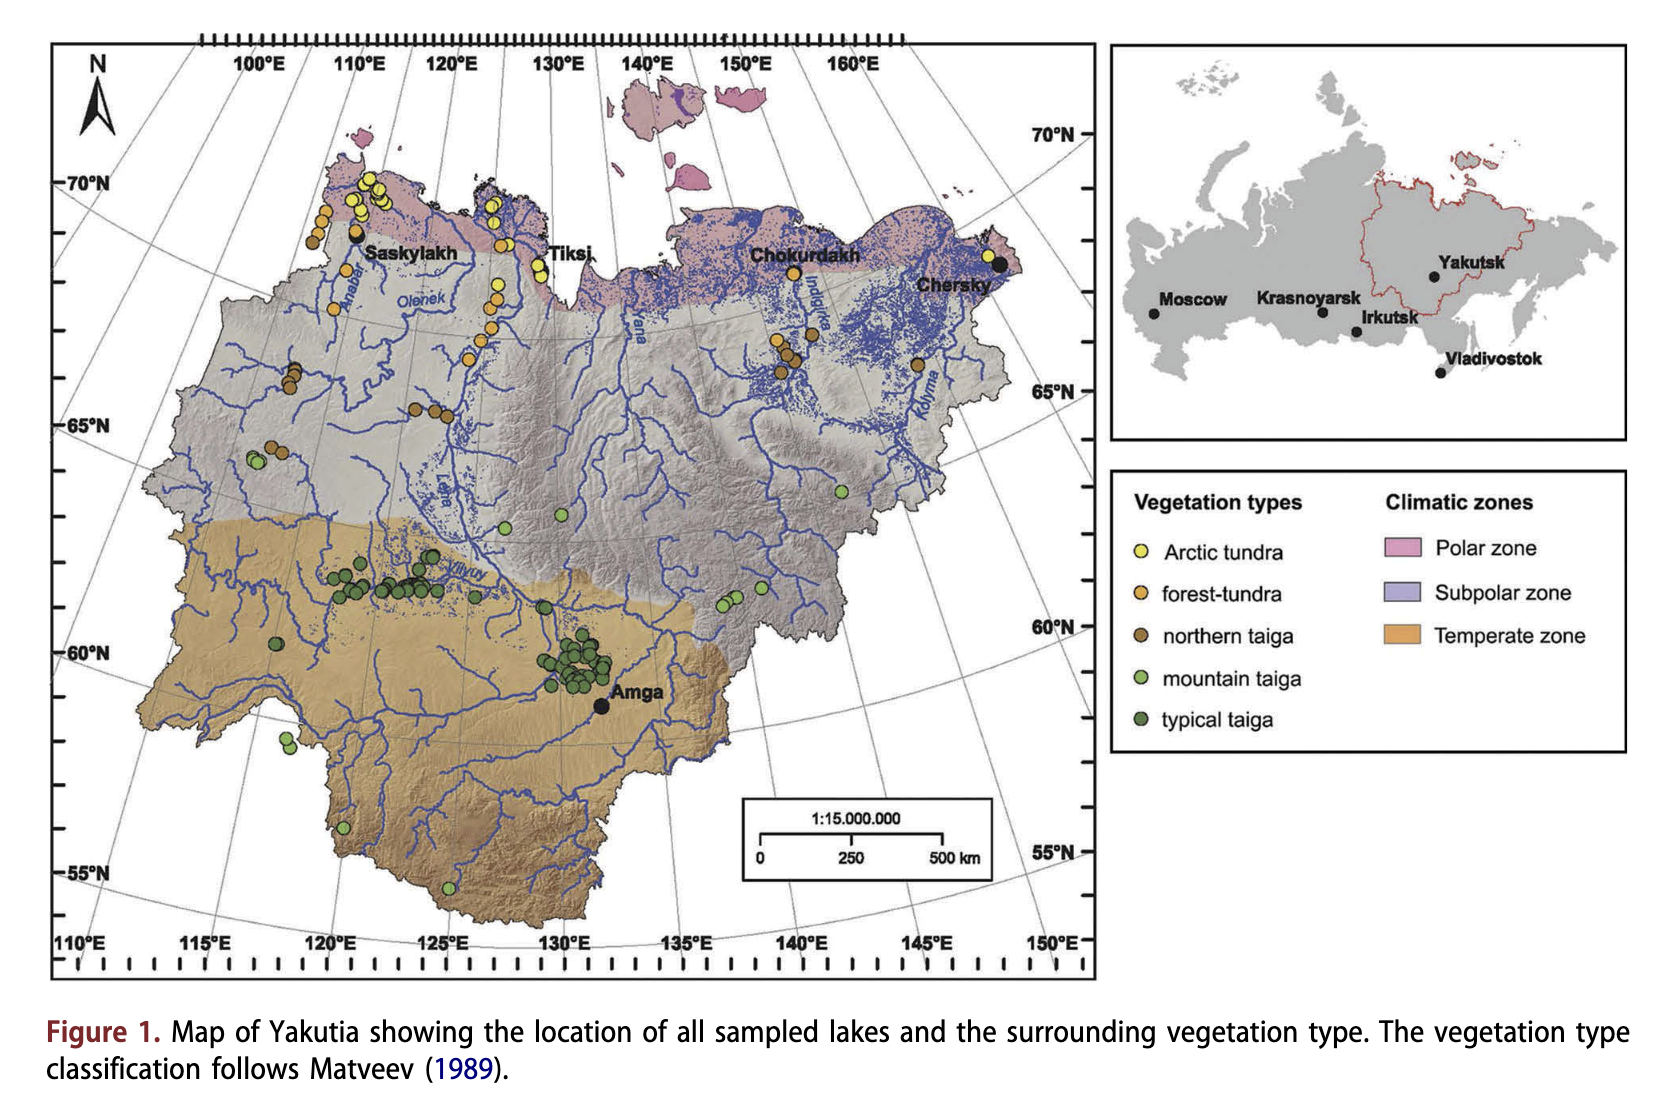
The study sites are scattered across a large area (56.35-72.83°N; 110.2-161.0°E) covering more than 3000 km2 in the Republic of Sakha (Yakutia), in eastern Siberia, Russia (Fig. 1). Around 70% of the Yakutian, territory is covered by mountains and upland areas. Lowland plains are widespread in the northern and central areas. Modern surface morphology of lowland areas was formed during the Quaternary. On account of its aridity, the area was probably never glaciated. Periglacial processes, such as ice-complex formation and thermokarst (Kaplina 2011), were most important for landscape formation. Yakutia is dissected by thousands of rivers (among them the Anabar, Olenek, Vilyuy, Lena, Aldan, Indigirka and Kolyma), mostly originating in the mountains and flowing towards the Arctic Ocean.
Yakutia is spread across three climatic zones: Arctic, sub-Arctic and temperate (Fig. 1). The upland areas of the central Siberian Plateau, the Aldan Mountains and the Verkhoyansk-Kolyma highland act as barriers to the warm westerly, south-westerly and easterly airflows (Vitvickij 1965; Morozova 1966; Matveev 1989). The winter is long and cold whilst summer is short, often hot and quite dry. The mean annual temperature varies from - 8°C in the north to - 16°C in the central areas. Mean annual precipitation ranges from less than 150 mm close to the northern coast to as much as 700 mm in the southern mountainous regions. Mean annual evapotranspiration equates to ca. 250 mm in the south and central areas and up to ca. 100 mm in the north (Kodrau 1981). More than half of the precipitation falls as snow during winter. Almost 95% of Yakutia’s territory consists of permafrost with a maximum depth of 1.5 km in the northern part of the territory (Ersov 1989). The active soil layer thaws to a depth of 0.4 m in the north and to 3.5 m in the south during the summer.
Arctic vegetation dominates about 26% of Yakutia; the other regions are covered by boreal vegetation (Isaev et al. 2010). The forest-tundra border lies along 72°N in the west of Yakutia and gradually descends to 69°N in the east (Isaev et al. 2010). The Arctic tundra is mainly composed of mosses, Carex, Dryas, Cassiope and dwarf Salix and, in its southern part, of shrubby Betula, Alnus and further Ericaceae (Egorova et al. 1991). Trees in the forest-tundra and the northern taiga are Larix gmelinii in the east (to the Lena River) and L. cajanderi in the west. The typical taiga of central Yakutia is mainly composed of L. cajanderi (and, on sandy sites, Pinus sylvestris) and various shrub taxa (Vaccinium vitis- idaea, Arctostaphylos uva-ursi), Forest-steppe occurs at a few dry places in central Yakutia (Skrjabin & Karavaev 1991).
The lowlands of Yakutia are dotted by numerous lakes - there are some 700 000 lakes exceeding 1 ha in size (Mostahov 1974); most of them of permafrost (thermokarst) origin (Katamura et al. 2009). Central Yakutian lakes are usually ice-covered from late October until mid-May, whereas lakes in the north do not become ice-free until late June (Are 1969; Protas’ev 1972). Lake levels rise in spring with snowmelt, reach their maximum in July and are at their lowest from November to April (Are 1969; Gavrilova 1998). Many central Yakutian lakes, in particular those with closed lake basins, have high ion concentrations. Evidence of anthropogenic impacts is mostly small or absent; only hay harvesting occurs in thermokarst basins in some areas of central Yakutia. Lake-water ions originate mainly from precipitation while a small portion originates from leaching of sediments or melt water (Desyatkin et al. 2011). Herzschuh et al. (2013) propose that, compared to
Arctic tundra in the north, the denser forest vegetation and greater evapotranspiration in central Yakutia result in a high soil salt concentration, which snowmelt washes into nearby thermokarst lakes, where the ions become further concentrated by high evaporation during the warm summers. Ion concentrations in Yakutian thermokarst lakes will likely increase as Siberian forests grow in extent and density with Arctic warming (e.g., Zhang et al. 2013). The timing and strength of forest response to climate change, however, is uncertain.
Material and methods
Sampling
We collected surface-sediments from 206 lakes scattered throughout Yakutia in summers between 2001 and 2009 (Fig. 1). The lakes were chosen to cover large gradients in geography, climate, vegetation and lake chemistry. The investigated lakes are generally shallow (median: 2.9 m) and small (median: 0.74 km2), with small catchments. Most of them have been formed by thermokarst processes (Czudek & Demek 1970). Our sample set includes lakes from five vegetation zones (Matveev 1989): 40 lakes are located in the Arctic tundra zone; 21 in the forest-tundra zone; 25 in the northern taiga zone; 16 in mountain taiga; and 104 in the typical taiga zone, among them 15 in Pinus-Larix forests, 13 in Betula-Larix forests and 76 in Larix forests. Lakes located within river valleys surrounded by riverine vegetation were not considered because their diatom assemblages may be subject to regular disturbance by flooding.
Most lakes were reached by public air connections, car, boat and hiking. Only the forest-tundra transects in the western Anabar watershed-Popigai area (35 lakes) and the north-western Lena watershed area (12 lakes) were reached by means of helicopters. Several lakes in central Yakutia are situated in the vicinity of small towns and villages. However, only lakes with minor or no visible
human impact were selected for sampling. After the deepest part of each lake was located using a portable echo sounder, surface-sediments were obtained there with a sediment grab or Uwitec gravity corer (upper ca. 2 cm of sediment) deployed from an inflatable rubber boat.
Environmental data
Limnological parameters (Table 1), such as pH, electrical conductivity (the ability of an electrolyte solution to conduct electricity is mostly directly related to the ion concentration), maximum lake depth and Secchi depth, were measured in the field. Water samples were collected from 0.5 m below the surface of each lake, immediately prior to retrieval of the sediment samples. These water samples were kept cool during the field trip and were prepared and analysed immediately on return from the field. For ion analysis, water was passed through a cellulose-acetate filter (pore size 0.45 pm). Samples for element (cation) analysis were then acidified with HNO3, while samples for anion analysis and residue samples were stored in a cool place. Upon return to the laboratory the cation content of the water was analysed by ICP-OES (Perkin- Elmer Optima 3000 XL), while the anion content was determined by IC (Dionex DX-320). Alkalinity was measured using a Metrohm Basic Titrino 794. The ion balance was calculated for each sample in order to ensure the reliability of the analytical methods, resulting in deviations of less than ±5% for most samples. For this study only the information on Si concentration was finally included. Information on mean TJuiy was taken from New et al. (2002) and interpolated for the geographical position of each lake. An ordination of the lake environmental variables is provided by Herzschuh et al. (2013).
Diatom analysis
Diatom analyses were conducted on about 1 g of sediment. The calcareous and organic components were removed by heating with HC1 (10%) and H2O2 (30%). Cleaned diatom samples were mounted on microscope slides with Naphrax diatom mountant. About 500 diatom valves per slide were counted along random transects. The samples were analysed using a Zeiss microscope equipped with a differential interference contrast at a magnification of 1000 x. The diatom floras used for identification included Krammer & Lange-Bertalot (1986-1991, 2000); Krammer (2000-2003), Lange-Bertalot & Genkal (1999) and Lange-Bertalot (2001). Regional floristic monographs were also consulted (Glezer et al. 1974; Komarenko & Vasileva 1975; Marakova 1988; Moiseeva & Nikolaev 1992; Makarova 2002). Modem diatom distributions of the central Yakutian samples are presented by Pestryakova et al. (2012).
Statistical analyses
Prior to relating environmental variables to the diatom assemblages, the number of environmental variables was reduced. Because of the high correlation between conductivity and Na+, Ca2+, Mg2+, SO42' and СГ (see Supplementary Table SI for cross-correlations), only electrical conductivity was finally used because of its lower susceptibility to measuring error and higher comparability with other studies. Secchi depth was excluded from further analyses because it was greater than the depth of the lake at many sites. Finally, electrical conductivity, pH, dissolved silica concentration, dissolved phosphate concentration, water depth, TJuly and vegetation type were included in further analyses. Environmental variables were log(x +1) transformed (with the exception of pH, TJuiy and vegetation type). Principal component analyses of all non-vege- tation environmental variables and vegetation types were conducted to identify the major structure in the environmental variable data set (Supplementary Fig. SI).
Diatom data are expressed as percentages of all counted valves within one sample. Species were retained for numerical analysis if they occur in at least six lakes with an abundance >0.5%, or if they occur in at least one lake with an abundance >20%. For weighted averaging regression and indicator species analysis, diatom data were Hellinger transformed in order to stabilize the variance and optimize the signal-to-noise ratio in the data. The following statistical approaches were performed. RDAs were performed on the diatom data set involving a single or a certain set of environmental variables as constraints each time. Additionally, par- tial-RDAs were performed with the non-vegetation environmental variable set including one variable at a time and excluding all other non-vegetation environmental variables. Analyses were implemented in the R vegan software package (Oksanen et al. 2014).
BRT analysis was used to model the relationship between individual diatom taxa and environmental variables to infer the most influential environmental variable for each taxon. This method is considered to have superior predictive performance compared to most traditional regression models (Elith et al. 2008). We implemented BRT analysis in R version 2.9.1 (R Core Team 2013), with the gbm software package gbm (Ridgeway 2013) extended by a further function of Elith et al. (2008). We used a default bag fraction of 0.5, a Gaussian error distribution, a very slow learning rate (0.0005) and a tree complexity of 3 to model taxa percentages along environmental gradients. Tests for some taxa showed that increasing tree complexity beyond 3 did not improve model performance, i.e. did not reduce the predicted deviance. We slightly adjusted the specification for those taxa where it was not possible to model the environmental-taxa percentage relationships (details of BRT specification for each taxon is documented in Supplementary Fig. SI).
The WA optima and tolerances (Ter Braak & Looman 1986; Birks et al. 1990) were estimated to summarize the range of variation in the taxon response to the environmental variables using the software program C2 version 1.3 (Juggins 2003).
We a priori defined that reliable indicators are taxa that have a comparatively narrow tolerance range (in our case, a WA tolerance below the 0.33 quantile of all taxa of the respective environmental variable) and are specific to a single environmental variable (i.e., when the % of split in BRT for a single environmental parameter is highest among all environmental variables). We also a priori decided not to extract indicator taxa for TJuly because of the poorly understood relationship between air temperature and diatom occurrences (Catalan et al. 2013).
We assumed that vegetation, in particular forest density, controls the overall lake characteristic rather than a single limnological variable, so we therefore investigated the relationship between diatom taxa and vegetation. Indicator species analysis was applied using the group-equalized indicator value index IndValgind (De Caceres & Legendre 2009) to detect and describe the preference of different diatom taxa for a particular vegetation type (tundra, forest-tundra, northern taiga, typical taiga) or combinations of vegetation types (De Caceres et al. 2010). Vegetation type was inferred from field observations in combination with the vegetation map in Matveev (1989). Statistical significance was determined using a randomization procedure (9999 permutations). A p value of 0.05 or below is assumed to indicate a significant relationship. Lakes surrounded by mountain vegetation (16 sites) were excluded from the analyses as our field observations showed that the composition of this vegetation type was non-uniform. Analyses were implemented using the R package indicspe- cies, version 1.7.0 (De Caceres & Jansen 2013).
Results
Diatom inventory
In total, 607 diatom species (excluding nine subspecies or forms) belonging to 81 genera within Coscinodiscophyceae, Bacillariophyceae and Fragil- ariophyceae were found in the diatom assemblages.
Coscinodiscophyceae included 51 taxa, representing 8.1% of the total number of taxa. Common genera were Aulacoseira and Cyclotella (16 taxa each), Stephanodiscus (seven taxa), Melosira (three taxa), while the remaining genera (64%) included only one or two species. High relative abundance was found for Aulacoseira distans, A. granulata, A. italica, A. lirata, A. perglabra, A. pfaffiana, A. subarctica, Cyclotella mene- ghiniana, C. ocellata, Cyclostephanos dubius and Stephanodiscus hantzschii.
Bacillariophyceae showed the highest diversity, comprising 513 taxa (81.9% of all taxa) in 57 genera. Highest taxa numbers were found in the genera Navicula (63 taxa), Eunotia (45 taxa), Pinnularia (44 taxa), Nitzschia (42 taxa), Achnanthes (32 taxa), Cymbella (30 taxa) and Gomphonema (27 taxa), while 40% of the genera were represented by only one or two species. Most abundant species were Navicula radiosa, N. rhynchocephala, Eunotia bilunaris, E. monodon, E. pectinalis and E. praerupta.
Fragilariophyceae appeared with 62 taxa in 13 genera. The most dominant in the majority of the studied lakes were Staurosira construens, S. venter and Staurosirella pinnata.
Of the 616 taxa, the majority were rare; only 157 taxa fulfilled the criteria for inclusion in the statistical analyses (see species list in Supplementary Tables S2- S5 and species plots in Supplementary Fig. S2). Full names, including authorities, number of occurrences, maximum and average % when present are provided in Supplementary Table S2. Of those taxa selected for further statistical analyses, 42% preferred benthic habitats, 44% were epiphytes and 14% were planktonic forms. Epiphytes dominated not only in the number of taxa but also in the absolute counts in most lakes, independent of vegetation type, water chemical condition and region.
Diatom assemblage in relation to the environmental variables
Results of a principal component analysis of the environmental variables are given in Supplementary Fig. SI. They indicate that TJuiy and vegetation type were highly positively correlated with axis 1, and pH was positively correlated with axis 2. Conductivity showed slight positive correlations with both axes.
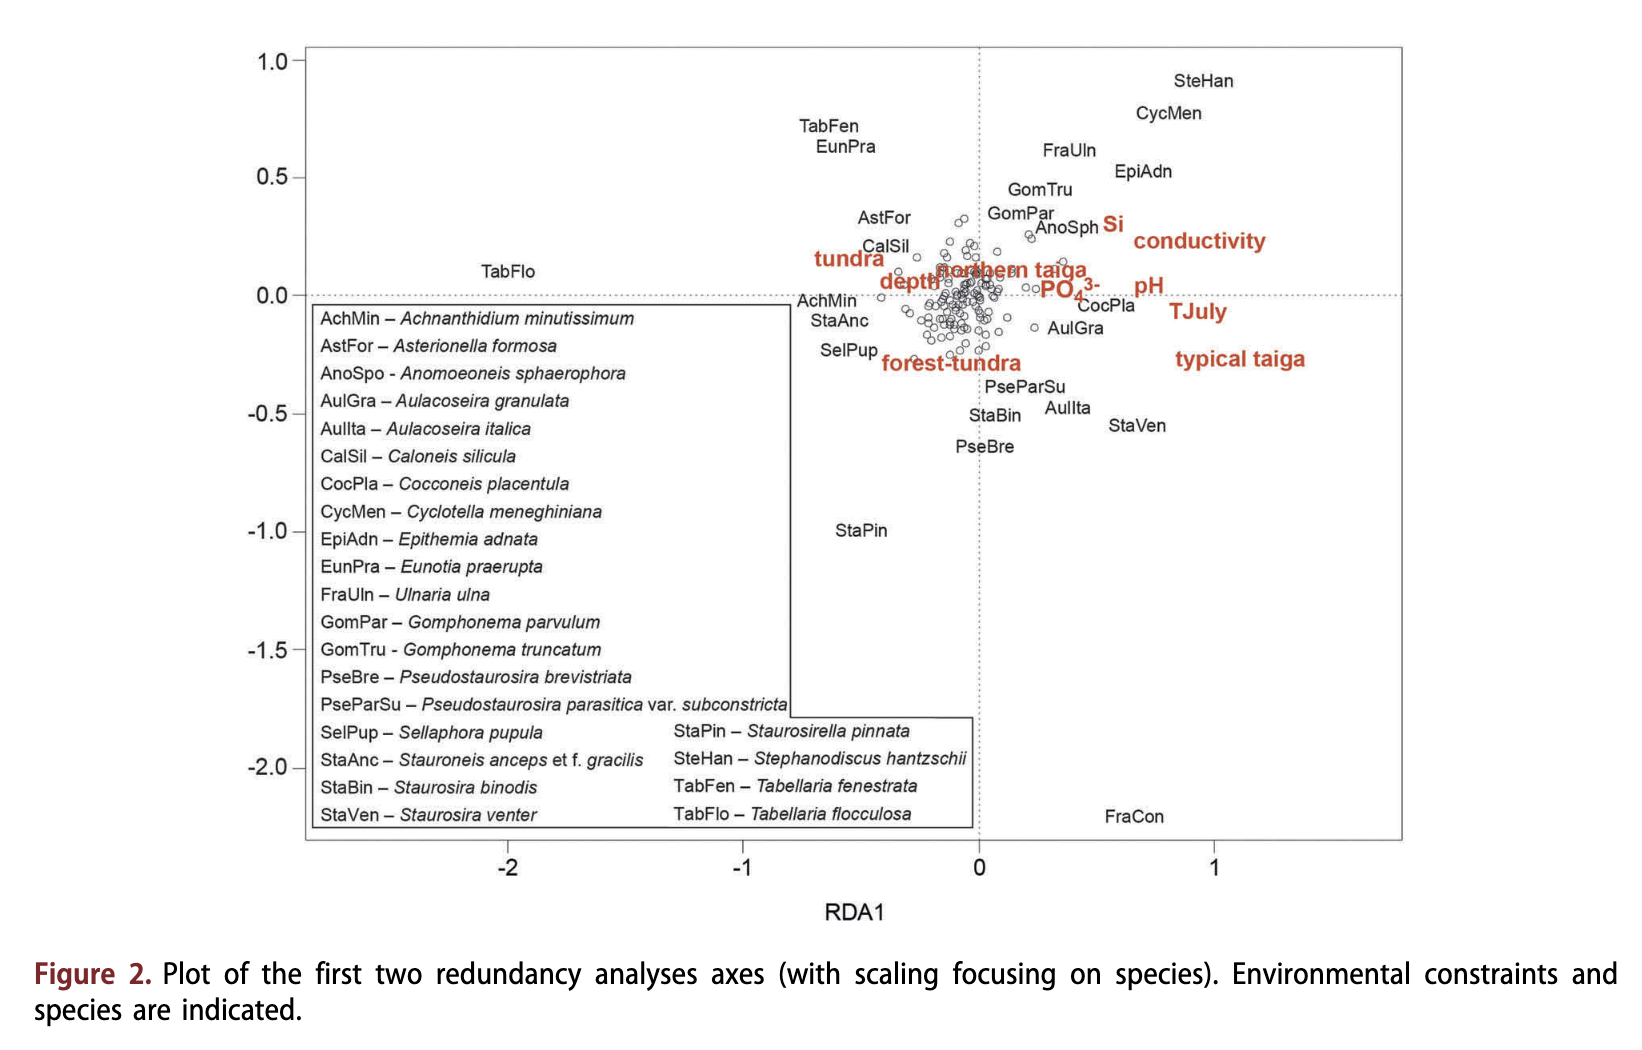
Redundancy analyses of diatom assemblages, including all non-vegetation environmental variables separately, revealed that TJuiy explained the highest amount of variance in the diatom data set (Table 2), followed by electrical conductivity, pH, Si, PO43' and depth. All variables also explained a significant unique portion as revealed by results of the partial RDAs (Table 2). Likewise, vegetation type was significantly correlated with diatom assemblage. However, non-vegetation environmental variables together explained a slightly higher amount of variance (11.4%, p < 0.001) in the diatom data set than vegetation type (10.1%, p < 0.001); combined they explained 14.3% (Fig. 2).
Taxa in relation to the environmental variables
Electrical conductivity
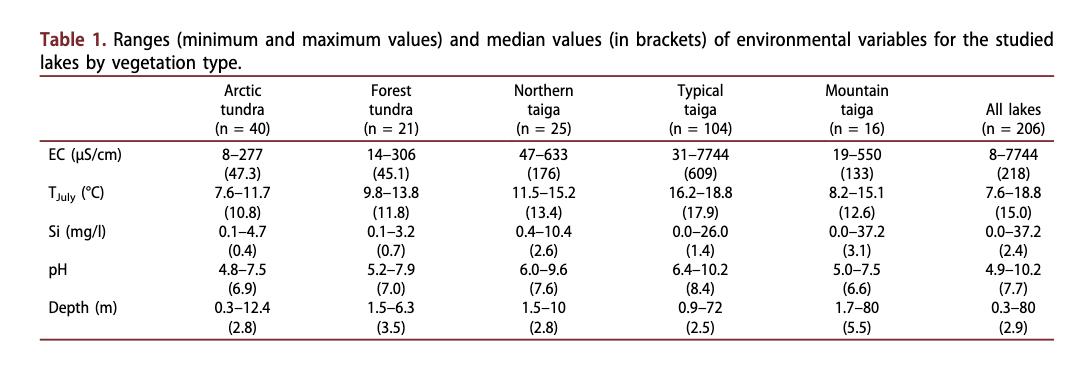
Electrical conductivity of the lake waters ranged from 8 to 7743 pS/cm, corresponding to ion concentrations of roughly 5 to 5000 mg/1 (Table 1). Lakes from tundra and forest-tundra had very low electrical conductivities mostly below 50 pS/cm. Lakes from the northern taiga and mountain lakes had moderately high electrical conductivities (100-400 pS/cm) and lakes from the typical taiga had high electrical conductivities (>400 pS/cm). The highest electrical
Table 2. Results (explained variances, p values) of redundancy analyses of diatom assemblages for each single non- vegetation environmental variable, all non-vegetation environmental variables together, each single vegetation type and all vegetation types together. The uniquely explained variance and p values of partial RDA for all non-vegetation environmental variables are in parentheses.
Variable | Explained variance | p values |
Tjuly | 7.84 (1.63) | <0.001 (<0.001) |
Conductivity | 7.54 (1.09) | <0.001 (<0.001) |
pH | 5.12 (0.53) | <0.001 (<0.001) |
Si | 3.44 (0.41) | <0.001 (<0.01) |
P04 | 1.99 (0.51) | <0.001 (<0.001) |
Depth | 0.6 (0.47) | <0.001 (<0.003) |
All non-vegetation | 11.42 | <0.001 (<0.001) |
variables together |
|
|
Tundra | 3.91 | <0.001 |
Forest-tundra | 1.10 | <0.001 |
Northern taiga | 1.00 | <0.001 |
Typical taiga | 7.76 | <0.001 |
Mountain taiga | 1.16 | <0.001 |
All vegetation types | 10.08 | <0.001 |
together |
|
|
All variables together | 14.27 | <0.001 |
conductivities were recorded in hydrocarbonate-rich alas lakes of the Lena-Amga interfluve.
BRT analysis selected electrical conductivity most often as the major split variable in the 45 taxa, and for 19 taxa electrical conductivity caused >50% of the splits (Supplementary Table S3).
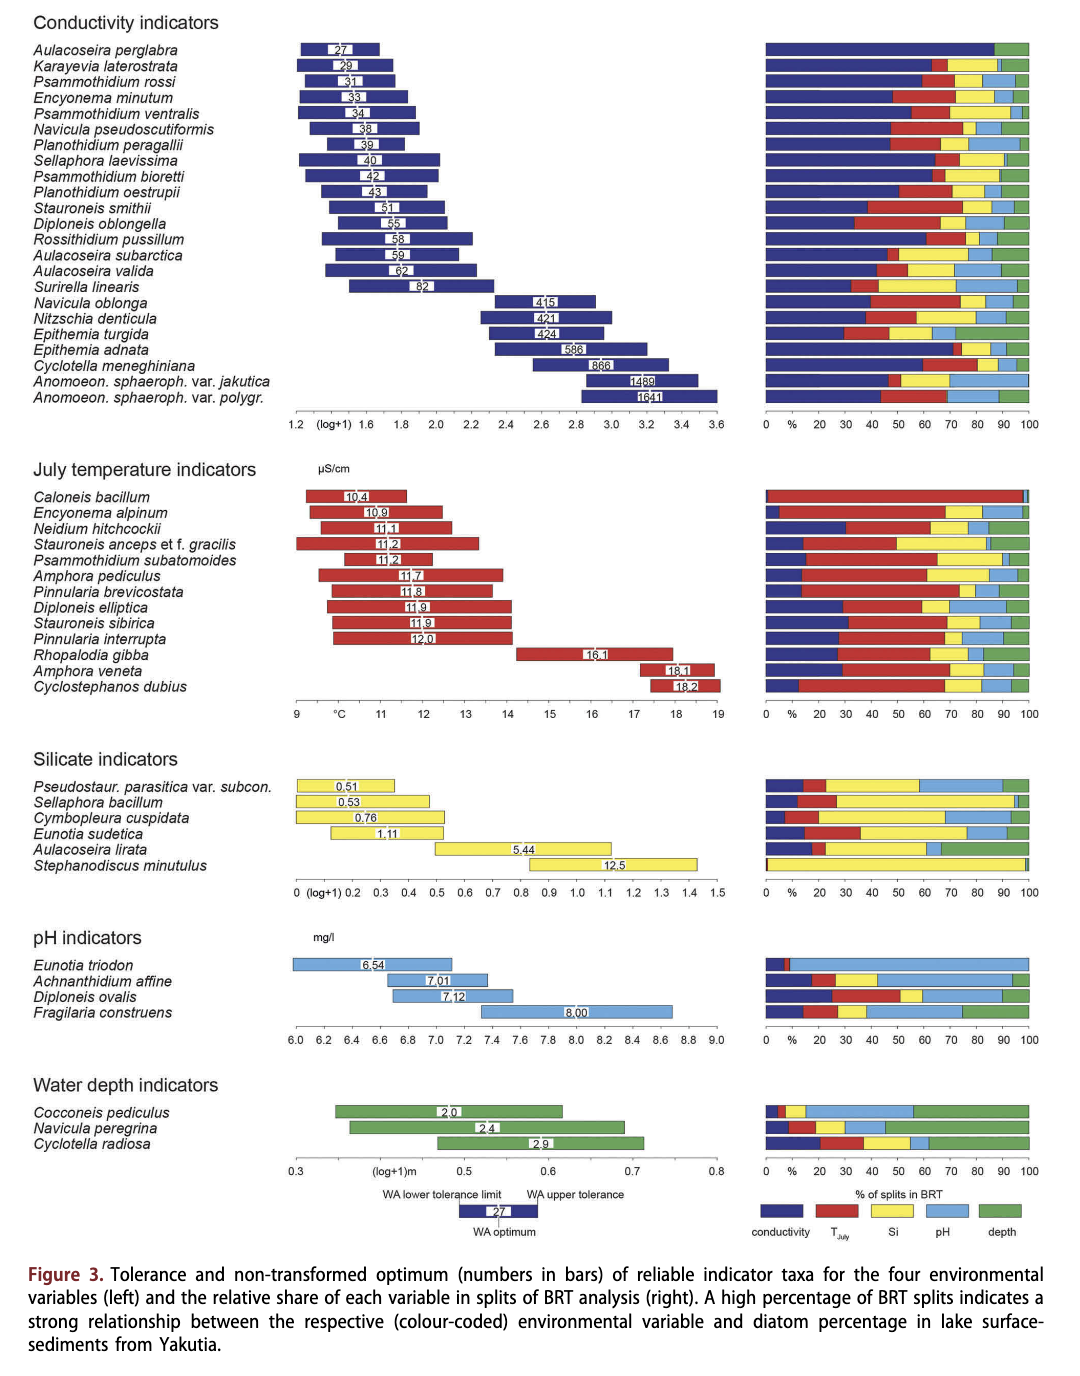
In total, 54 taxa had a low electrical conductivity optimum (<100 pS/cm), particularly species of the genera Achnanthes, Aulacoseira and Cymbella. Most of the taxa with low electrical conductivity optima occurred in relatively few lakes and at low abundance (mostly <2%); among them only Tabellaria flocctdosa was a common, often even dominant, taxon (see optima and tolerances in Supplementary Table S2 and species plots in Supplementary Fig. S2). Reliable indicators (Fig. 3, Table 3, Supplementary Table S2) for low electrical conductivity (according to our definition) are Aulacoseira perglabra (27 pS/cm), Karayevia laterostrata (29 pS/cm), Psammothidium rossi (31 pS/cm), Encyonema minutum (32 pS/cm), Psammothidium ventralis (34 pS/cm), Planothidium peragallii (38pS/cm), Cavinula pseudoscutiformis (38 pS/cm), Sellaphora laevissima (40 pS/cm), Psammothidium bioretti (42 pS/cm), Planothidium oestrupii (43 pS/cm), Aulacoseira subarctica (58 pS/ cm), A. valida (62 pS/cm), Diploneis oblongella (55 pS/cm), Stauroneis smithii (51 pS/cm) and Surirella linearis (82 pS/cm). However, most of them occurred rather seldom and at low abundances.
In total, 90 taxa had an intermediate electrical conductivity optimum (100-500 pS/cm), among them many ‘fragilarioid’ taxa as well as Cymbella, Pinnularia and Navicula. Several taxa with intermediate electrical conductivity optima were very common and often (sub-) dominant, such as Pseudostaurosira brevistriata, Fragilaria capucina, Staurosira con- struens, Staurosirella pinnata, Sellaphora pupula, Stauroneis phoenicenteron, Tabellaria fenestrata, Navicula radiosa and Amphora libyca, but their indicator value is rather low as they have large tolerances and/or BRT analyses did not select electrical conductivity as the major environmental variable for them. Nitzschia denticula is a reliable indicator of intermediate conductivities (421 pS/cm): it was common (occurred in 54 lakes) and relatively abundant (median in lakes where present: 1.5%). Further reliable indicators, but only occurring rarely, are Epithemia turgida (424 pS/cm) and Navicula oblonga (414 pS/cm).
Electrical conductivity optima of >500 pS/cm were inferred for 13 species, among them all taxa that belong to the genera Anomoeoneis, Cocconeis, Stephanodiscus and Epithemia, which may suggest the preference of these genera for high electrical conductivities. Reliable indicators of high conductivities are Epithemia adnata (586 pS/cm), Cyclotella meneghiniana (866 pS/cm), Anomoeoneis
sphaerophora var. jakutica (1489 pS/cm) and Anomoeoneis sphaerophora var. polygramma (1641 pS/cm).
Dissolved silica concentration
Silica concentration in the Yakutian lakes ranged from below the instrumental detection limit to 37.2 mg/1 (median: 2.4 mg/1; Table 1). Highest median concentrations were observed in mountain taiga lakes, while concentrations were mostly low in tundra lakes. Dissolved silica concentration was the major split variable for only 17 taxa. Pseudostaurosira parasitica var. subconstricta (optimum: 0.5 mg/1), Sellaphora bacillum (0.5 mg/1), Cymbopleura cuspidata (0.8 mg/1), Eunotia sudetica (1.1 mg/1), Aulacoseira lirata (5.4 mg/1) and Stephanodiscus minutulus (12.5 mg/1) are reliable dissolved silica concentration indicators.
pH
pH across all our Yakutian Lakes ranged from 4.9 to 10.2 (Table 1). Only 10.7% of the lakes were acidic (pH <6.6) and most of them were located in the tundra, foresttundra and mountains, while lakes in the north and with typical taiga covered a wider pH range. Highest pH values were found in alas lakes of the Lena-Amga interfluve. In comparison to electrical conductivity, pH was less frequently selected as the major splitting variable in BRT (SOM 3). No taxon had an optimum below pH 6.5. Only Achnanthidium affine (pH optimum 7.0), Diploneis ovalis (7.1), Eunotia triodon (6.5) and Staurosira construens (8.0) are identified as reliable pH indicators.
Water depth
The water depth varied from 0.3 to 80 m (median: 2.9 m). Most of the central Yakutian lakes were shallow thermokarst lakes, while the deep lakes sampled were only found in the mountains. Within the data set only three species are reliable indicators of water depth: Cyclotella radiosa (optimum 2.9 m), the epiphytic Cocconeis pediculus (2.0 m) and Navicula peregrina (2.4 m). Furthermore, even though Cavinula cocconeiformis had a high tolerance relative to other taxa (0.35 (log+1) m), it can be accepted as a reliable indicator (88% of splits in BRT) because of its large optimum of 6.2 m and the low number of lakes sampled within this depth range.
Mean July temperature
The range of mean TJuiy covered by this data set spanned 7.6 to 18.8°C (Table 1). Almost all Arctic tundra lakes lay between 10.1 and 12°C. In comparison to the Arctic zone, lakes of the forest-tundra, the northern taiga and the mountain zone had a much broader TJuly range. TJuly for most of the typical taiga lakes was above 17°C.
Tjuly was selected as the major or second major split variable in the BRT analysis for 35 taxa, but for only eight of these did it cause >50% of the splits. Those of the 35 taxa that occurred predominantly at lower temperatures, as indicated by low optima, such as Caloneis bacillum, Encyonema alpinum, Neidium hitchcockii, Stauroneis anceps var. sibirica, Psammothidium subatomoides, Amphora pediculus, Pinnularia brevicostata, Diploneis elliptica, Pinnularia interrupta and Stauroneis anceps forma gracilis also had low conductivity optima.
Likewise, all 53 taxa that occurred predominantly in lakes with high T]U|y, as indicated by their TJuiy optimum >15°C, had high conductivity optima as well and, for most of these species, conductivity accounted for the majority of splits in BRT. Among them are all species of the genera Amphora and Anomoeoneis and such common and abundant taxa as Staurosira construens, S. venter, Cocconeis placen- tula, Epithemia adnata, Ulnaria ulna, Navicula radiosa and Stephanodiscus hantzschii.
The 50 taxa with inferred intermediate TJuiy optima (13-15°C) belong to a large variety of genera and had large tolerances (median: 3.25°C), showing no clear relationship with TJuiy.
Taxa in relation to vegetation type
Out of the 92 taxa selected as indicator taxa (Table 2), only three and eight are selected to indicate tundra and forest-tundra, respectively. In contrast, 25 taxa are selected to indicate a combination of both vegetation types, among them seven ‘achnanthoid’ species. However, individual indicator taxa always occurred at low abundance, rarely exceeding 5%. Nevertheless, the indicator value of these taxa for open vegetation types is very high as almost all of these taxa are completely absent from forested sites. Similarly, 29 taxa are indicators of typical taiga lakes. In contrast, taxa that were affiliated with northern taiga or combinations of vegetation types tend to be generalists in terms of their occurrence and their indicator value reflects differing abundances in the separate vegetation types or type combinations. While Tabellaria flocculosa, the most abundant taxon in the northern vegetation zones, is selected as an indicator of a combination of tundra, forest-tundra and northern taiga, the most abundant taxa of northern forest lakes (Staurosirella pinnata) and typical taiga lakes (Staurosira construens, S. venter) are not selected as indicators as they occurred in other vegetation types at high abundances as well.
Discussion
Indicator value of diatom taxa for single environmental variables
Electrical conductivity
The frequent selection of electrical conductivity as an influential environmental variable for individual diatoms in the BRT analysis supports the findings of previous studies, particularly from arid regions, where electrical conductivity or salinity has been found to best explain modern diatom distribution (Reed 1998; Shinneman et al. 2009; Pestryakova et al. 2012; Reed et al. 2012).
Because of the significant relationship between electrical conductivity and diatom assemblages and the prevalent unimodal diatom-environment relationships, as revealed by the local regression (LOESS) smoother in the abundance plots (Supplementary Fig. S2), we feel confident in estimating the electrical conductivity optima and tolerances with weighted averaging regression.
Almost all species in our data set are classified as oligohalobous according to the system of salinity indicators of Kolbe (1927). Many species with low electrical conductivity optima are classified as halo- phobous or indifferent to salinity under the systems of Kolbe (1927), Hustedt (1957) and others (Ehrlich 1995; Stoermer & Smol 1999). Furthermore, species commonly classified as halophilous or mesohalobous in these studies show relatively high electrical conductivity optima in our Yakutian data set.
Komarenko & Vasileva (1975) provide electrical conductivity occurrence limits for diatoms from Yakutia which match reasonably well with our results. For example, among those species in their data set for which we estimated electrical conductivity optima, Ulnaria ulna var. danica had the highest upper and lower limit (867-1874 pS/cm). This fits well with our results where this species has the highest electrical conductivity optimum (3000 pS/cm) of all species and electrical conductivity is most often selected as the split variable in BRT analyses. However, because of its relatively large tolerance it has not been selected as a ‘reliable’ indicator.
In general, the order of species’ electrical conductivity optima found in our data set is similar to those from other data sets, although for those 16 taxa shown to be reliable indicators of low electrical conductivity (<100 pS/cm) no comparative values are available. Tabellaria flocculosa, with a low optimum in our data set (but a rather large tolerance), has already been described with an optimum and tolerance similar to our results (Wilson et al. 1994; Potapova & Charles 2003).
The values of a number of species with published intermediate electrical conductivity optima are mostly close to our values (e.g., electrical conductivity WA optima of Amphora libyca: ca. 304 pS/cm in our study in Yakutia; ca. 523 pS/cm on the Tibetan Plateau (Yang et al. 2003); 1738 pS/cm in Mongolia (Shinneman et al. 2009); and 416 pS/cm in US rivers (Potapova & Charles 2003). However, the optima of some taxa differ from the other data sets, which also show inconsistencies. For example, Hippodonta capitata has an optimum of 329 pS/cm in the Yakutian data set, but occurred mostly at higher conductivities in Turkish (optimum: 1170 pS/cm) and Mongolian lakes (optimum: 1930 pS/cm) (Supplementary Table S6).
Species with high electrical conductivity optima, such Anomoeoneis sphaerophora, Epithemia adnate and Cyclotella meneghiniana, have also been found to be indicative of high electrical conductivity (or salinities) in lakes from the Tibetan Plateau (Yang et al. 2003), Spain (Reed 1998), British Columbia (Wilson et al. 1994), central Mexico (Davies et al. 2002), the south Bolivian Altiplano (Sylvestre et al. 2001), Mongolia (Shinneman et al. 2009) and Turkey (Reed et al. 2012). However, the absolute values for electrical conductivity optima vary strongly between the data sets. Anomoeoneis sphaerophora for example, has a conductivity optimum of 1209 pS/cm in our data set, but ca. 5672 pS/cm in Tibetan Plateau lakes (Yang et al. 2003), ca. 3.57g/l in British Columbia (Wilson et al. 1994) and 12 600 pS/ cm in saline lakes in Turkey (Reed et al. 2012).
Generally, our upper-end conductivity optima are somewhat lower than those reported from the Tibetan Plateau (Yang et al. 2003), British Columbia (Wilson et al. 1994), and the southern Bolivian Altiplano (Sylvestre et al. 2001). This underestimation may be caused by the relatively low number of lakes with conductivities >3 000 pS/cm and by the relatively low maximum conductivity in our data set. On a logarithmic scale, tolerance only varies slightly between taxa with low, intermediate and high optima, but it implies that taxa with higher optima also have a higher absolute tolerance. This phenomenon has also been reported from other studies and might reflect the increased euryhalinity of saline lake diatoms, which are able to withstand major fluctuations in salinity (Gasse et al. 1987).
As has been mentioned by other authors, the assigned optimum and tolerance should not be taken as physiological limits of diatom growth (Weckstrom & Korhola 2001). Furthermore, ion composition may be a more crucial determining factor for individual taxa than total ion concentration (as represented by electrical conductivity). Therefore, a good conductivity indicator taxon in one region may not be so reliable elsewhere when the ion composition differs between the investigated lakes.
pH
pH is assumed to be one of the limiting factors for the occurrence of diatoms. The strong relationship between modern diatom assemblages and pH regime has previously been shown (e.g., Renberg & Hultberg 1992). In our data set there is only a small number of taxa where pH has the highest % in BRT analyses, which suggests that, compared to electrical conductivity, pH is of minor importance for diatom distributions in Yakutia, even though a comparatively large pH range was sampled.
According to Komarenko and Vasileva (1975) and Vasileva (1989) most of the taxa are alkaliphilous. The pH optima of the 157 investigated taxa of the Yakutian data set range from pH 6.5 (Fragilaria con- stricta) up to 9.2 (Ulnaria ulna var. danica). Remarkably, more than half of the 37 species that occur in both the Fennoscandian and the Yakutian data sets have rather similar optimum values despite the rather large tolerances estimated for the Yakutian data set. In particular, a broad pH tolerance is characteristic of the epiphytic alkaliphilic species Pseudostaurosira brevistriata (pH tolerance: 4.8), Staurosirella pinnata (pH tolerance: 4.8) and Staurosira venter (pH tolerance: 4.1). Finally, only four taxa have been selected as reliable indicators. Among them the Arcto-alpine taxon Eunotia triodon (pH optimum: 6.6) that reaches high percentages (up to 15%) in Yakutian mountain lakes. In a study of Fennoscandian sub-Arctic lakes (Weckstrom et al. 1997), Eunotia triodon is interpreted as a typical species of acidic conditions with a similar pH optimum of 6.3.
Dissolved silica concentration
Studies show that diatoms absorb considerable quantities of silica (Lund 1950; Wang & Evans 1969). A diatom’s need for silica depends on its habitat and the physiological condition of its cells (Round et al. 1990). The estimated WA optima of different silici- philic diatoms vary considerably between 0.51 and 12.78 mg/1. Even though planktonic species with frail valves need less silica compared to benthic species with thicker valves, our investigation revealed that the planktonic species Stephanodiscus minutulus has a relatively high Si optimum at 12.5 mg/1. Aulacoseira lirata is a planktonic taxon as well, but its thick valve explains the high dissolved silica concentration optimum of 5.4 mg/1 that we obtained. Ruhland, Smol & Pienitz (2003) likewise found that Aulacoseira lirata prefers silica-rich lakes in forested areas and rarely occurs in shallow tundra lakes. Monitoring studies on seasonal lake nutrient concentration changes from Yakutia are not available, but concentrations of dissolved silica are highest during snowmelt in March and April and decline markedly during the early summer in Kamchatka (Veksler et al. 2008). The major blooming period of planktonic diatoms in central Yakutia is end of May to mid-June (Vasileva 1989). It can be assumed that the dissolved silica concentration is probably low in Yakutian lakes during that period. Herzschuh et al. (2010) have shown that mass expansion of Stuckenia pectinata in mid-summer leads to a pronounced hydrogen carbonate and nitrogen depletion in central Yakutian lakes, which probably inhibits the growth of diatoms and accounts for the clear waters observed. Dissolved silica concentration in mid-summer is therefore relatively high in such lakes, making them good habitats for Aulacoseira lirata and Stephanodiscus minutulus, known to prefer oligotrophic or mesotrophic conditions.
Depth
Quantitative relationships between diatoms and water depth have been revealed in other studies (Barinova 2000) and the ratio of benthic to planktonic taxa is often used as a semi-quantitative indicator of waterdepth changes in palaeolimnology. However, as with air temperature, water depth is only a surrogate for various other environmental variables that change with depth such as light penetration and mixing- related nutrient recycling. Only three species have been identified as depth indicators. Cyclotella radiosa, the only planktonic species among them, has the deepest depth optimum. None of the three species have previously published optima and tolerances. Generally, our depth optima are small in comparison to studies where more lakes with greater depths are included. For example, a study from subtropical China (Wang et al. 2012) estimates optima almost exclusively >10 m for 32 shared taxa whilst we infer optima of <10 m. A study from Sand Hills, Nebraska, USA (Shinneman et al. 2010), where lakes with a depth spectrum similar to lakes in our study were sampled, likewise infers small depth optima for those taxa present in both studies. Accordingly we assume that our sampling design is not suitable for reliably identifying lake-depth indicators.
Mean TJuiy
Several studies show that the diatom composition of lake surface-sediments varies significantly with air temperature and diatom-air temperature transfer functions have been developed based on such data sets (Rosen et al. 2000; Bigler & Hall 2002).
In our study, TJuly is the second most important decisive variable in BRT species environmental modelling. Most diatom taxa have optima between 11 and 17°C and have comparatively wide tolerances of several degrees (median: 2.7°C). Compared to other data sets, our data set covers a relatively large TJuiy gradient (7.6-18.8°C), although the lakes are not evenly distributed across this range. Only a few samples come from sites with TJuiy below 12°C whilst the >16°C TJuiy range is over-represented.
Weckstrom et al. (1997) calculated temperature optima for 136 diatom taxa in sub-Arctic Fennoscandian lakes, but only 37 of them also occur in the Yakutian data-set. The relative distributions of these diatom taxa along the temperature gradient are, with few exceptions, similar. Large differences in the optima are observed for some taxa. Examples of warm-water preferring taxa in our data set include Aulacoseira lirata, with an optimum of 16.9°C in Yakutia against 11°C in Fennoscandia, Aulacoseira italica, with optima of 16.3°C and 12.5°C, respectively, and Staurosira construens, with optima of 16.2°C and 12.1 °C, respectively. However, they all have rather large tolerances.
Rosen et al. (2000) estimate temperature optima for 48 diatom species using a data set from northern Sweden, where 10 species are in common with the Yakutian data. Generally, the estimated range of TJuiy optima of these taxa is higher in the Yakutian data set (11.2-15.8°C) than in the northern Sweden data set (7.5-13°C); this also applies to the tolerance for 60% of the species. Forty-nine Yakutian species have been investigated for their TJuly preference in the Yukon and the Canadian Arctic (Pienitz et al. 1995). Similar Tjuly optima could be found for Cocconeis placentula (16.5°C) and Epithemia adnata (16.9°C). All other common species have lower TJuiy-optima in Yakutia than in the Yukon and Canadian Arctic data set.
For Staurosira construens forma venter a TJuiy optimum of approximately 11 °C has been reported in studies conducted in northern Scandinavia (Rosen et al. 2000; Weckstrom & Korhola 2001) whilst our data set yields an estimated optimum of 16.7°C for this taxon. This species occurs at high abundance in all regions but is especially dominant in the thermokarst lakes of central Yakutia, as has been described in earlier studies (Pestrjakova 2005, 2010; Pestrjakova et al. 2004; Pestrjakova et al. 2007; Pestryakova et al. 2012).
The comparison of our results with other studies reveals that some systematic shifts are inferred for Tjuiy optima. We assume that this is most probably related to the indirect nature of the relationship between temperature and diatom composition (Weckstrom et al. 1997; Anderson 2000; Smol et al. 2005). It is thought that temperature-related variables such as ice-cover duration and related lake stratification and summer heat content actually influence the diatom assemblage (e.g., Catalan et al. 2013). As all data sets originate from different geographic settings - for example, maritime versus continental, mountain lakes versus thermokarst lakes - it is likely that the relationship between TJuiy and the decisive ‘warmth’ variable systematically differs. Therefore, inferring TJuiy preference ranges and optima with the purpose of extracting indicator taxa would be misleading.
Indicator value of diatom taxa for vegetation type
Indicator species analyses suggest a high number of diatom taxa can be indicative of vegetation type (Table 3, Supplementary Table S2). This result confirms previous studies from other high-latitude areas where ordination of diatom data has been used to distinguish vegetation types or ecoregions. Several treeline studies (e.g., Pienitz et al. 1995; Laing & Smol 2000; Weckstrom & Korhola 2001; Fallu et al. 2002) indicate that diatom assemblages from tundra sites are different from those of forested sites. However, the high number of indicator species that are characteristic of open vegetation sites (tundra and/or forest-tundra) and the high number of species that are indicative of a combination of all forest types suggest that the principal turnover does not occur at the northern treeline (i.e., the transition from tundra to foresttundra) but farther south (i.e., at the transition from forest-tundra to northern taiga), where forests become more dense and Larix trees reach a height of about 10 m. Ruhland and co-workers also find that in Canada the transition from foresttundra to northern taiga is most relevant for diatom composition (Ruhland, Priesnitz & Smol 2003; Ruhland, Smol & Pienitz 2003) and a study of Heegaard et al. (2006) indicates that turnover in mountain environments is greatest several hundred metres below the treeline. This might indicate that trees only above a certain density threshold affect lake-water chemistry. Weckstrom & Korhola (2001) infer highest diatom diversity in the transition zone between tundra and forest in Arctic Lapland, which indicates that the distribution range of many species ends here, as is also seen in our data set. This finding supports the concept of ‘aquatic ecotones’ (De Deckker & Forester 1988) that correspond to the terrestrial treeline ecotones (Antoniades et al. 2014). Nevertheless, not all diatom species are affected in a similar way, supporting the inferences of Heegaard et al. (2006) that ‘aquatic ecotones’ are not consistent for different taxa, as is found with the species in our analyses and aquatic groups in general (diatoms, chironomids, cladocera) in their analyses.
A unique feature of the diatom flora of northern Siberia is the steady high abundance of Tabellaria taxa (T. flocculosa, T. fenestra) in tundra and foresttundra environments, as noted by Laing & Smol (2000). In contrast, studies from North America, where Tabellaria flocculosa also occurs, record much lower abundances of this taxon, probably as a result of on average deeper lakes. In comparison to the treeline transect studied by Ruhland and co-workers in western Canada (Ruhland, Priesnitz & Smol 2003; Ruhland, Smol & Pienitz 2003), northern lakes in Yakutia are characterized by higher diversity and greater abundance of the genera Cymbella, Achnanthes, Eunotia and Pinnularia. In terms of species composition, the most striking difference to other data sets is the high abundance of small
Fragilariaceae (e.g., Staurosira venter, Staurosirella pinnata) that sum up to >40% in most sites outside the tundra region. In studies from North America, these taxa are generally less abundant and do not show such a pronounced preference for forested habitats (Ruhland, Priesnitz & Smol 2003; Ruhland, Smol & Pienitz 2003). This may be because small Fragilariaceae taxa prefer neutral to alkaline lakes of unstable environmental conditions such as are caused by annual freezing to the bottom or by flooding. Such environmental characteristics are common in permafrost-affected taiga lakes in central Yakutia but are rarely found in North America where continuous permafrost rarely extends south of the treeline.
Using indicator taxa for environmental reconstructions and assessment
Diatom analysis is widely used on Yakutian lake sediments to reconstruct the postglacial evolution of individual lake ecosystems or millennial-scale regional climate change (Laing & Smol 2000; Pestrjakova 1998, 2000; Pestrjakova & Usnickaja 2000; Pestrjakova et al. 2008; Biskaborn et al. 2012; Palagushkina et al. 2012; Biskaborn et al. 2013). Environmental interpretation has usually been based on diatom optima and tolerances from studies outside Siberia, where not only the combination of environmental variables but also the diatom assemblages differ. The abundance of a diatom taxon in a Yakutian record may, therefore, represent the realization of a considerably different abiotic and biotic niche than that from outside Yakutia. Such regional shifts in the optima of taxa have been demonstrated in a comparison using regional chironomid data sets (Self et al. 2011). For many diatom taxa, environmental preferences are reported for the first time in this study and the assessment here of their indicator value will enable a more reliable reconstruction of particular environmental conditions in the past.
The application of indicator values has the advantage that no taxonomic harmonization of the entire assemblage is necessary. Additionally, it requires no knowledge of environmental statistics as semi-quan- titative inferences about past environmental conditions are not extracted, unlike for diatom-based transfer functions (e.g., Pestryakova et al. 2012; Herzschuh et al. 2013).
As with the application of transfer functions, using environmental indicators has the problem that the selected environmental factors represent surrogates of the true limiting factor for diatom growth. An indicator species approach therefore necessitates comparison with other environmental indicators such as may be obtained by a multi-proxy study. Modern data sets of chironomids (Nazarova et al. 2008; Nazarova et al. 2011), pollen (Klemm et al. 2013), ostracods (Wetterich, Herzschuh et al. 2008; Wetterich, Schirrmeister et al. 2008) and cladocera (Frolova et al. 2013) are available for Yakutia, most of them based on the same sample material, so semi- quantitative information similar to those from diatom indicators could potentially be inferred. For lakewater conductivity in particular, a diatom-based reconstruction may be the most reliable proxy.
The diatom assemblages of surface-sediment samples represent an integration of the average growing conditions within a lake over a certain period of time (approximately 5-10 years depending on sedimentation rate) and across the various habitats within a lake and therefore provide a more general picture about the lake’s ecological condition than a single water sample, for example, or a watercolumn diatom sample. Diatom assemblages from lake sediments have therefore been used, and continue to be used, to document the ecological conditions of remote lakes in Yakutia (Pestrjakova 2000, 2004). Knowledge about diatom indicators can thus help to track ongoing lake transformations that occur as a result of local human impact, such as the intensification of agriculture (Sawinov et al. 2005) and deforestation (Timofeev 2003), or as a result of regional climate change. For example, the habitat quality of remote lakes depends strongly on the quality of nearby water resources. The identification of those sites where critical thresholds with respect to their freshwater source may be exceeded in the near future and where frequent monitoring will be necessary can be based on the appearance and abundance of diatom indicators, as proposed by this study.
Conclusions
Relating diatom abundances from lake surface-sediments in Yakutia to five selected environmental variables reveals many indicator taxa for extremes in conductivity, mean July temperature and vegetation, but only a few diatom taxa are indicative of the intermediate range of the investigated environmental variables. To strengthen the reliability of diatom indicators as tools for assessing past and present environmental conditions, future studies should investigate interactions between environmental variables on species’ preferences.
Acknowledgements
We thank our colleagues who helped make our 2001-09 field campaigns successful: S. Muller, B. Biskaborn, J. Klemm, T. Кишке, К. Stachura-Suchoples, M. Ksenofontova, M. Daibanyrova, M. Gerasimova, L. Ushnickaya, I. Sobakina and D. Subetto. We are indebted to colleagues who contributed to the realization of this
research: A.N. Alekseev, P.A. Gogoleva, V.I.Arkhipov, H.- W. Hubberten, B. Diekmann, C. Siegert, W. Schneider and G. Miiller. We are also very grateful to A. Eulenburg and U. Bastian for their support of our analytical work and to T. Bohmer for help implementing BRT and drawing the figures. We thank two anonymous reviewers for their valuable comments. We thank Cathy Jenks for English editing.
Disclosure statement
No potential conflict of interest was reported by the authors.
Funding
This research was performed within the joint Russian- German Arctic Ecological Network, supported by the Federal Ministry of Education and Research (BMBF grant no. 5.2711), the Russian Foundation for Basic Research (RFBR grant no. 13-05-00327), the program of Integrated Research in the Republic of Sakha (Yakutia) aimed at developing its productive forces and social sphere in 2016-2020, and the Project of the North-Eastern Federal University (Regulation SMK-P-1/2-242-17 ver. 2.0, order no. 494-OD) and was conducted in the framework of research activities defined by the Russian Ministry of Education and Science (grant no 5.2711.2017/4.6).
References
- Anderson N.J. 2000. Diatoms, temperature and climatic change. European Journal of Phycology 35, 307-314.
- Antoniades D., Douglas M.S.V., Michelutti N. & Smol J.P. 2014. Determining diatom ecotones and their relationship to terrestrial ecoregion designations in the Central Canadian Arctic Islands. Journal of Phycology 50,610-623.
- Are F.E. 1969. О sovremenom vysyhanii ozer Central’noj Jakutii. (Modem dryout of Central Yakutian lakes.) Voprosy Geografii Jakutii 5, 78-87.
- Barinova S.S. 2000. Metodiceskie aspekty analiza biologiceskogo raznoobrazija vodoroslej. (Methodical aspects of analysis of biological diversity of algae.) In S. Barinova et al. (eds.): Vodorosli-indikatory v ocenke kacestva okruiajuscej sredy. (Algae as indicators of environmental quality.) Pp. 4-59. Moscow: All-Russian Institute for Nature Conservation and Reserves.
- Bigler C. & Hall R.I. 2002. Diatoms as indicators of climatic and limnological change in Swedish Lapland: a 100-lake calibration set and its validation for paleoecological reconstructions. Journal of Paleolimnology 27, 97-115.
- Birks HJ.B., Juggins S., Line J.M., Stevenson A.C. & ter Braak CJ.F. 1990. Diatoms and pH reconstruction. In R. W. Battarbee et al. (eds.) Philosophical Transactions of the Royal Society of London В 327, 263-278. London: Royal Society.
- Biskaborn B.K., Herzschuh U., Bolshiyanov D., Savelieva L.
- & Diekmann B. 2012. Environmental variability in northeastern Siberia during the last ~ 13300 years inferred from lake diatoms and sediment-geochemical parameters. Palaeogeography, Palaeoclimatology, Palaeoecology 329/330, 22-36.
- Biskaborn B.K., Herzschuh U., Bolshiyanov D.Y., Schwambom G. & Diekmann B. 2013. Thermokarst processes and depositional events in a tundra lake, northeastern Siberia. Permafrost and Periglacial Processes 24, 160-174.
- Catalan J., Pla-Rabes S., Wolfe A.P., Smol J.P., Ruhland K. M., Anderson NJ., KopacEk J., Stuchlik E., Schmidt R., Koinig K.A., Camarero L., Flower RJ., Heiri O., Kamenik C., Leavitt P.R., Psenner R. & Renberg I. 2013. Global change revealed by palaeolimnological records from remote lakes: a review. Journal of Paleolimnology 49, 513-535.
- Czudek T. & Demek J. 1970. Thermokarst in Siberia and its influence on the development of lowland relief. Quaternary Research 1, 103-120.
- Davies SJ., Metcalfe S.E., Caballero M.E. & Juggins S. 2002. Developing diatom-based transfer functions for central Mexican lakes. Hydrobiologia 467, 199-213.
- De Caceres M. & Jansen F. 2013. R package: indicspecies: studying the statistical relationship between species and groups of sites, http://cran.r-project.org/web/packages/indicspecies/index.html
- De Caceres M. & Legendre P. 2009. Associations between species and groups of sites: indices and statistical inference. Ecology 90, 3566-3574.
- De Caceres M., Legendre P. & Moretti M. 2010. Improving indicator species analysis by combining groups of sites. Oikos 119, 1674-1684.
- De Deckker P. & Forester R.M. 1988. The use of ostracods to reconstruct continental palaeoenvironmental records. In P. De Deckker et al. (eds.): Ostracoda in the Earth sciences. Pp. 175-199. Amsterdam: Elsevier.
- Desyatkin R.V., Lesovaya S.N., Okoneshnikova M.V. & Zaitseva T.S. 2011. Palevye (pale) soils of central Yakutia: genetic specificity, properties, and classification. European Soil Science 44, 1304-1314.
- Douglas M.S.V. & Smol J.P. 1993. Freshwater diatoms from High Arctic ponds (Cape Herschel, Ellesmere Island, N. W.T.). Nova Hedwigia 57, 511-552.
- Egorova A.A., Vasil’eva I.I., Stepanova N.A. & Fes’ko N.N. 1991. Flora tundrovoj zony Jakutii. (Flora of the tundra zone of Yakutia.) Jakutsk: Siberian Branch of the Soviet Academy of Sciences Publishers.
- Ehrlich A. 1995. Atlas of the inland-water diatom flora of Israel. Jerusalem: Israeli Academy of Science and Humanities.
- Elith J., Leath wick J.R. & Hastie T. 2008. Boosted regression trees—a new technique for modelling ecological data. Journal of Animal Ecology 77, 802-813.
- Ersov E.D. 1989. Geokriologija SSSR. Vostocnaja Sibir i Dal’nij Vostok. (Geocryology of USSR. Eastern Siberia and the Far East.) Moscow: Nedra.
- Fallu M.-A., Allaire N. & Pienitz R. 2002. Distribution of freshwater diatoms in 64 Labrador (Canada) lakes: species-environment relationships along latitudinal gradients and reconstruction models for water colour and alkalinity. Canadian Journal of Fisheries and Aquatic Sciences 59, 329-349.
- Frolova L., Nazarova L., Pestryakova L. & Herzschuh U. 2013. Subfossil cladoceran remains from sediment in thermokarst lakes in northeastern Siberia, Russia and their relationship to limnological and climatic variables. Journal of Palaeolimnology 52, 107-119.
- Gasse F., Fontes J.C., Plaziat J.C., Carbonel P., Kaczmarska L, De Deckker P., Soulie-Marsche I., Callot Y. & Dupeuble P.A. 1987. Biological remains, geochemistry and stable isotopes for the reconstruction of environmental and hydrological changes in the Holocene lakes from North Sahara. Palaeogeography, Palaeoclimatology, Palaeoecology 60, 141-146.
- Gavrilova M.K. 1998. Klimaty holodnyh regionov Zetnli. (Climates of cold regions of Earth.) Jakutsk: Siberian Branch of the Russian Academy of Sciences Publishers.
- Glezer S.I., Zuze A.P., Marakova I.V., Proskina-Lavrenko A. & Sesukova-Poreckaja V.S. (eds.) 1974. Diatomovye vodorosli SSSR. Iskopaemye i sovremennye. (The diatoms of the USSR. Fossil and recent.) Vol. 1. Leningrad: Nauka.
- Heegaard E., Lotter A.F. & Birks HJ.B. 2006. Aquatic biota and the detection of climate change: are there consistent aquatic ecotones? Journal of Paleolimnology 35, 507-518.
- Herzschuh U., Mischke S., Meyer H., Plessen B. & Zhang C. 2010. Lake nutrient variability inferred from elemental (C, N, S) and isotopic (613C; 61SN) analyses of aquatic plant macrofossils. Quaternary Science Reviews 29, 2161-2172.
- Herzschuh U., Pestryakova L.A., Savelieva L.A., Heinecke L., Bohmer T., Biskaborn B., Andreev A., Ramisch A., Shinneman A.L.C. & Birks HJ.B. 2013. Siberian larch forests and the ion content of thaw lakes for a geochemi- cally functional entity. Nature Communications 5, article no. 2408 doi: 10.1038/ncomms3408.
- Hustedt F. 1957. Die Diatomeenflora des FluBsystems der Weser im Gebiet der Hansestadt Bremen. (The diatom flora of the Weser River system in the area of the Hanseatic city of Bremen.) Abhandlungen Naturwissenschaftlicher Verein 34, 181-440.
- Isaev A.P., Protopopov A.V., Protopopova V.V., Egorova A.A., Timofeyev P.A., Nikolaev A.N., Shurduk I.F., Lytkina L.P., Ermakov N.B., Nikitina N.V., Efimova A. P., Zakharova V.I., Cherosov M.M., Nikolin E.G., Sosina N.K., Troeva E.I., Gogoleva P.A., Kuznetsova L.V., Pestryakov B.N., Mironova S.I. & Sleptsova N.P. 2010. Vegetation of Yakutia: elements of ecology and plant sociology. In E.I. Troeva et al. (eds.): The Far North: plant biodiversity and ecology of Yakutia. Pp. 143-260. Dordrecht: Springer.
- Juggins S. 2003. User guide C2—a program for analysing and visualising palaeoenvironmental data. Newcastle: Dept, of Geography, University of Newcastle.
- Kaplina T.N. 2011. Drevnie alasnye kompleksy Severnoj Jakutii (Soobscenie 1). (Ancient alas complexes of northern Yakutia [part 1].) Kriosfera Zemli 15, 3-13.
- Katamura F., Fukuda M., Bosikov N.P. & Desyatkin R.V. 2009. Charcoal records from thermokarst deposits in central Yakutia, eastern Siberia: implications for forest fire history and thermokarst development. Quaternary Research 71, 36-40.
- Klemm J., Herzschuh U., Pisaric M.F.J., Heim B., Telford RJ. & Pestryakova L.A. 2013. Assessment of a modem pollen- dimate calibration set for Arctic tundra and northern taiga biomes from northern Yakutia (eastern Siberia) and its applicability to a Holocene record. Palaeogeography, Palaeoclimatology, Palaeoecology 386, 702-713.
- Kodrau O.D. 1981. Climatic atlas of Asia. Geneva: World Meteorological Organisation.
- Kolbe R.W. 1927. Zur Okologie, Morphologic und Systematik der Brackwasser-Diatomeen. Fflanzenforschung 7. (On the ecology, morphology and systematics of brackish water diatoms. Plant Research 7.) Jena: Gustav Fischer.
- Komarenko L.E. & Vasileva LI. 1975. Presnovodnye diatomovye i sine-zelenye vodorosli vodoemov Jakutii. (Freshwater diatoms and blue-green algae of Yakutian waters.) Moscow: Nauka.
- Krammer K. 2000. The genus Pinnularia. Diatoms of Europe. Vol. 1. Konigstein: A.R.G. Gantner Verlag.
- Krammer K. 2002. Cymbella. Diatoms of Europe. Vol. 3. Konigstein: A.R.G. Gantner Verlag.
- Krammer K. 2003. Cymbopleura, Delicata, Navicymbula, Gomphocymbellopsis, Afrocymbella. Diatoms of Europe. Vol. 4. Konigstein: A.R.G. Gantner Verlag.
- Bacillariophyceae. Susswasserflora von Mitteleuropa. Band 2, teil 1-4. (Bacillariophyceae. Freshwater flora of central Europe. Vol. 2, parts 1-4.) Stuttgart: Gustav Fischer Verlag.
- Krammer K. & Lange-Bertalot H. 2000. Bacillariophyceae. Silfiwasserflora von Mitteleuropa. Band 2, teil 5. (Bacillariophyceae. Freshwater flora of central Europe. Vol. 2, part 5.) English and French translation of the keys. Stuttgart: Gustav Fischer Verlag.
- Laing T.E., Ruhland K.M. & Smol J.P. 1999. Past environmental and climatic changes related to tree-line shifts inferred from fossil diatoms from a lake near the Lena River Delta, Siberia. The Holocene 9, 547-557.
- Laing T.E. & Smol J.P. 2000. Factors influencing diatom distributions in circumpolar treeline lakes of northern Russia. Journal of Phycology 36, 1035-1048.
- Lange-Bertalot H. 2001. Navicula sensu stricto, 10 genera separated from Navicula sensu lato. Frustulia. Diatoms of Europe. Vol. 2. Konigstein: A.R.G. Gantner Verlag.
- Lange-Bertalot H. & Genkal S.I. 1999. Diatoms of Siberia. Iconographica diatomologica. Annotated diatom micrographs. Vol. 6. Konigstein: Koeltz Scientific Books.
- Lotter A.F., Birks HJ.B., Hofmann W. & Marchetto A. 1998. Modern diatom, cladocera, chironomid, and chry- sophyte cyst assemblages as quantitative indicators for the reconstruction of past environmental conditions in the Alps. II. Nutrients. Journal of Paleolimnology 19, 443-463.
- Lund J.W.G. 1950. Studies on Asterionella formosa Haas. II. Nutrient depletion and the spring maximum. Journal of Ecology 38,1-35.
- Makarova I.V. (ed.) 2002. Diatomovye vodorosli Rossii i sopredel'nyh stran: iskopaemye i sovremennye. (The diatoms of Russia and adjacent countries: fossil and recent.) Vol. II, issue 3. St. Petersburg: St. Petersburg State University Publishers.
- Marakova I.V. (ed.) 1988. Diatomovye vodorosli SSSR. Iskopaemye i sovremennye. (The diatoms of the USSR. Fossil and recent.) Vol. II-l. Leningrad: Nauka.
- Matveev LA. (ed.) 1989. Altas sel’skogo hozjajstva Jakutskoj ASSR. (Agricultural atlas of the Jakutian ASSR.) Moscow: Federal Agency of Geodesy and Cartography.
- Moiseeva A.I. & Nikolaev V.A. (eds.) 1992. Diatomovye vodorosli SSSR. Iskopaemye i sovremennye. (The diatoms of the USSR. Fossil and recent.) Vol. II-2. Leningrad: Nauka.
- Morozova L.V. (ed.) 1966. Spravocnik po klimatu SSSR. (Reference book on the climate of the USSR.) 1966. Issue 24, part 2. Leningrad: Gidrometeoizdat.
- Mostahov S.E. 1974. Ozera bassejna reki Lena. (Lakes of the Lena river basin.). In F.E. Are (ed.): Ozera kriolitoz- ony Sibiri. (Lakes of cryolithozone of Siberia.) Pp. 3-7. Novosibirsk: Nauka.
- Nazarova L., Herzschuh U., Wetterich S., Кишке T. & Pestjakova L. 2011. Chironomid-based inference models for estimating mean July air temperature and water depth from lakes in Yakutia, northeastern Russia. Journal of Palaeolimnology 45, 57-71.
- Nazarova L., Pestryakova L.A., Ushnickaya L.A. & Hubberten H.-W. 2008. Chironomids (Diptera: chirono- midae) of central Yakutian lakes and their indicative potential for palaeodimatic investigations. Contemporary Problems of Ecology 1, 335-345.
- New M., Lister D., Hulme M. & Makin I. 2002. A high- resolution data set of surface climate over global land areas. Climate Research 21, 1-25.
- Oksanen J., Guillaume Blanchet F., Kindt R., Legendre P., Minchin P.R., O’Hara R.B., Simpson G.L., Solymos P., Henry M., Stevens H. & Wagner H. 2014. Vegan: community ecology package. Version 2.3-5. https://cran.r- project.org/web/packages/vegan/index.html.
- Palagushkina O.V., Nazarova L.B., Wetterich S. & Schirrmeister L. 2012. Diatoms of modern bottom sediments in Siberian Arctic. Contemporary Problems of Ecology 5, 413-422.
- Pestrjakova L.A. 1998. Diatomei donnyh otlozenij ozera Nuocaha (bassejn Srednej Leny). (Diatoms of Lake Nuochaha sediments [Middle River, Lena Basin].) Nauka i Obrazovanie 1998-4, 63-65.
- Pestrjakova L.A. 2000. Diatomovye kompleksy ozernyh otlozhenij Jakutii v golocene. (Diatoms in Holocene lake sediments of Yakutia.) In LI. Zirkov et al. (eds.): Ozera holodnyh regionov. Chast' 4. Voprosy paleoklima- tologii, paleolimnologii i paleoekologii. (Lakes of cold regions. Vol. 4. Questions of palaeoclimatology, paleolimnology and palaeoecology.) Pp. 138-150. Jakutsk: Yakutsk State University Publishers.
- Pestrjakova L.A. 2004. Diatomovye kompleksy poverknost- nyh osadkov ozer Jakutii. (Diatom complexes of surface sediments of Yakutian lakes.) Nauka Obrazovanie 2004- 1, 19-25.
- Pestrjakova L.A. 2005. Diatomovye poverhnostnyh osadkov ozer i rek Tatta. (Diatoms in surface-sediments from lakes and rivers in Tatta.) In D.D. Sawinov et al. (eds.): Alasnye ekosistemy: struktura, funkcionirovanie i dinamika. (Alas ecosystems: structure, function and dynamics.) Pp. 101-107. Novosibirsk: Nauka.
- Pestrjakova L.A. 2010. Process evtrofirovanija ozer doliny Tujmaada (central’naya Jakutija). (The process of eutrophication of lakes in Tuymaada Valley [central Yakutia].) Nauka i Obrazovanie 2010-4, 82-87.
- Pestrjakova L.A., Bosikov N.P. & Ksenofontova M.I. 2007. Diatomovye kompleksy i himizm vody termokarstovyh ozer Jukecinskogo poligona. (Diatom complexes and water chemistry of permafrost lakes in the Yukechinsky polygon.) Nauka i Obrazovanie 2007-2, 19-24.
- Pestrjakova L.A., Psennikova E.V., Sobakina LG. & Usnickaja L.A. 2004. Ocenka sostojanija naselennyh punktov ver- hov’ja reki Tatta. (Estimation of ecological state of lakes from settlements of upper Tata River.) Dal’nevostocnoj Medicinskii Zurnal, Prilozenie 2004-1,42-43.
- Pestrjakova L.A., Subetto D.A., Gerasimova M.A., Andreev A. A., Diekmann B. & Popp S. 2008. Evoljucija prirodnoj sredy v Central’noj Jakutii v Golocene. (Evolution of the environment and climate of central Yakutia in the Holocene.) Izvestija Russiskogo Geograficeskogo Obscestva 140,49-62.
- Pestrjakova L.A. & Usnickaja L.A. 2000. Diatomei donnyh otlozenij ozer Tiksi (Respublika Saha). (Diatoms of sediments of lakes near Tiksi [Republic Sakha].) In LI. Zirkov et al. (eds.): Ozera kolodnyh regionov. Tom 4: voprosy paleoklimatologii, paleolimnologii i paleoekologii. (Lakes of cold regions. Vol. 4. Questions of palaeoclimatology, paleolimnology and palaeoecology.) Pp. 151-160. Jakutsk: Yakutsk State University Publishers.
- Pestryakova L.A., Herzschuh U., Wetterich S. & Ulrich M. 2012. Present-day variability and Holocene dynamics of permafrost-affected lakes in central Yakutia (eastern Siberia) inferred from diatom records. Quaternary Science Reviews 51, 56-70.
- Pienitz R., Smol J.P. & Birks HJ.B. 1995. Assessment of freshwater diatoms as quantitative indicators of past climatic change in the Yukon and Northwest Territories, Canada. Journal of Paleolimnology 13, 21-49.
- Potapova M. & Charles D.F. 2003. Distribution of benthic diatoms in U.S. rivers in relation to conductivity and ionic composition. Freshwater Biology 48, 1311-1328.
- Protas’ev M.C. (ed.) 1972. Leno-Indigirsky raion. (Leno- indigirsky area.) In: Resursy poverhnostnyh vod SSSR. Tom 17. (Resources of superficial waters in the USSR. Vol. 17.) Pp. 366-379. Leningrad: Gidrometeoizdat.
- R Core Team. 2013. R: a language and environment for statistical computing. Vienna: R Foundation for Statistical Computing.
- Reed J.M. 1998. A diatom-conductivity transfer function for Spanish salt lakes. Journal of Paleolimnology 19, 399- 416.
- Reed J.M., Mesquita-Joanes F. & Griffiths H.I. 2012. Multiindicator conductivity transfer functions for Quaternary palaeoclimate reconstruction. Journal of Paleolimnology 47, 251-275.
- Renberg I. & Hultberg H. 1992. A paleolimnological assessment of acidification and liming effects on diatom assemblages in a Swedish lake. Canadian Journal of Fisheries and Aquatic Sciences 49, 65-72.
- Ridgeway G. 2013. gbm: generalized Boosted Regression Models, http://cran.r-project.org/web/packages/gbm/index.html
- Rosen P., Hall R., Korsman T. & Renberg I. 2000. Diatom transfer-functions for quantifying past air temperature, pH and total organic carbon concentration from lakes in northern Sweden. Journal of Paleolimnology 24,109-123.
- Round F., Crawford R. & Mann D. 1990. The diatoms. Cambridge: Cambridge University Press.
- Ruhland K., Priesnitz A. & Smol J.P. 2003. Evidence for recent environmental changes in 50 lakes across the Canadian Arctic treeline. Arctic, Antarctic, and Alpine Research 35, 110-123.
- Ruhland K.M., Smol J.P. & Pienitz R. 2003. Ecology and spatial distributions of surface-sediment diatoms from 77 lakes in the Subarctic Canadian treeline region. Canadian Journal of Botany 81, 57-73.
- Sawinov D.D., Mironova S.I. & Bosikov N.P. (eds.) 2005. Alasnye ekosistemy: struktura, funkcionirovanie i dinamika. (Alas ecosystems: structure, function and dynamics.) Novosibirsk: Nauka.
- Schneider A., Wetterich S., Schirrmeister L., Herzschuh U., Meyer H. & Pestryakova L.A. 2016. Freshwater ostracods (Crustacea) and environmental variability of polygon ponds in the tundra of the Indigirka Lowland, northeast Siberia. Polar Research 35, article no. 25225 doi: 10.3402/polar.v35.25225.
- Schonfelder I. 2000. Indikation der Gewasserbeschaffenheit durch Diatomeen. Handbuch Angewandte Limnologie 9. (Indication of water conditions by diatoms. Handbook of Applied Limnology 9.) Landsberg/Lech: Ecomed-Verlag.
- Schonfelder J., Gelbrecht J. & Steinberg C.E.W. 2002. Littoral diatoms and their chemical environment: relationships in northeastern German lakes and rivers. Journal of Phycology 38, 66-82.
- Self A.E., Brooks S.J., Birks H.J.B., Nazarova L., Porinchu D., Odland A., Yang H. & Jones VJ. 2011. The distribution and abundance of chirono- mids in high-latitude Eurasian lakes with respect to temperature and continentality: development and application of new chironomid-based climate-inference models in northern Russia. Quaternary Science Reviews 30, 1122-1141.
- Shinneman A.L.C., Bennett D., Fritz S., Schmieder J. & Engstrom D. 2010. Inferring lake depth using diatom assemblages in the shallow, seasonally variable lakes of the Nebraska Sand Hills (USA): calibration, validation, and application of a 69-lake training set. Journal of Palaeolimnology 44, 443-464.
- Shinneman A.L.C., Edlund M.B., Almendinger J.E. & Soninkhishig N. 2009. Diatoms as indicators of water quality in western Mongolian lakes: a 54-site calibration set. Journal of Paleolimnology 42, 373-389.
- Skrjabin S.Z. & Karavaev M.N. 1991. Zelenyj pokrov Jakutii. (Green cover of Yakutia.) Jakutsk: Kniznoe Izdatel’stvo Book Publisher.
- Smol J.P. & Douglas M.S.V. 2007. Crossing the final ecological threshold in High Arctic ponds. Proceedings of the National Academy of Sciences of the USA 104, 12395- 12397.
- Smol J.P., Wolfe A.P., Birks HJ.B., Douglas M.S.V., Jones VJ., Korhola A., Pienitz R., Ruhland K.M., Sorvari S., Antoniades D., Brooks SJ., Fallu M.-A., Hughes M., Keatley B.E., Laing T.E., Michelutti N.. Nazarova L., Nyman M., Paterson A.M., Perren B., Quinlan R., Rautio M., Saulnier-Talbot Ё., Siitonen S., Solovieva N. & Weckstrom J. 2005. Climate-driven regime shifts in the biological communities of Arctic lakes. Proceedings of the National Academy of Sciences of the USA 102, 4397-4402.
- Stocker T.F., Qin D., Plattner G.-K., Tignor M., Allen S.K., Boschung J., Nauels A., Xia Y., Вех V. & Midgley P.M. eds. 2013. Climate change 2013. The physical science basis. Contribution of Working Group I to the fifth assessment report of the Intergovernmental Panel on Climate Change. Cambridge and New York: Cambridge University Press.
- Stoermer E.F. & Smol J.P. (eds.) 1999. The diatoms: applications for the environmental and Earth sciences. Cambridge: Cambridge University Press.
- Sylvestre F., Servant-Vildary S. & Roux M. 2001. Diatombased ionic concentration and salinity models from the south Bolivian Altiplano (15-23°S). Journal of Paleolimnology 25, 279-295.
- Ter Braak CJ.F. & Looman C.W.N. 1986. Weighted averaging, logistic regression and the Gaussian response model. Vegetation 65, 3-11.
- Ter Braak CJ.F. & Van Dam H. 1989. Inferring pH from diatoms: a comparison of old and new calibration methods. Hydrobiologia 178, 209-223.
- Timofeev P.A. 2003. Derev’ya i kustamiki Jakutii. (Trees and shrubs of Yakutia.) Yakutsk: Bicik.
- Vasileva LI. 1989. Analiz vidovogo sostava i dinamiki pazvitija vodoroslej vodoemov Jakutii. (Analysis of species composition and dynamics of algal development in the waters of Yakutia.) Jakutsk: Siberian Branch of the Russian Academy of Sciences Publishers.
- Veksler N.M., Ukolova T.K. & Sviridenko V.D. 2008. Issledovanija vodnyh biologicheskih resursov Kamchatki i severo-zapadnoj chasti Tihogo okeana. (Studies of biological water resources of Kamchatka and the north-western part of the Pacific Ocean.) Issledovanija Vodnyh Resursov Kamchatki i Severo- Zapadnoj Chasti Tihogo Okeana 10, 5-12.
- Vitvickij G.N. 1965. Klirnat Jakutii. (The climate of Yakutia.) Moscow: Nauka.
- Wang O., Yang X., Hamilton P.B. & Zhang E. 2012. Linking spatial distributions of sediment diatom assemblages with hydrological depth profiles in a plateau deep-water lake system of subtropical China. Fottea 12, 59-73.
- Wang W. & Evans R.L. 1969. Variation of silica and diatoms in a stream. Limnology and Oceanography 14, 941- 944.
- Weckstrom J. & Korhola A. 2001. Patterns in the distribution, composition and diversity of diatom assemblages in relation to ecoclimatic factors in Arctic Lapland. Journal of Biogeography 28, 31-45.
- Weckstrom J., Korhola A. & Blom T. 1997. Diatoms as quantitative indicators of pH and water temperature in Subarctic Fennoscandian lakes. Hydrobiologia 347, 171— 184.
- Wetterich S., Herzschuh U., Meyer H., Pestryakova L., Plessen B., Lopez C.M.L. & Schirrmeister L. 2008. Evaporation effects as reflected in freshwaters and ostra- cod calcite from modem environments in central and northeast Yakutia (east Siberia, Russia). Hydrobiologia 614, 171-195.
- Wetterich S., Schirrmeister L., Meyer H., Viehberg F.A. & Mackensen A. 2008. Arctic freshwater ostracods from modern periglacial environment in the Lena River Delta (Siberian Arctic, Russia): geochemical applications for palaeoenvironmental reconstructions. Journal of Paleolimnology 39, 427-449.
- Wetzel R.G. 2001. Limnology of lake and river ecosystems. 3rd edn. San Diego: Academic Press.
- Wilson S.E., Cumming B.F. & Smol J.P. 1994. Diatombased salinity relationship in 111 lakes from the Interior Plateau of British Columbia, Canada: the development of diatom-based model for paleosalinity and paleoclimatic reconstructions. Journal of Paleolimnology 12, 197-221.
- Wunsam S., Schmidt R. & Klee R. 1995. Cyclotella (Bacillariophyceae) in lake of the Alpine region and their relationship to environmental variables. Aquatic Sciences 57, 360-386.
- Yang X., Kamenik C., Schmidt R. & Wang S. 2003. Diatom-based conductivity and water-level inference models from eastern Tibetan (Qinghai-Xizang) Plateau lakes. Journal of Paleolimnology 30, 1-19.
- Zhang W., Miller P.A., Smith B., Wania R., Koenigk T. & Doscher R. 2013. Tundra shrubification and tree-line advance amplify Arctic climate warming: results from an individual-based dynamic vegetation model. Environmental Research Letters 8, article no. 034023 doi: 10.1088/1748-9326/8/3/034023.
Related Articles
Shengni Duan
Zhina Jiang
Min Wen
Olof Bengtsson
Kit M. Kovacs
Christian Lydersen
Øystein Varpe
Geir W. Gabrielsen
Michał Hubert Węgrzyn
Beata Cykowska-Marzencka
Monica Alterskjær Sundset
Paulina Wietrzyk-Pełka
et al.
Clémentine Peggy Anne-Marie Colpaert
Boris Leonidovich Nikitenko