This article is published under a Creative Commons license and not by the author of the article. So if you find any inaccuracies, you can correct them by updating the article.

Walruses recovering after 60+ years of protection in Svalbard, Norway


Kit M. Kovacs
Jon Aars
Christian Lydersen
Published: Oct. 7, 2014
Latest article update: Aug. 21, 2023
This article is published under the license


Abstract
Walruses were brought to the brink of extinction in Svalbard (Norway) during 350 years of unregulated harvesting. They became protected in 1952, when few remained. During the first 30 years of protection, approximately 100 animals became established within the archipelago, most of which likely came from Franz Josef Land, to the east. A marked recovery has taken place since then. This study reports the results of a photographic aerial survey flown in summer 2012, covering all current and historical haul-out sites for walruses in Svalbard. It provides updates regarding the increasing numbers of: (1) land-based haul-out sites (from 78 in 2006 to 91 in 2012); (2) occupied sites (from 17 in 2006 to 24 in the 2012 survey); (3) sites with mother–calf pairs (which increased from a single site with a single small calf in 2006 to 10 sites with a total of 57 small calves in 2012) and; (4) a 48% increase in abundance in the six-year period between the two surveys to 3886 (confidence interval 3553–4262) animals, including animals in the water at the time of the survey. Future environmental change might reduce benthic production in the Arctic, reducing the prey-base for walruses, and also impact walruses directly via declines in their sea-ice breeding habitat. But, currently the Svalbard walrus population is growing at a rate that matches the theoretical maximum rate of growth that has been calculated for recovering walrus populations under favourable environmental conditions with no food limitations.
Keywords
Arctic, expansion, mother–calf distribution, population trend, pinniped
Walruses were brought to the brink of extinction in Svalbard (Norway) during 350 years of unregulated harvesting. Hunting of walruses for ivory, blubber and skins started in the early days of whaling in the archipelago during the 1600s (Norderhaug 1969; Gjertz & Wiig 1994). They finally became protected from hunting in 1952 (Government of Norway 1952), when few remained. Moffen Island became protected in 1983 as a summer haul-out reserve (15 May–15 September) for walruses and in the last few years many areas on the east coast of Svalbard that contain haul-out sites and feeding grounds for walruses have been declared marine reserves (see area restrictions at www.sysselmannen.no. Øritsland (1973) summarized walrus sightings in Svalbard from 1961 to 1971, and concluded that protection of the population had led to increasing numbers of animals. Born (1984) extended the exploration of sighting records to include the period from 1954 to 1982 and concluded that the summering-stock consisted of some 100 animals in the early 1980s, mainly due to increases that took place during the 1970s. The role of immigration from Franz Josef Land (FJL) in the re-establishment of walruses in Svalbard cannot be quantified because the animals in both regions are one genetic population (Wiig et al. 1996; Andersen et al. 1998), but, it is likely that growth in Svalbard was at least initially due to movement of animals from the Russian Arctic. The isolated position of FJL helped to prevent population collapse in that section of the Barents Sea (Wiig et al. 1996). Some hunting did take place in FJL, with about 12 400 animals killed from 1897 to 1955, from a population that is estimated to have numbered 6000–12 000 at the start of this 58-year period (Gjertz et al. 1998). But, this compares with over 17 000 walruses from Svalbard landed in Norway alone in a 43-year period (between 1871 and 1914), with additional takes before and after by Norwegian hunters, in addition to harvesting by many other nations.
During the first attempt to actually survey walruses in Svalbard, Gjertz & Wiig (1995) registered a total of 741 individuals, based on maximum counts at haul-out sites during a series of mixed-platform surveys that took place between August and October in 1993. The first systematic survey that included adjustment factors accounting for the proportion of animals in the water when the surveys were flown, estimated that walruses numbered 2629 (confidence interval [CI] 2318–2998) in Svalbard in 2006 (Lydersen et al. 2008). Although not directly comparable with the earlier surveys because of differences in methodology, the increase suggested by the 2006 survey corresponds with a general increase in sighting rates of walruses in Svalbard, and an increase in the number of places where people report seeing walruses (Svalbard Marine Mammal Sighting Database [MMSDB], Norwegian Polar Institute).
In modern times, the Svalbard fraction of the Svalbard–FJL walrus population has been heavily dominated by males, which still make up the vast majority of the population (Born 1984; Gjertz & Wiig 1995; Lydersen et al. 2008). It is normal for walrus bulls to haul-out in all-male groups and to occur in somewhat different areas than females with calves (Miller 1976; Fay 1982). But, the extreme dominance of males seen in Svalbard is not typical for a whole stock within such a large area, nor was this extreme sex bias always the case. Examination of the sex ratio at historical hunting sites in the south-east of Svalbard (assessed through mandible measurements) suggest that females made up about a third of the population in the 1800s (Wiig et al. 2007) and historical accounts from the archipelago also make specific mention of mothers and calves in various areas (e.g., Chydenius 1865; Collett 1911–1912).
The purpose of the present study was to update information on the current distribution of walrus haul-out locations in Svalbard, explore the current distribution of females with calves and to update the estimate of walrus abundance in Svalbard during the summer period. Walrus haul-out sites are reported to the Norwegian Polar Institute's MMSDB annually from the cruise-ship tourist industry and also from other ships of opportunity (Norwegian coast guard, scientific expeditions, etc.), such that an updated record is kept of where walruses have been sighted ashore every year. This record of haul-out locations facilitated planning the flight paths for the current survey effort. In this study, all known historical and currently used sites were visited (n=91) between 28 July and 15 August 2012, using a Piper Cheyenne 31-T (PH-SVX) aircraft flying at 250 km/h. High resolution (13 080×20 010 pixels; 80×100.5 mm) digital photographs were taken at 3-s intervals from a height of 350 m, with 20% overlap between pictures covering all haul-out sites. Surveys were flown only during good weather (low wind, good visibility).
All images (n=1059) were carefully inspected and all walruses on shore or grounded in the shallows near haul-out locations were counted on the images. Particular attention was paid to searching the images for the presence of small calves. Swimming walruses were not included in the counts even if they were clearly visible on the images because the telemetric records used to create the correction factor for the survey count these as aquatic records. All swimming animals were accounted for using the adjustment factor from Lydersen et al. (2008, also used in Lydersen et al. 2012), based on satellite telemetry records for 23 animals (28×30-day periods; five animals had records in two years) in late summer in the period 2002–05 in Svalbard. The proportion of walruses expected to be in the sea (pSea) during the survey was assumed to be the average for all of the 28×30-day periods (0.7545); the number counted on the digital pictures multiplied by pSea/(1−pSea). The variance of log (pSea/[1−pSea]) was 0.106. But, walruses do not haul-out randomly; there are correlations among individuals, with walruses tagged at the same time showing synchronicity in their subsequent haul-out patterns, even when they hauled out in different places. An over-dispersion parameter of 2.02 (deviance=28.33, df=14) was therefore included in the measure of variance, based on analyses of 2002–05 telemetry data (see Lydersen et al. 2008 for details). Since the Lydersen et al. (2008) survey was conducted in a year without telemetry data, as is the case for the present survey, the deviance accounted for by year was not removed from the model. The variance in individual (logit transformed) time at sea (0.106) was multiplied with the over-dispersion parameter to achieve a corrected standard error (0.088) around the estimate.
The total number of sites reported in the MMSDB has increased from the time of the first walrus aerial survey in 2006 from 78 to 91 at the time of this study (2012). The number of sites actually occupied at the time of the surveys in 2006 and 2012 increased by 41%, from 17 to 24 sites (Table 1). The number of sites containing mothers with calves increased from a single site with a single calf in 2006 to 10 sites (42% of occupied sites), with a total of 57 small calves counted in 2012. This number is definitely an underestimate of the number of dependent calves, as only small, first-year calves were counted and walruses remain with their mothers for several years. The number of animals at the various haul-out sites ranged from one to 159 individuals. All groups that numbered over 100 (n=3) included females with calves, although smaller groups (with a minimum of 16 animals in this survey) also included mother–calf pairs. The number of walruses counted on the high-resolution aerial survey photographs was 954 individuals. Blind counts were performed by two people, with zero variance between counts. High-resolution aerial survey images do not suffer from the reader errors that are common in ship or ground-based counts (Udevitz et al. 2005) and the relatively small groups at haul-out sites in Svalbard make counting individuals an easy task. Using the correction factor calculated from Lydersen et al. (2008), 2932 animals were estimated to have been in the water when the surveys were flown, bringing the total estimated number of animals in the Svalbard Archipelago during the summer of 2012 to 3886 (CI 3553–4262).
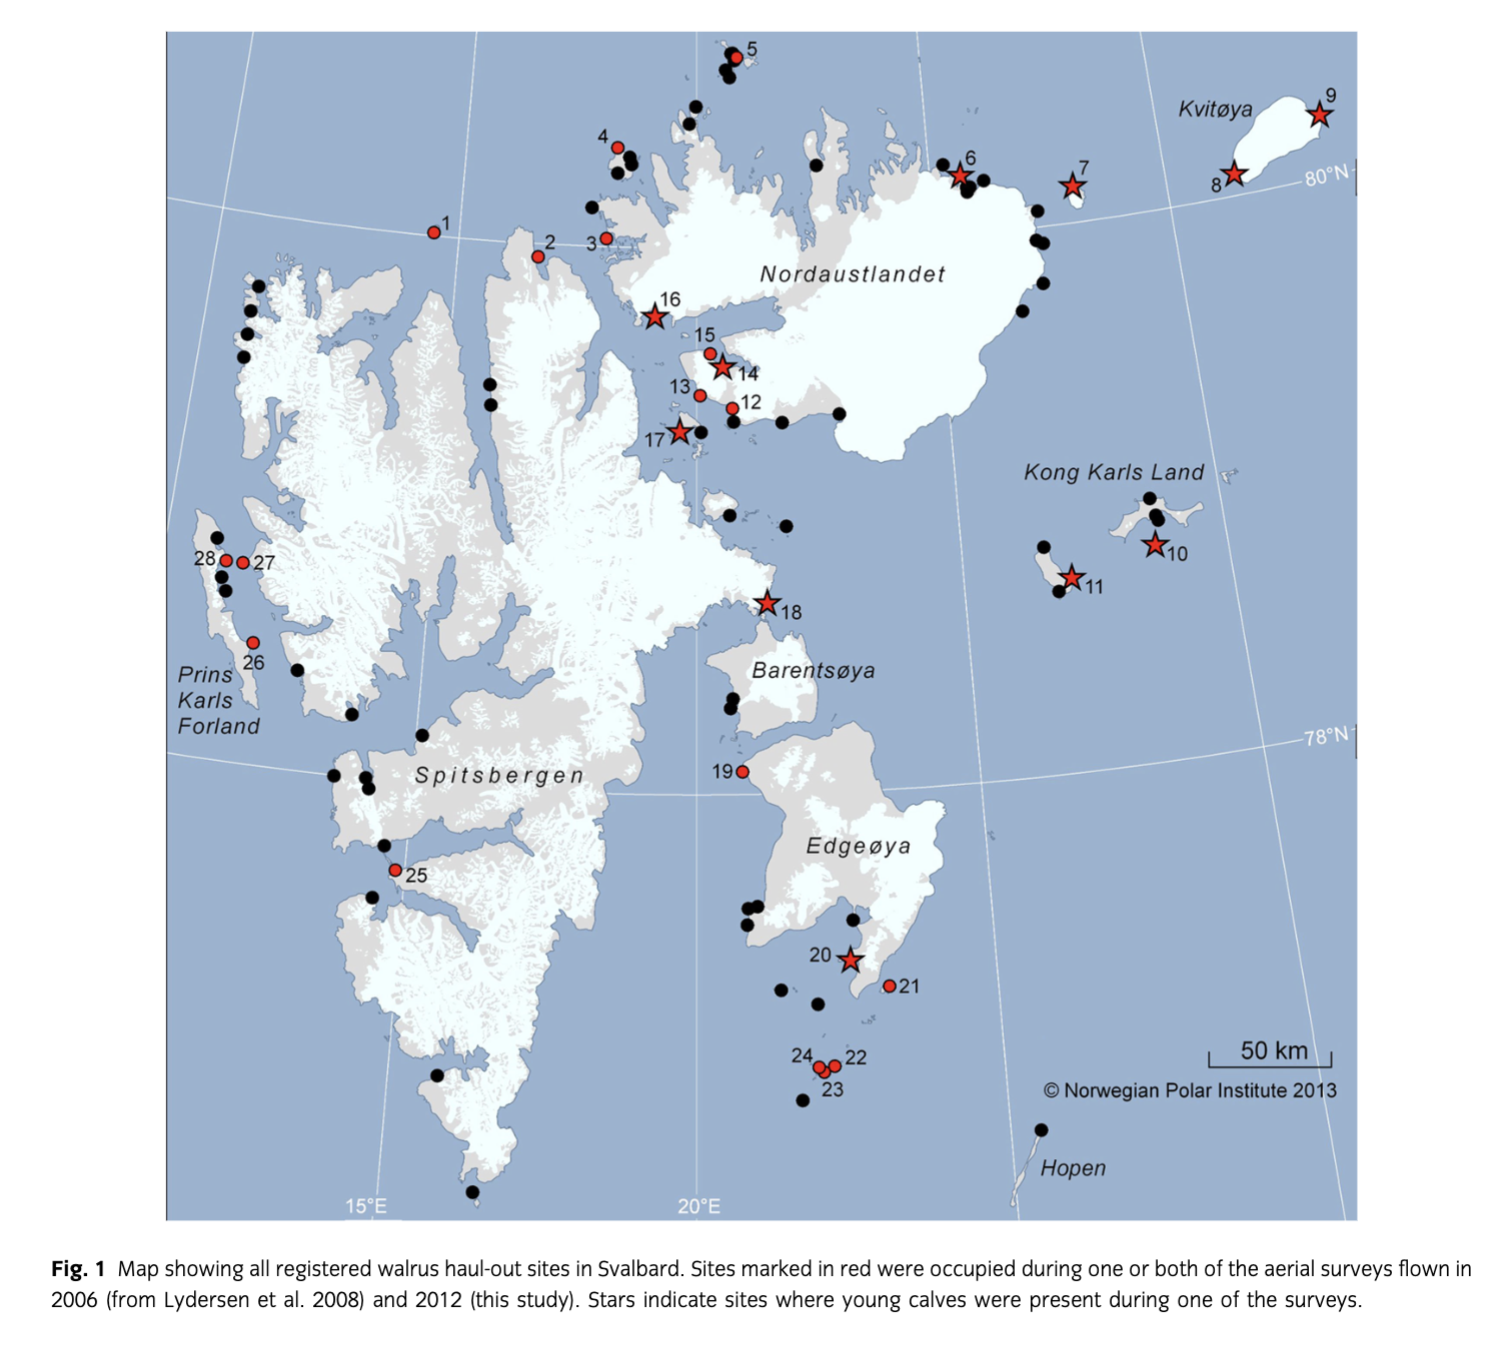
Table 1 Numbers of walruses counted on high-resolution digital photographs of haul-out areas during aerial surveys in Svalbard, August 2006 (from Lydersen et al. 2008) and 2012 (this study). Map reference numbers refer to specific haul-out sites, identified on the map (Fig. 1). Numbers in parentheses indicate the number of young calves present. | |||
Map reference | Haul-out area | No. of walruses in 2006 | No. of walruses in 2012 |
1 | Moffen | 11 | 63 |
2 | Eolusneset | – | 1 |
3 | Ringertzøya | – | 11 |
4 | Lågøya | 37 | 39 |
5 | Isflakbukta | 10 | 7 |
6 | Boeckøyaa | 31 | 32 (6) |
7 | Storøya (Polarstarodden) | 110 | 131 (13) |
8 | Andréeneset | – | 132 (19) |
9 | Kræmerpynten | 67 (1) | – |
10 | Helgolandøya | – | 16 (1) |
11 | Kapp Weissenfels | – | 21 (1) |
12 | Augustabukta | 4 | – |
13 | Glitneneseta | 31 | 18 |
14 | Palanderbukta | 13 | 65 (2) |
15 | Ytre Palanderbukta | 3 | – |
16 | Narkvaløya | 9 | 76 (2) |
17 | Ardneset (Wahlbergøya) | 14 | 25 (3) |
18 | Buchholzbukta | – | 159 (3) |
19 | Kapp Lee | 24 | 2 |
20 | Andréetangen | 125 | 55 (7) |
21 | Halvmåneøya | 1 | 2 |
22 | Havmerra | 34 | – |
23 | Slettholmen | 133 | 28 |
24 | Kalvøya | – | 1 |
25 | Mariasundet | – | 1 |
26 | Poolepynten | – | 50 |
27 | Sarstangen | – | 4 |
28 | Murraypynten | – | 15 |
Summary | Total count | 657 | 954 |
No. of sites occupied | 17 | 24 | |
No. of sites with calves | 1 | 10 | |
Total no. of small calves | 1 | 57 | |
Total estimate | 2629 (CI 2318–2998) | 3886 (CI 3553–4262) | |
aBoeckøya and Glitneneset are now the official names for these haul-out sites, which were referred to as Kapp Brunnøya and Svartneset, respectively, in Lydersen et al. (2008).
Prior to the next survey in this area, the correction factor for animals in the water should be updated; the current estimator accounts only for male behaviour and is now over a decade old. Changes in haul-out behaviour due to changing environmental conditions, with reduced sea ice and higher air (Nordli et al. 2014) and water temperatures (Pavlov et al. 2013) might be taking place. Also, females with dependent young are increasing in number, and these animals might not spend the same proportion of the time in the water as adult males. Ideally, animals of both sexes in the survey area should have satellite tags operating during the survey time, so that accurate adjustments to haul-out numbers can be made. The CI presented in this survey may be too narrow; further studies on temporal variation in haul-out and swimming behaviour of Svalbard walruses may make it possible to address this and adjust the uncertainty more adequately in the future.
Walruses in Svalbard might face future challenges induced by global climate warming reducing their sea-ice breeding habitat (Kovacs et al. 2011) and lowering benthic production levels, which would decrease the availability of their bivalve prey (Vincent et al. 2011). Such food web changes might cause walruses to shift toward a greater dependence on higher trophic prey such as seals (Skoglund et al. 2010; Seymor et al. 2014), increasing their risks with respect to contaminants. Additionally, climate warming might intensify the impacts of some contaminants (Noyes et al. 2009), which could pose a risk to walruses in Svalbard because some contaminant levels are still high in this population, although most legacy compounds have dropped markedly over the past decade (Wolkers et al. 2006). But, this survey confirms several very positive trends and clearly shows signs of recovery of this walrus population following over 60 years of protection in Svalbard, similar to many other pinniped populations that have been protected from harvesting after extreme exploitation (see Lotze et al. 2011; Magera et al. 2013). While it is not possible to determine with certainly whether the increasing numbers of walruses in Svalbard are in part due to immigration from FJL, the increasing number of calves born in Svalbard suggests that at least some of the increase is due to local production of young. This is tied to a normalization of the sex ratio taking place in Svalbard, with females increasingly occupying the region. Perhaps most notably, in the six-year period between the two aerial surveys that have been conducted on this population, the number of animals has increased by an estimated 48%, representing close to an 8% increase per year. This crude estimation of the population growth rate matches the theoretical maximum rate of growth that has been calculated for recovering walrus populations under favourable environmental conditions with no food limitations (see Sease & Chapman 1988; Chivers 1999; Witting & Born 2014).
Acknowledgements
This study was funded by the Norwegian Polar Institute. We thank Harald Faste Aas for his interface support with the aircraft operations.
References
- Andersen L.W., Born E.W., Gjertz I., Wiig Ø., Holm L.-E. & Bendixsen C. 1998. Population structure and gene flow of the Atlantic walrus (Odobenus rosmarus rosmarus) in the eastern Atlantic Arctic based on mitochondrial DNA and microsatellite variation. Molecular Ecology 7, 1323–1336. PubMed Abstract | Publisher Full Text
- Born E.W. 1984. Status of the Atlantic walrus Odobenus rosmarus rosmarus in the Svalbard area. Polar Research 2, 27–45. Publisher Full Text
- Chivers S. 1999. Biological indices for monitoring population status of walrus evaluated with an individual-based model. In G. Garner et al. (eds.): Marine mammal survey and assessment methods. Proceedings of the Symposium on Surveys, Status & Trends of Marine Mammal Populations. Pp. 239–247. Rotterdam: Balkema.
- Chydenius K. 1865. Svenska expeditionen till Spetsbergen år 1961 under ledning av Otto Torell. (The Swedish expedition to Spitsbergen in 1961 under the leadership of Otto Torell.) Stockholm: P.A. Norstedt & Söner.
- Collett R. 1911–1912. Norges hvirveldyr. Bd. 1. Norges pattedyr. (Norway's vertebrates. Vol. 1. Norway's mammals.) Kristiania: H. Aschehoug & Company.
- Fay F.H. 1982. Ecology and biology of the Pacific walrus Odobenus rosmarus divergens Illiger. Fish and Wildlife Service Bulletin Number 74. Washington, DC: US Department of the Interior.
- Gjertz I. & Wiig Ø. 1994. Past and present distribution of walruses in Svalbard. Arctic 47, 34–42. Publisher Full Text
- Gjertz I. & Wiig Ø. 1995. The number of walruses (Odobenus rosmarus) in Svalbard in summer. Polar Biology 15, 527–530. Publisher Full Text
- Gjertz I., Wiig Ø. & Øristland N.A. 1998. Back calculation of original population size for walruses Odobenus rosmarus in Franz Josef Land. Wildlife Biology 4, 223–230.
- Government of Norway 1952. Fredning av hvalross. (Protection of walruses.) Kongelig resolusjon, 20 juni 1952. (Royal decree, 20 June 1952.)
- Kovacs K.M., Moore S., Overland J.E. & Lydersen C. 2011. Impacts of changing sea-ice conditions on Arctic marine mammals. Marine Biodiversity 41, 181–194. Publisher Full Text
- Lotze H.K., Coll M., Magera A.M., Ward-Paige C. & Airoldi L. 2011. Recovery of marine animal populations and ecosystems. Trends in Ecology & Evolution 26, 595–605. PubMed Abstract | PubMed Central Full Text | Publisher Full Text
- Lydersen C., Aars J. & Kovacs K.M. 2008. Estimating the number of walruses in Svalbard from aerial surveys and behavioural data from satellite telemetry. Arctic 61, 119–128.
- Lydersen C., Chernook V.I., Glazov D.M., Trukhanova I.S. & Kovacs K.M. 2012. Aerial survey of Atlantic walruses (Odobenus rosmarus rosmarus) in the Pechora Sea, August 2011. Polar Biology 35, 1555–1562. Publisher Full Text
- Magera A.M., Mills Flemming J.E., Kaschner K., Christensen L.B. & Lotze H.K. 2013. Recovery trends in marine mammal populations. PLoS One 8(10), e77908, doi: 10.1371/journal.pone.0077908. Publisher Full Text
- Miller E.H. 1976. Walrus ethology. 2. Herd structure and activity budgets of summering males. Canadian Journal of Zoology 54, 704–715. Publisher Full Text
- Norderhaug M. 1969. Hvalrossens (Odobenus rosmarus) forekomst i Svalbardområdet 1960–1967. (Walrus [Odobenus rosmarus] occurrence in the Svalbard area, 1960–1967.) Norsk Polarinstitutts Årbok 1969, 146–150.
- Nordli Ø., Przybylak R., Ogilvie A.E.J. & Isaksen K. 2014. Long-term temperature trends and variability on Spitsbergen: the extended Svalbard Airport temperature series, 1898–2012. Polar Research 33, article no. 21349, doi: 10.3402/polar.v33.21349. Publisher Full Text
- Noyes P.D., McElwee M.K., Miller H.D., Clark B.W., van Tiem L.A., Walcott K.C., Erwin K.N. & Levin E.D. 2009. The toxicology of climate change: environmental contaminants in a warming world. Environment International 35, 971–986. PubMed Abstract | Publisher Full Text
- Øritsland T. 1973. Walrus in the Svalbard area. In Seals. Proceedings of a working meeting of seal specialists on threatened and depleted seals of the world, held under the auspices of the Survival Service Commission of IUCN. IUCN Publications New Series, Supplementary Paper 39. Pp. 59–68. Morges, Switzerland: International Union for the Conservation of Nature and Natural Resources.
- Pavlov A.K., Tverberg V., Ivanov B.V., Nilsen F., Falk-Petersen S. & Granskog M.A. 2013. Warming of Atlantic Water in two west Spitsbergen fjords over the last century (1912–2009). Polar Research 32, article no. 11206, doi: 10.3402/polar.v32i0.11206. Publisher Full Text
- Sease J. & Chapman D. 1988. Pacific walrus Odobenus rosmarus divergens. In J. Lentfer (ed.): Selected marine mammals of Alaska. Pp. 17–38. Washington, DC: Marine Mammal Commission.
- Seymor J., Hostmann-Dehn L. & Wooller M.J. 2014. Inter-annual variability in the proportional contribution of higher trophic levels to the diet of Pacific walrus. Polar Biology 37, 597–609. Publisher Full Text
- Skoglund E.G., Lydersen C., Grahl-Nielsen O., Haug T. & Kovacs K.M. 2010. Fatty-acid composition of the blubber and dermis of adult male Atlantic walruses (Odobenus rosmarus rosmarus) in Svalbard, and their potential prey. Marine Biology Research 6, 239–250. Publisher Full Text
- Udevitz M.S., Jay C.V. & Cody M.B. 2005. Observer variability in pinniped counts: ground-based enumeration of walruses at haul-out sites. Marine Mammal Science 21, 108–120. Publisher Full Text
- Vincent W.F., Callaghan T.V., Dahl-Jensen D., Johansson M., Kovacs K.M., Michel C., Prowse T., Reist J.D. & Sharp M. 2011. Ecological implications of changes in the Arctic cryosphere. Ambio 40, 87–99. PubMed Central Full Text | Publisher Full Text
- Wiig Ø., Born E.W., Gjertz I., Lydersen C. & Stewart R.E.A. 2007. Historical sex-specific distribution of Atlantic walrus (Odobenus rosmarus rosmarus) in Svalbard assessed by mandible measurements. Polar Biology 31, 69–75. Publisher Full Text
- Wiig Ø., Gjertz I. & Griffiths D. 1996. Migration of walrus (Odobenus rosmarus) in the Svalbard and Franz Josef Land area. Journal of Zoology, London 238, 769–784. Publisher Full Text
- Witting L. & Born E.W. 2014. Population dynamics of walruses in Greenland. In R.E.A. Stewart et al. (eds.): Walrus of the North Atlantic. NAMMCO Scientific Publications Series 9. Tromsø: North Atlantic Marine Mammal Commission.
- Wolkers H., Van Bavel B., Ericson I., Skoglund E., Kovacs K.M. & Lydersen C. 2006. Congener-specific accumulation and patterns of chlorinated and brominated contaminants in adult male walruses from Svalbard, Norway: implications for individual-specific prey selection. Science of the Total Environment 370, 70–79. PubMed Abstract | Publisher Full Text
Related Articles
Shengni Duan
Zhina Jiang
Min Wen
Olof Bengtsson
Kit M. Kovacs
Christian Lydersen
Øystein Varpe
Geir W. Gabrielsen
Michał Hubert Węgrzyn
Beata Cykowska-Marzencka
Monica Alterskjær Sundset
Paulina Wietrzyk-Pełka
et al.
Clémentine Peggy Anne-Marie Colpaert
Boris Leonidovich Nikitenko